. 2024 Jan 22;10(3):e24599.
doi: 10.1016/j.heliyon.2024.e24599. eCollection 2024 Feb 15.

Exploring the DNA2-PNA heterotriplex formation in targeting the Bcl-2 gene promoter: A structural insight by physico-chemical and microsecond-scale MD investigation

Affiliations

Exploring the DNA2-PNA heterotriplex formation in targeting the Bcl-2 gene promoter: A structural insight by physico-chemical and microsecond-scale MD investigation

Andrea P Falanga et al. Heliyon. .

Abstract

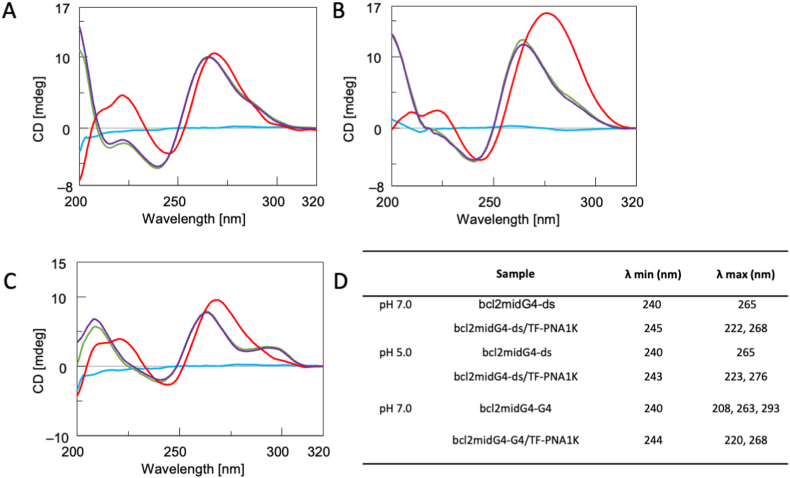
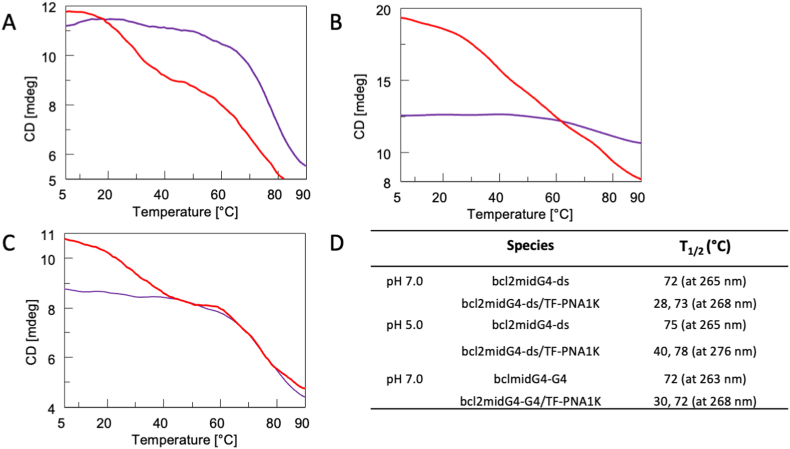
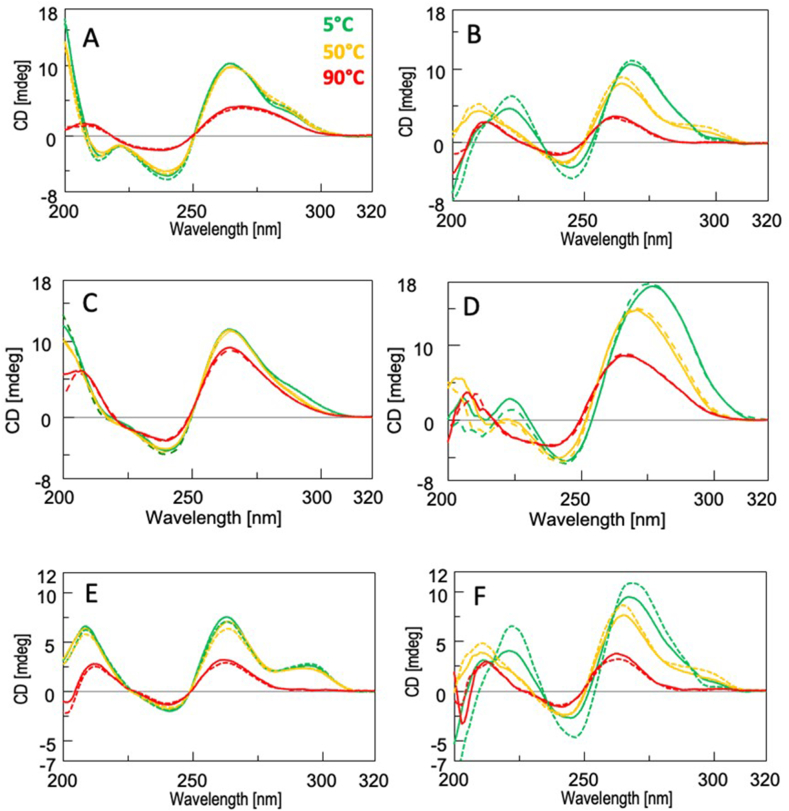
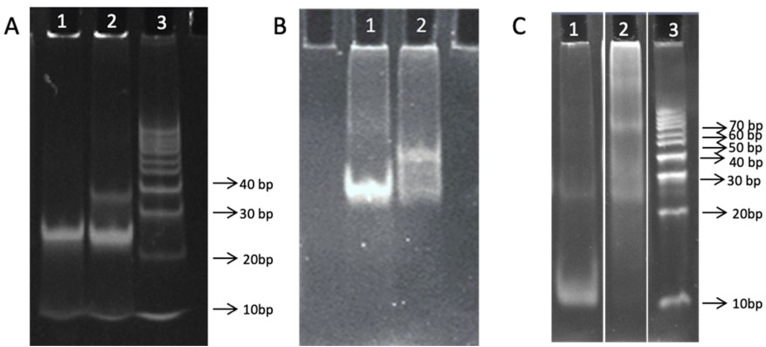
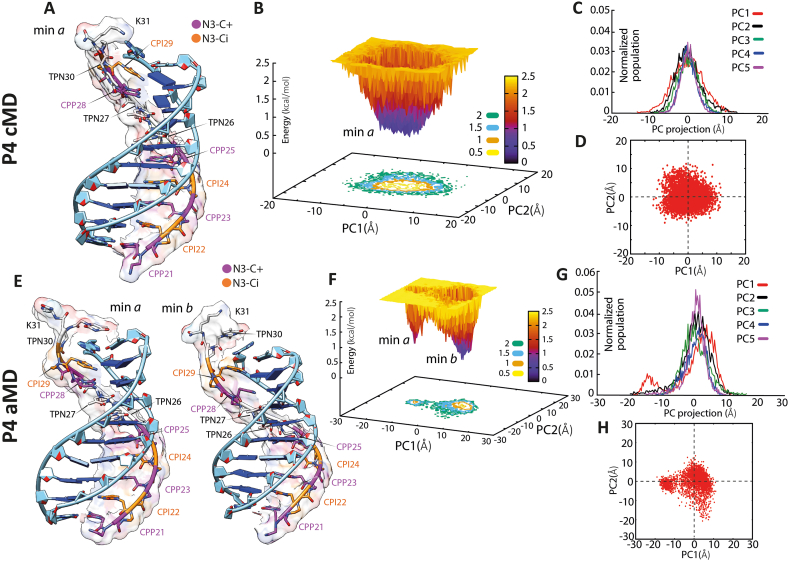
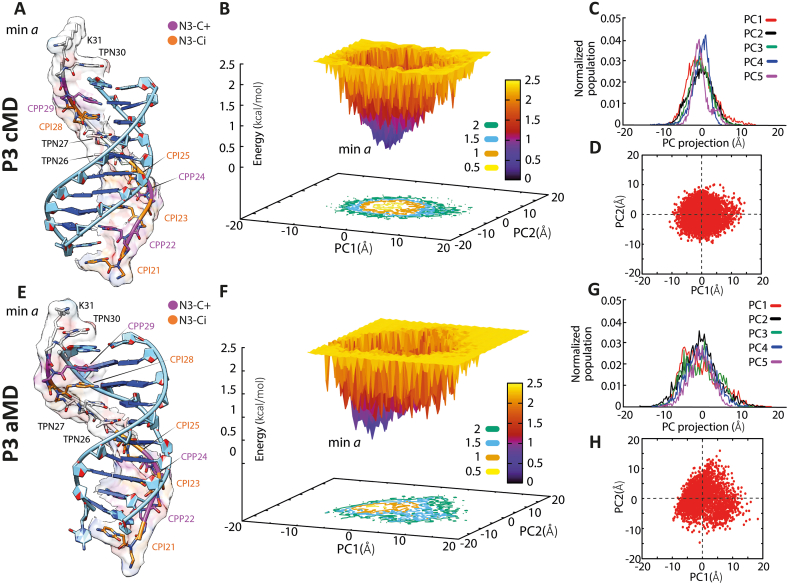
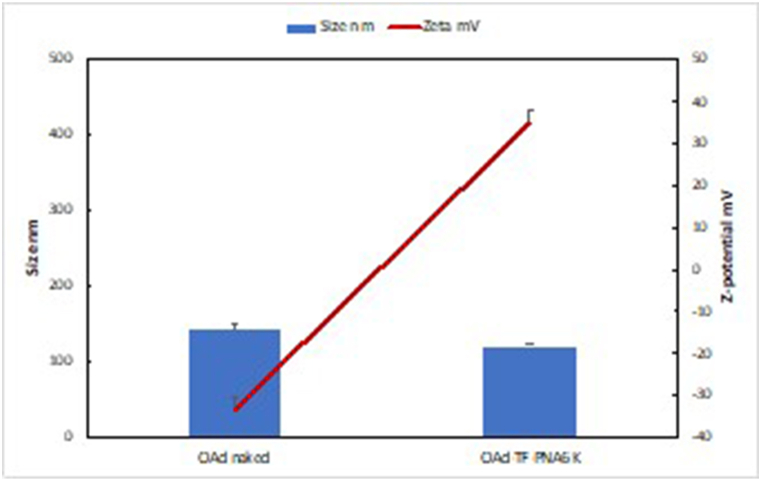
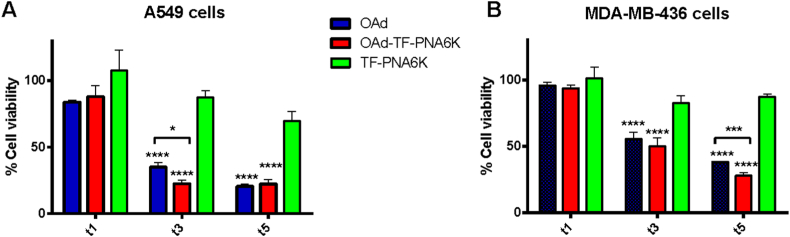
Peptide Nucleic Acids (PNAs) represent a promising tool for gene modulation in anticancer treatment. The uncharged peptidyl backbone and the resistance to chemical and enzymatic degradation make PNAs highly advantageous to form stable hybrid complexes with complementary DNA and RNA strands, providing higher stability than the corresponding natural analogues. Our and other groups' research has successfully shown that tailored PNA sequences can effectively downregulate the expression of human oncogenes using antigene, antisense, or anti-miRNA approaches. Specifically, we identified a seven bases-long PNA sequence, complementary to the longer loop of the main G-quadruplex structure formed by the bcl2midG4 promoter sequence, capable of downregulating the expression of the antiapoptotic Bcl-2 protein and enhancing the anticancer activity of an oncolytic adenovirus. Here, we extended the length of the PNA probe with the aim of including the double-stranded Bcl-2 promoter among the targets of the PNA probe. Our investigation primarily focused on the structural aspects of the resulting DNA2-PNA heterotriplex that were determined by employing conventional and accelerated microsecond-scale molecular dynamics simulations and chemical-physical analysis. Additionally, we conducted preliminary biological experiments using cytotoxicity assays on human A549 and MDA-MB-436 adenocarcinoma cell lines, employing the oncolytic adenovirus delivery strategy.

Keywords: Ad5Delta24 (OAd); Bcl-2 gene modulation; Drug delivery; PNA anti-Bcl-2; PNA gene expression modifiers; PNA-adenoviral vector.


Conflict of interest statement

The authors declare that they have no known competing financial interests or personal relationships that could have appeared to influence the work reported in this paper.

Figures

Fig. 1
Fig. 1
CD spectra of bcl2midG4-ds before (purple line) and after (red line) incubation with 5 equivalents of TF-PNA1K at (A) pH 7.0 or (B) pH 5.0. (C) CD spectra of bcl2midG4-G4 before (purple line) and after (red line) incubation with the same excess of TF-PNA1K at pH 7.0. All samples were dissolved in a 60 mmol/L K+-containing buffer. The CD profiles of the arithmetic sum of DNA + TF-PNA1K and TF-PNA1K alone are reported as green and light blue lines, respectively. All spectra were acquired at 5 °C and normalized at 320 nm. (D) Table with λ values for CD minima and maxima of each sample at pH 7.0 or 5.0. (For interpretation of the references to colour in this figure legend, the reader is referred to the Web version of this article.)
Fig. 2
Fig. 2
CD melting curves of: A) bcl2midG4-ds in potassium buffer at pH 7.0 before (purple line) and after (red line) the addition of TF-PNA1K at the 1:5 DNA/PNA ratio; B) bcl2midG4-ds in potassium buffer at pH 5.0 before (purple line) and after (red line) the addition of TF-PNA1K at the 1:5 DNA/PNA ratio; C) bcl2midG4-G4 in potassium buffer at pH 7.0 before (purple line) and after (red line) the addition of TF-PNA1K at the 1:5 DNA/PNA ratio; D) Calculated T1/2 (°C) of each sample. (For interpretation of the references to colour in this figure legend, the reader is referred to the Web version of this article.)
Fig. 3
Fig. 3
CD profiles recorded in 60 mmol/L potassium buffer for bcl2midG4-ds alone at pH 7.0 (A) and 5.0 (C), bcl2midG4-ds/TF-PNA1K (at a 1:5 equivalents ratio) at pH 7.0 (B) and 5.0 (D), bcl2midG4-G4 alone at pH 7.0 (E), bcl2midG4-G4/TF-PNA1K (at a 1:5 equivalents ratio) at pH 7.0 (F) at 5 °C (green), 50 °C (yellow), and 90 °C (red). Heating: solid line; cooling: dashed line. (For interpretation of the references to colour in this figure legend, the reader is referred to the Web version of this article.)
Fig. 4
Fig. 4
PAGE of bcl2midG4-ds (A, B) and bcl2midG4-G4 (C) alone or incubated with TF-PNA1K in potassium solution at pH 7.0 (A and C) or pH 5.0 (B). Lanes 1A and 1B, bcl2midG4-ds; lanes 2A and 2B, bcl2midG4-ds incubated with TF-PNA1K. Lane 1C, bcl2midG4-G4; lane 2C, bcl2midG4-G4 incubated with TF-PNA1K. Lanes 3A and 3C, DNA duplex ladder (10−100 bp).
Fig. 5
Fig. 5
P4 System. Representative structure of the energetic minima and free energy surface (FES) and principal component (PC) plots of the cMD (A and B–D, respectively) and aMD (E and F–H, respectively) simulations. In B and F, density-coloured landscapes represent the FES distributions: blue areas denote higher density, while yellow ones denote low density. On the right in the upper, the PC projection histograms of cMD (C) and aMD (G) simulations, calculated on the phosphate (P) and nitrogen (N4) atoms of DNA and PNA respectively, excluding C-terminal NH2CO-Lys; bottom: the first two PCs calculated on the aggregate of cMD (D) and aMD (H) trajectories for each system. The heterotriplex structures were extracted by filtering the values of the PCs. DNA and PNA backbones are shown in cartoons, while sugar and bases are represented in sticks and bricks. The carbon atoms of the N3-protonated cytosines (N3–C+) and the N3-imino form (N3-Ci) are highlighted and labelled magenta and orange. (For interpretation of the references to colour in this figure legend, the reader is referred to the Web version of this article.)
Fig. 6
Fig. 6
P3 System. Representative structure of the energetic minima and free energy surface (FES) and principal component (PC) plots of the cMD (A and B–D, respectively) and aMD (E and F–H, respectively) simulations. In B and F, density-coloured landscapes represent the FES distributions: blue areas denote higher density, while yellow ones denote low density. On the right in the upper, the PC projection histograms of cMD (C) and aMD (G) simulations, calculated on the phosphate (P) and nitrogen (N4) atoms of DNA and PNA respectively, excluding C-terminal NH2CO-Lys; bottom: the first 2 PCs calculated on the aggregate of cMD (D) and aMD (H) trajectories for each system. The heterotriplex structures were extracted by filtering the values of the PCs. DNA and PNA backbones are shown in cartoons, while sugar and bases are represented in sticks and bricks. The carbon atoms of the N3-protonated cytosines (N3–C+) and the N3-imino form (N3-Ci) are highlighted and labelled magenta and orange. (For interpretation of the references to colour in this figure legend, the reader is referred to the Web version of this article.)
Fig. 7
Fig. 7
Hydrodynamic diameter (nm) and zeta potential (mV) values of OAd-TF-PNA6K complexes at the 1:100 virus to PNA ratio.
Fig. 8
Fig. 8
Viability of A549 (A) and MDA-MB 436 (B) cells after one, three, and five days (indicated as t1, t3, and t5) of treatment with OAd (100 VP/cell), OAd-TF-PNA6K (100 VP/cell) or TF-PNA6K alone. Cell viability is reported as the percentage of viable cells compared to untreated cells. Significance was assessed using the two-way ANOVA, *p < 0.05, ***p < 0.001, ****p < 0.0005.

Similar articles

References

    1. Uhlmann E., Peyman A., Breipohl G., Will D.W., PNA Synthetic polyamide nucleic acids with unusual binding properties. Angew. Chem. Int. Ed. 1998;37:2796–2823. doi: 10.1002/(SICI)1521-3773(19981102)37:20<2796::AID-ANIE2796>3.0.CO;2-K. - DOI - PubMed
    1. Amato J., Pagano B., Borbone N., Oliviero G., Gabelica V., De Pauw E., D'Errico S., Piccialli V., Varra M., Giancola C., Piccialli G., Mayol L. Targeting G-quadruplex structure in the human c-kit promoter with short PNA sequences. Bioconjugate Chem. 2011;22:654–663. doi: 10.1021/bc100444v. - DOI - PubMed
    1. Hansen M.E., Bentin T., Nielsen P.E. High-affinity triplex targeting of double stranded DNA using chemically modified peptide nucleic acid oligomers. Nucleic Acids Res. 2009;37:4498–4507. doi: 10.1093/nar/gkp437. - DOI - PMC - PubMed
    1. McNeer N.A., Schleifman E.B., Cuthbert A., Brehm M., Jackson A., Cheng C., Anandalingam K., Kumar P., Shultz L.D., Greiner D.L., Mark Saltzman W., Glazer P.M. Systemic delivery of triplex-forming PNA and donor DNA by nanoparticles mediates site-specific genome editing of human hematopoietic cells in vivo. Gene Ther. 2013;20:658–669. doi: 10.1038/gt.2012.82. - DOI - PMC - PubMed
    1. Pooga M., Land T., Bartfai T., Langel Ü. PNA oligomers as tools for specific modulation of gene expression. Biomol. Eng. 2001;17:183–192. doi: 10.1016/S1389-0344(01)00075-2. - DOI - PubMed

LinkOut - more resources