

Integration of bulk RNA sequencing to reveal protein arginine methylation regulators have a good prognostic value in immunotherapy to treat lung adenocarcinoma
- PMID: 38317982
- PMCID: PMC10838759
- DOI: 10.1016/j.heliyon.2024.e24816
Integration of bulk RNA sequencing to reveal protein arginine methylation regulators have a good prognostic value in immunotherapy to treat lung adenocarcinoma
Abstract
Background: Given the differential expression and biological functions of protein arginine methylation (PAM) regulators in lung adenocarcinoma (LUAD), it may be of great value in the diagnosis, prognosis, and treatment of LUAD. However, the expression and function of PAM regulators in LUAD and its relationship with prognosis are unclear.
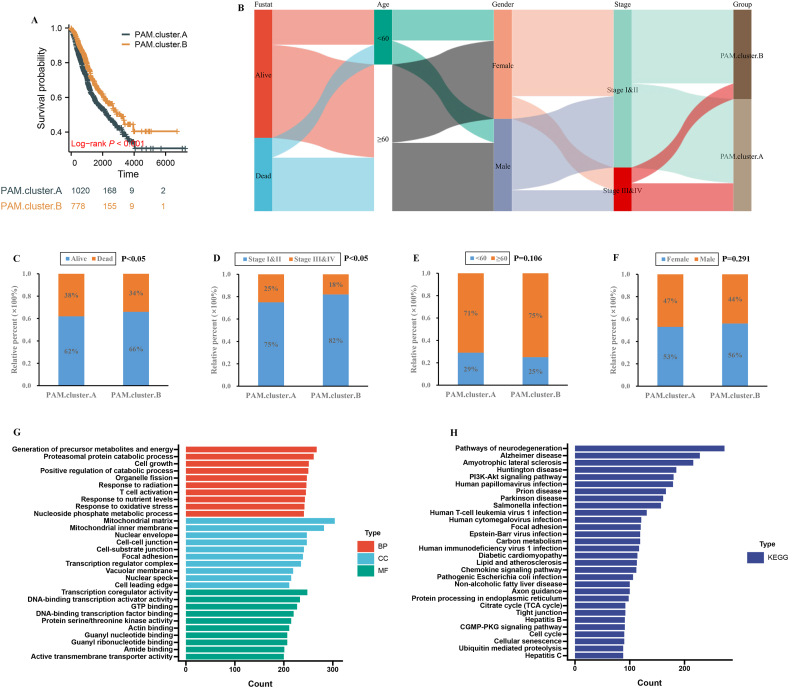
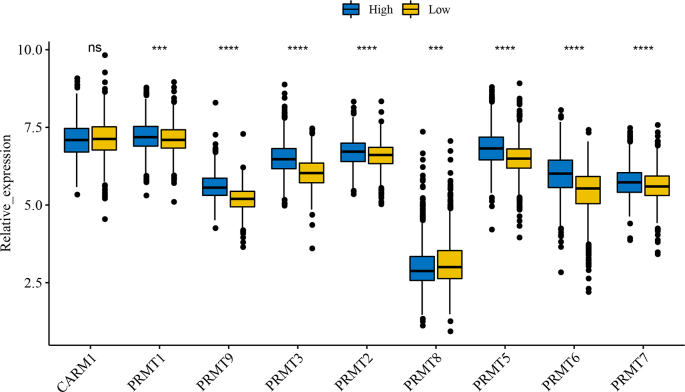
Methods: 8 datasets including 1798 LUAD patients were selected. During the bioinformatic study in LUAD, we performed (i) consensus clustering to identify clusters based on 9 PAM regulators related expression profile data, (ii) to identify hub genes between the 2 clusters, (iii) principal component analysis to construct a PAM.score based on above genes, and (iv) evaluation of the effect of PAM.score on the deconstruction of tumor microenvironment and guidance of immunotherapy.
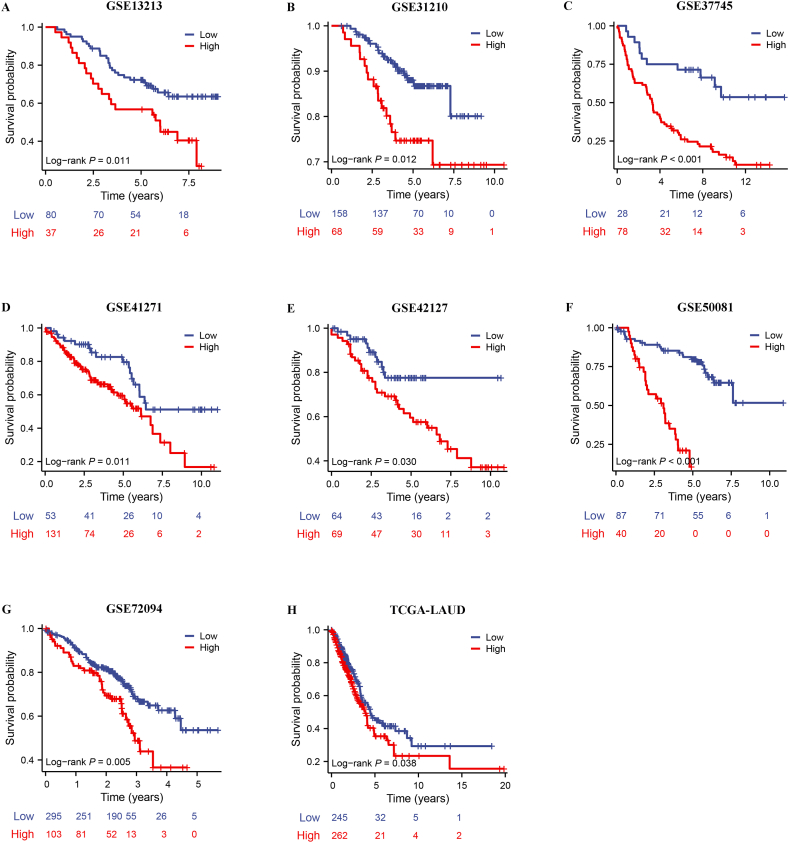
Results: We identified two different clusters and a robust and clinically practicable prognostic scoring system. Meanwhile, a higher PAM.score subgroup showed poorer prognosis, and was validated by multiple cohorts. Its prognostic effect was validated by ROC (Receiver operating characteristic curve) curve and found to have a relatively good prediction efficacy. High PAM.score group exhibited lower immune score, which associated with an immunosuppressive microenvironment in LUAD. Finally, patients exhibiting a lower PAM.score presented noteworthy therapeutic benefits and clinical advantages.
Conclusion: Our PAM.score model can help clinicians to select personalized therapy for LUAD patients, and PAM.score may act a part in the development of LUAD.
Keywords: Arginine methylation; Immunotherapy; Lung adenocarcinoma; Tumor microenvironment.
© 2024 The Authors. Published by Elsevier Ltd.
Conflict of interest statement
The authors declare that they have no known competing financial interests or personal relationships that could have appeared to influence the work reported in this paper.
Figures


Similar articles
-
Characteristic of molecular subtypes in lung adenocarcinoma based on m6A RNA methylation modification and immune microenvironment.BMC Cancer. 2021 Aug 20;21(1):938. doi: 10.1186/s12885-021-08655-1. BMC Cancer. 2021. PMID: 34416861 Free PMC article.
-
Pan-cancer analysis identifies proteasome 26S subunit, ATPase (PSMC) family genes, and related signatures associated with prognosis, immune profile, and therapeutic response in lung adenocarcinoma.Front Genet. 2023 Jan 9;13:1017866. doi: 10.3389/fgene.2022.1017866. eCollection 2022. Front Genet. 2023. PMID: 36699466 Free PMC article.
-
High Expression of DLGAP5 Indicates Poor Prognosis and Immunotherapy in Lung Adenocarcinoma and Promotes Proliferation through Regulation of the Cell Cycle.Dis Markers. 2023 Jan 19;2023:9292536. doi: 10.1155/2023/9292536. eCollection 2023. Dis Markers. 2023. PMID: 36712920 Free PMC article.
-
Identification of immune activation-related gene signature for predicting prognosis and immunotherapy efficacy in lung adenocarcinoma.Front Immunol. 2023 Jul 7;14:1217590. doi: 10.3389/fimmu.2023.1217590. eCollection 2023. Front Immunol. 2023. PMID: 37492563 Free PMC article.
-
Comprehensive analysis of the immunogenic cell death-related signature for predicting prognosis and immunotherapy efficiency in patients with lung adenocarcinoma.BMC Med Genomics. 2023 Aug 8;16(1):184. doi: 10.1186/s12920-023-01604-w. BMC Med Genomics. 2023. PMID: 37553698 Free PMC article.
References
-
- Siegel R.L., Miller K.D., Wagle N.S., Jemal A. Cancer statistics, 2023. CA A Cancer J. Clin. 2023;73:17–48. - PubMed
-
- Miller K.D., Nogueira L., Devasia T., Mariotto A.B., Yabroff K.R., Jemal A., Kramer J., Siegel R.L. Cancer treatment and survivorship statistics, 2022. CA A Cancer J. Clin. 2022;72:409–436. - PubMed
-
- Hirsch F.R., Scagliotti G.V., Mulshine J.L., Kwon R., Curran W.J., Jr., Wu Y.L., Paz-Ares L. Lung cancer: current therapies and new targeted treatments. Lancet (London, England) 2017;389:299–311. - PubMed
LinkOut - more resources
Full Text Sources
Miscellaneous
