. 2024 Jan 25:68:102434.
doi: 10.1016/j.eclinm.2024.102434. eCollection 2024 Feb.

Long COVID is associated with severe cognitive slowing: a multicentre cross-sectional study

Affiliations

Long COVID is associated with severe cognitive slowing: a multicentre cross-sectional study

Sijia Zhao et al. EClinicalMedicine. .

Abstract

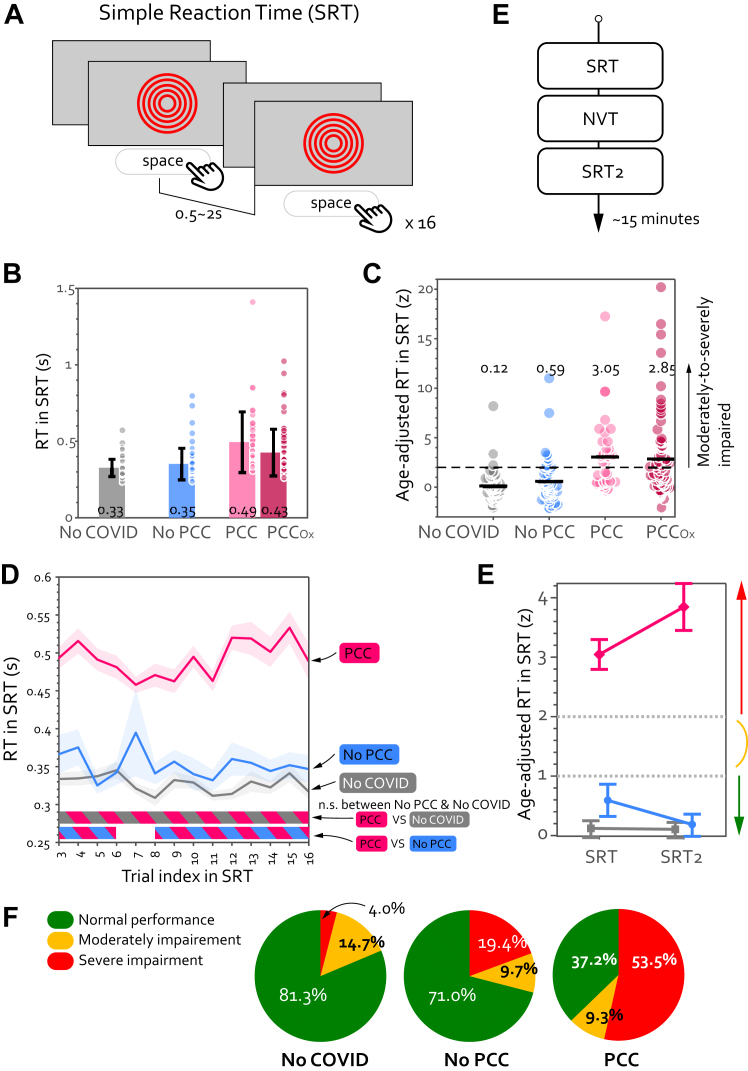
Background: COVID-19 survivors may experience a wide range of chronic cognitive symptoms for months or years as part of post-COVID-19 conditions (PCC). To date, there is no definitive objective cognitive marker for PCC. We hypothesised that a key common deficit in people with PCC might be generalised cognitive slowing.

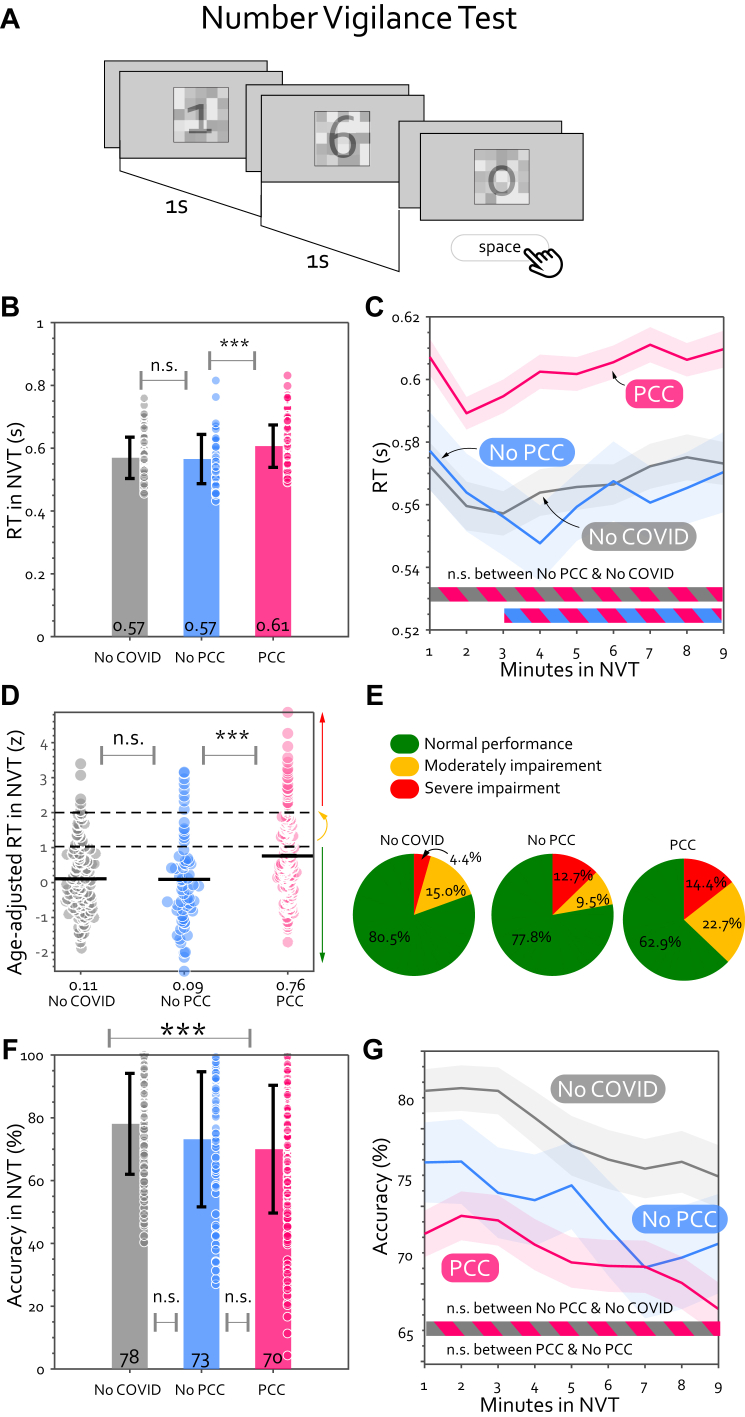
Methods: To examine cognitive slowing, patients with PCC completed two short web-based cognitive tasks, Simple Reaction Time (SRT) and Number Vigilance Test (NVT). 270 patients diagnosed with PCC at two different clinics in UK and Germany were compared to two control groups: individuals who contracted COVID-19 before but did not experience PCC after recovery (No-PCC group) and uninfected individuals (No-COVID group). All patients with PCC completed the study between May 18, 2021 and July 4, 2023 in Jena University Hospital, Jena, Germany and Long COVID clinic, Oxford, UK.

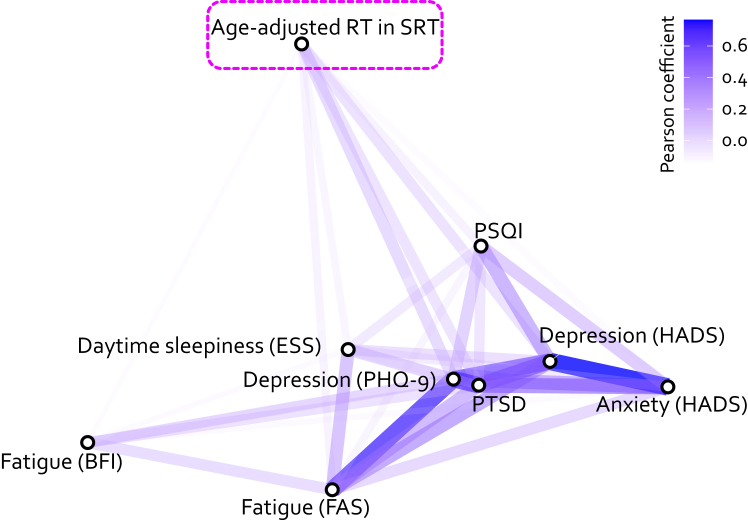
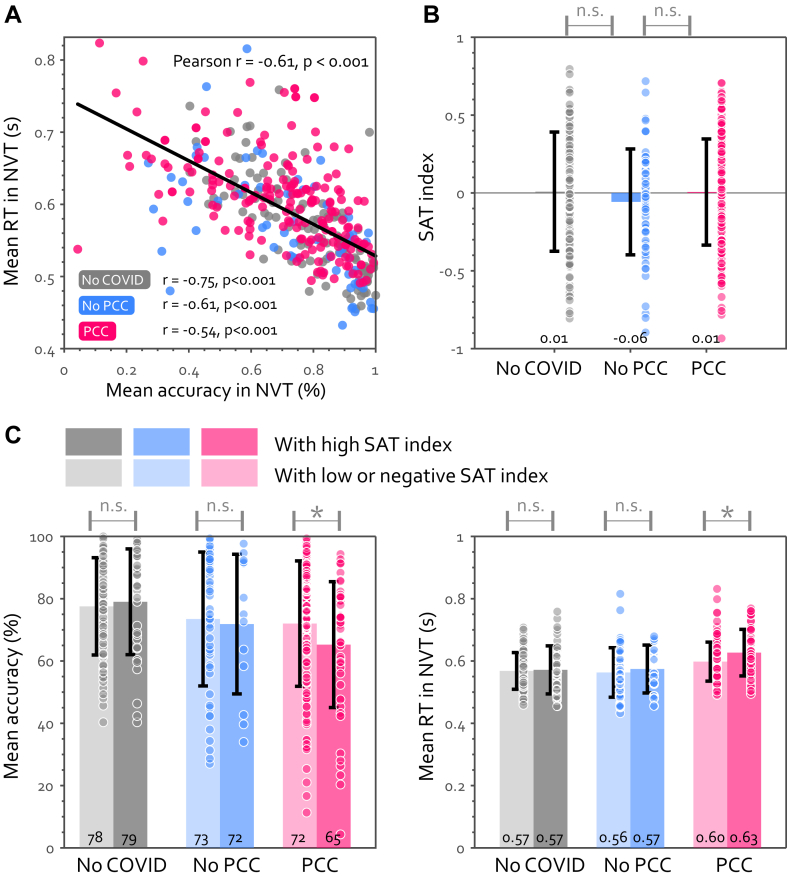
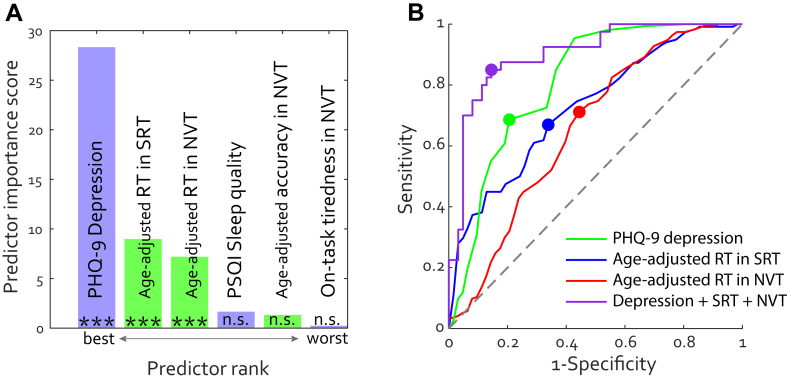
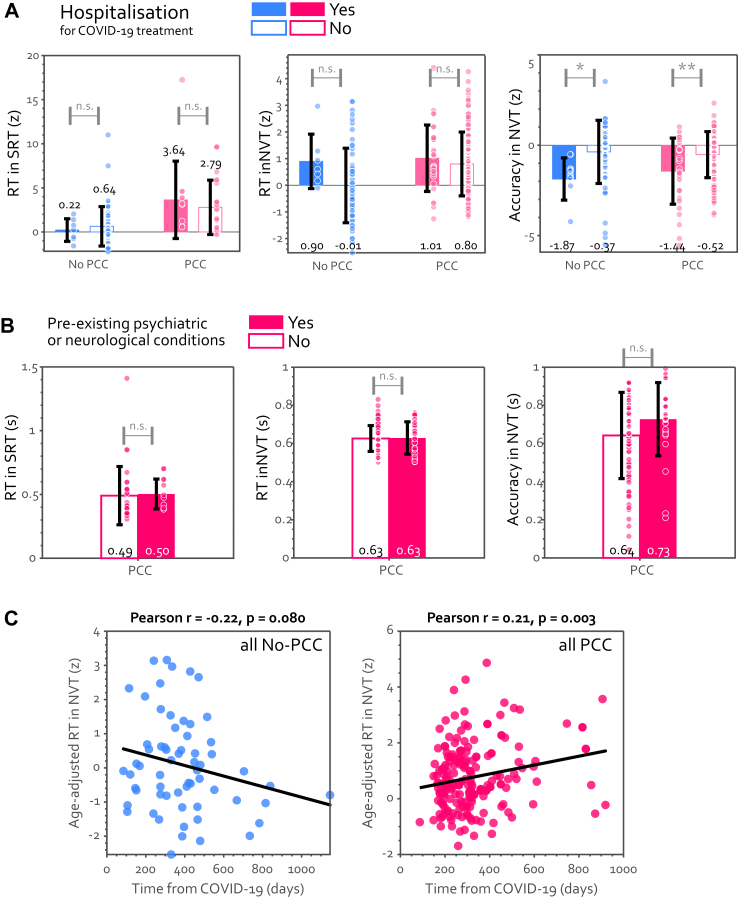
Findings: We identified pronounced cognitive slowing in patients with PCC, which distinguished them from age-matched healthy individuals who previously had symptomatic COVID-19 but did not manifest PCC. Cognitive slowing was evident even on a 30-s task measuring simple reaction time (SRT), with patients with PCC responding to stimuli ∼3 standard deviations slower than healthy controls. 53.5% of patients with PCC's response speed was slower than 2 standard deviations from the control mean, indicating a high prevalence of cognitive slowing in PCC. This finding was replicated across two clinic samples in Germany and the UK. Comorbidities such as fatigue, depression, anxiety, sleep disturbance, and post-traumatic stress disorder did not account for the extent of cognitive slowing in patients with PCC. Furthermore, cognitive slowing on the SRT was highly correlated with the poor performance of patients with PCC on the NVT measure of sustained attention.

Interpretation: Together, these results robustly demonstrate pronounced cognitive slowing in people with PCC, which distinguishes them from age-matched healthy individuals who previously had symptomatic COVID-19 but did not manifest PCC. This might be an important factor contributing to some of the cognitive impairments reported in patients with PCC.

Funding: Wellcome Trust (206330/Z/17/Z), NIHR Oxford Health Biomedical Research Centre, the Thüringer Aufbaubank (2021 FGI 0060), German Forschungsgemeinschaft (DFG, FI 1424/2-1) and the Horizon 2020 Framework Programme of the European Union (ITN SmartAge, H2020-MSCA-ITN-2019-859890).

Keywords: COVID-19; Cognition; Post-COVID conditions; Post-acute COVID syndrome; Processing speed; Response time.


Conflict of interest statement

All authors declare no financial or non-financial competing interests.

Figures

Fig. 1
Fig. 1
Patients with PCC were slower than people without PCC, including those who had previously contracted COVID-19. (A) Simple Reaction Time (SRT) task contained a total of 16 trials. The mean RT for each group is shown in (B) with each dot representing individual data and the error bar showing ± 1 SD. Except for the first two trials, which were exceptionally noisy and sluggish, the mean RT was calculated from all trials for each participant. PCC Ox indicates the PCC Oxford group. The value at the bottom of each bar indicates the mean of that group. (C) To account for the effect of age on response speed, all participants' speed were adjusted based on the No-COVID controls in the same age. Z-score indicates the number of standard deviations from the age-matched normative population. The coloured circles indicate individual results and the black solid line marks the group mean. The horizontal dash black line indicates the threshold for severe impairment (2 SD). (D) Throughout the SRT, PCC participants (pink curve) reacted significantly slower than the other two groups. RT was computed for every trial in SRT across participants and plotted against the trial index. The shaded area shows ±1 SEM and the horizontal lines at the bottom indicate time intervals where bootstrap statistics confirmed significant differences between two groups (P < 0.05). While there was no difference between No-COVID (grey) and No-PCC (blue), PCC (pink) was significantly slower than No-COVID throughout the SRT task (pink-grey stripy horizontal line at bottom) as well as No-PCC (pink-blue stripy horizontal line). (E) To replicate the result seen in SRT, all participants completed the same task again after the second task. (E) The group mean for both sessions of SRT is plotted with group as separate lines. No-COVID (grey line) and No-PCC (blue line) showed a normal performance in both sessions (below the threshold for moderate impairment (>1 SD). In contrast, PCC (pink line) showed severe impairment (>2 SD) in both sessions. The error bar indicates 1 standard error of mean. (F) On the individual level, most of No-COVID and No-PCC controls had a normal speed (<1 SD) while most of patients with PCC showed significant impairment.
Fig. 2
Fig. 2
Network plot of relationships between the cognitive slowing (age-adjusted RT in SRT, highlighted with pink dashed rectangle) and all self-reported metrics (bottom cluster) amongst the patients with PCC. All depicted relationships are associated with a positive correlation and are rendered in blue. The shorter the distance between two metrics, the stronger their relationship (the higher the correlation coefficient). PHQ-9: Patient Health Questionnaire-9. HADS: Hospital Anxiety and Depression Scale. FAS: Fatigue Assessment Scale. BFI: Brief Fatigue Inventory. PSQI: Pittsburgh Sleep Quality Index. ESS: Epworth Sleepiness Scale Sleep Test Questionnaire. PTSD: Post-Traumatic Stress Disorder Test. Although depression did not predict the cognitive slowing, the combination of depression level and age-adjusted speed in SRT and number vigilance test (NVT) predicts PCC accurately.
Fig. 3
Fig. 3
Patients with PCC responded slower and worse at detecting targets in the Number Vigilance Test (NVT). (A) Following the SRT, all participants completed the NVT, in which a number between 0 and 9 was displayed at 1 Hz and it was displayed for 0.1 s while being masked by a transparent checkerboard. Participants were instructed not to press anything if the number was between 1 and 9 and press spacebar as soon as possible when seeing the target number 0. The frequency of the target “0” was low (25%) and would not happen consecutively. The mean RT over 9 min for each group is shown in (B), and the mean RT for every minute of this test was plotted against the time (C). n.s. means no significant difference. ∗ means P < 0.05, ∗∗∗ means P < 0.001 and passes multiple comparison corrections. The shaded area shows ±1 SEM and the horizontal lines at the bottom indicate time intervals where bootstrap statistics confirmed significant differences between two groups (P < 0.05). (D) To account for the effect of age on RT in the NVT, all participants' speed were age-adjusted based on the No-COVID controls in the same age. Z-score indicates the number of standard deviations from the age-matched normative population. The coloured circles indicate individual results and the black solid line marks the group mean. The two horizontal dash black lines indicate the thresholds for moderate (>1 SD) and severe impairments (>2 SD). (E) The pie charts show the proportion of individuals who had a normal speed (<1 SD, green area), moderate impairment (>1 SD, yellow area) and severe impairment (>2 SD, red area) in this test. The mean accuracy during this task is plotted in (F) and against time in (G). PCC (pink) was significantly less vigilant than No-COVID throughout the SRT task (pink-grey stripy horizontal line at bottom).
Fig. 4
Fig. 4
The slowness in PCC cannot be explained by speed-accuracy trade-off (SAT). (A) RT is negatively correlated with accuracy in the NVT across participants in every group. Pearson's r and P values for all participants are shown at the top right and those for each group are shown at the bottom left of the graph. The SAT index for each group is shown in (B) with each dot representing individual data and the error bar showing ± 1 SD. SAT index for every participant is computed as the correlation coefficient of RT and accuracy for every minute. On the group level, PCC didn't show any difference in the tendency to employ SAT in this test, as the SAT index is not significant above zero. (C) Comparing the objective performance within each group, between participants with high SAT index (i.e., median split of SAT index, shown in the right-hand side dark colour bars) and the rest. n.s. means no significant difference. ∗ means P < 0.05.
Fig. 5
Fig. 5
(A) Ranked measures in predicting group PCC or No-PCC. Cognitive measures are marked in lime, and self-reported measures (depression, sleep quality and on-task tiredness). ∗∗∗ indicates P values below 0.001. n.s. means not significant. (B) Receiver Operating Characteristics (ROC) curves for group classification. The filled dots indicate the optimal operating points for each model. The purple curve represents the performance of a multiple logistic regression model with all three predictors, PHQ-9 derived depression level, age-adjusted RTs in SRT and NVT.
Fig. 6
Fig. 6
How did the acute COVID-19 infection affect objective performance? (A) Although hospitalised individuals, regardless of PCC status, demonstrated no difference in RT in SRT (left) or NVT (middle), they were significantly less accurate (right). N (No PCC inpatients) = 7, N (No PCC outpatients) = 56, N (PCC inpatients) = 32, N (PCC outpatients) = 125. (B) No difference was found between patients with PCC with and without pre-existing psychiatric conditions prior to COVID-19. N (PCC with pre-existing conditions) = 31, N (PCC without pre-existing conditions) = 80. (C) In NVT, age-adjusted RT was marginally negatively correlated with time from infection in No-PCC participants, implying a gradual recovery (left). Cognitive slowing, however, was strongly positively correlated with time from infection in PCC group. n.s. means no significant difference. ∗ means P < 0.05, and ∗∗ means P < 0.01.

References

    1. World Health Organization . World Health Organization; 2021. A clinical case definition of post COVID-19 condition by a Delphi consensus, 6 October 2021.https://apps.who.int/iris/handle/10665/345824 Accessed May 12, 2023.
    1. Ballouz T., Menges D., Anagnostopoulos A., et al. Recovery and symptom trajectories up to two years after SARS-CoV-2 infection: population based, longitudinal cohort study. BMJ. 2023;381 - PMC - PubMed
    1. Thaweethai T., Jolley S.E., Karlson E.W., et al. Development of a definition of postacute sequelae of SARS-CoV-2 infection. JAMA. 2023;329:1934–1946. - PMC - PubMed
    1. Zhao S., Toniolo S., Hampshire A., Husain M. Effects of COVID-19 on cognition and brain health. Trends Cogn Sci. 2023;27(11):1053–1067. doi: 10.1016/j.tics.2023.08.008. - DOI - PMC - PubMed
    1. Díez-Cirarda M., Yus M., Gómez-Ruiz N., et al. Multimodal neuroimaging in post-COVID syndrome and correlation with cognition. Brain. 2023;146:2142–2152. - PMC - PubMed

LinkOut - more resources