. 2024 Jan 11;27(2):108866.
doi: 10.1016/j.isci.2024.108866. eCollection 2024 Feb 16.

Magnitude shifts spatial attention from left to right in rhesus monkeys as in the human mental number line

Affiliations

Magnitude shifts spatial attention from left to right in rhesus monkeys as in the human mental number line

Rosa Rugani et al. iScience. .

Abstract

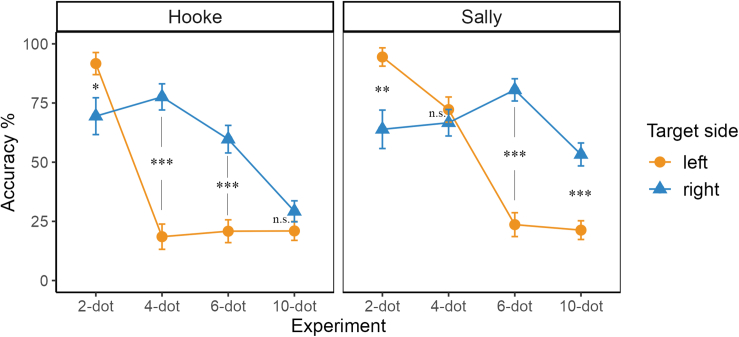
Humans typically represent numbers and quantities along a left-to-right continuum. Early perspectives attributed number-space association to culture; however, recent evidence in newborns and animals challenges this hypothesis. We investigate whether the length of an array of dots influences spatial bias in rhesus macaques. We designed a touch-screen task that required monkeys to remember the location of a target. At test, monkeys maintained high performance with arrays of 2, 4, 6, or 10 dots, regardless of changes in the array's location, spacing, and length. Monkeys remembered better left targets with 2-dot arrays and right targets with 6- or 10-dot arrays. Replacing the 10-dot array with a long bar, yielded more accurate performance with rightward locations, consistent with an underlying left-to-right oriented magnitude code. Our study supports the hypothesis of a spatially oriented mental magnitude line common to humans and animals, countering the idea that this code arises from uniquely human cultural learning.

Keywords: Behavioral neuroscience; Evolutionary biology; Zoology.


Conflict of interest statement

The authors declare no competing interests.

Figures

None
Graphical abstract
Figure 1
Figure 1
Schematic illustration of the screen succession in the training procedure as in Training 3 A training trial started with the presentation of a blue response square; once selected, two dark gray dots appeared. The target stimulus, a green dinosaur, appeared on either dot. When the target was selected, the two dots turned orange for 3 s before disappearing. A horizontally centered orange response square appeared in the bottom area of the monitor. This always appeared in the same position to direct monkey attention to the same part of the monitor. Once the orange response square was selected, two orange dots appeared and the target stimulus could be visible, depending on training phase, on the same dot in which it appeared in the previous screens (in this illustration the target was faded as in some trials of the second phase of Training 3). The selection of the dot on which the target was presented elicited a positive reward.
Figure 2
Figure 2
Percentage of choosing each position as a function of target position and subject in number transfer tests: 2-, 4-, 6-, 10-dot array Error bars indicate standard errors. Gray lines = chance. (A) Two-dot experiment. Target located in 1L or 1R. Chance = 50%. (B) Four-dot experiment. Target located at 1L, 2L, 2R, or 1R. Chance = 25%. (C) Six-dot experiment. Target located at 2L, 3L, 3R, or 2R. Chance = 16.667%. (D) Ten-dot experiment. Target located in 2L, 3L, 4L, 4R, 3R, or 2R. Chance = 10%. ∗p < 0.05, ∗∗p < 0.01, ∗∗∗p < 0.001, n.s. not significant.
Figure 3
Figure 3
Monkeys’ accuracy in number transfer tests on each side Asterisks indicate significant difference between left versus right targets. Error bars = SEMs. ∗p < 0.05, ∗∗p < 0.01, ∗∗∗p < 0.001.
Figure 4
Figure 4
Percentage of first choices on each position in conflict tests When the target was presented on the third left dot (3L), in the Recall phase, the ordinal-correct position was 3L while the spatial-correct position was 2L. When the target was presented on the third right dot (3R), in the Recall phase, the ordinal-correct position was 3R while the spatial-correct position was 2R. Error bars = SEMs. Gray lines = chance (y = 16.667). ∗p < 0.05, ∗∗p < 0.01, ∗∗∗p < 0.001.
Figure 5
Figure 5
Mean accuracy in choosing each target position in the 10-dot number transfer test and the continuous transfer test Error bars = SEMs. Gray lines = chance (y = 10). ∗p < 0.05, ∗∗p < 0.01, ∗∗∗p < 0.001.

References

    1. Gallistel C.R. 1st ed. MIT Press; 1993. The Organization of Learning.
    1. Gevers W., Reynvoet B., Fias W. The mental representation of ordinal sequences is spatially organized. Cognition. 2003;87:B87–B95. - PubMed
    1. Butterworth B. First US edition. Basic Books; 2022. Can Fish Count? what Animals Reveal about Our Uniquely Mathematical Minds.
    1. Moyer R.S., Landauer T.K. Time required for Judgements of Numerical Inequality. Nature. 1967;215:1519–1520. - PubMed
    1. Dehaene S. updated ed. Oxford University Press; 2011. The Number Sense: How the Mind Creates Mathematics Rev.

LinkOut - more resources