. 2024 Jan 22:14:1265469.
doi: 10.3389/fimmu.2023.1265469. eCollection 2023.

Divergent HLA variations and heterogeneous expression but recurrent HLA loss-of- heterozygosity and common HLA-B and TAP transcriptional silencing across advanced pediatric solid cancers

Affiliations

Divergent HLA variations and heterogeneous expression but recurrent HLA loss-of- heterozygosity and common HLA-B and TAP transcriptional silencing across advanced pediatric solid cancers

Wan Ching Lim et al. Front Immunol. .

Abstract

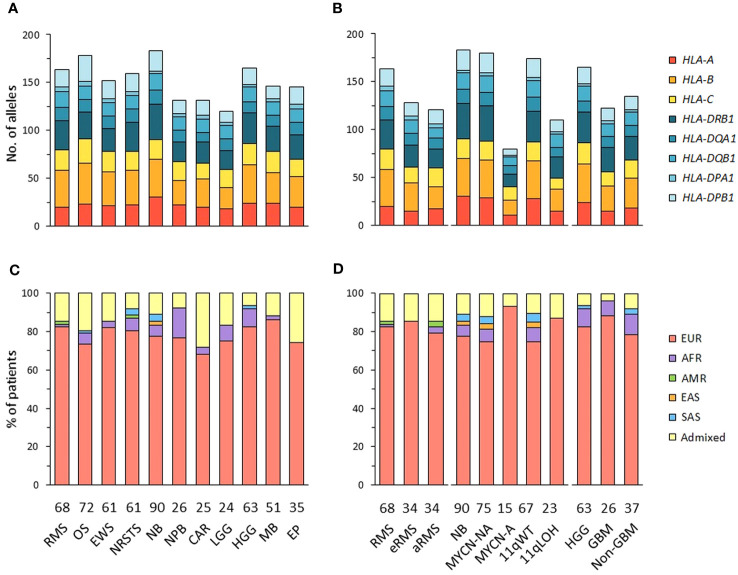
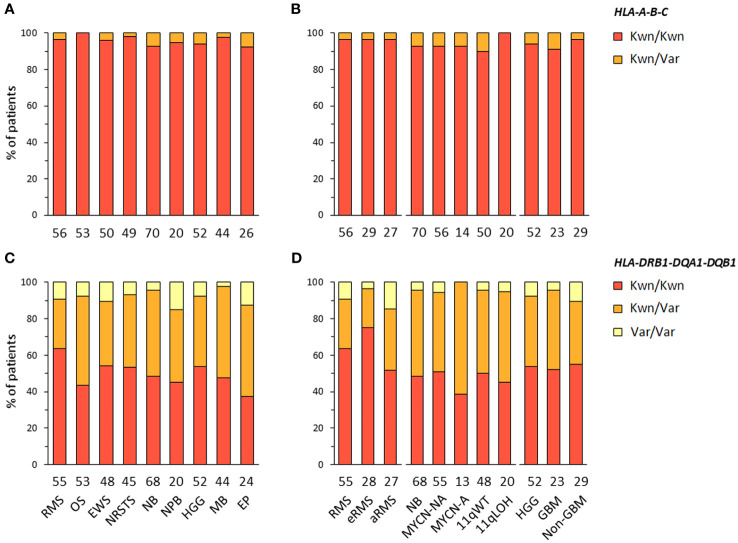
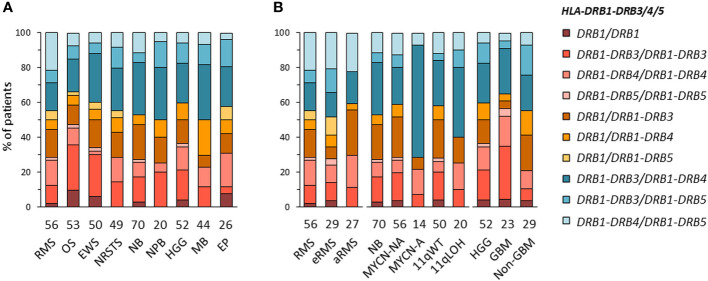
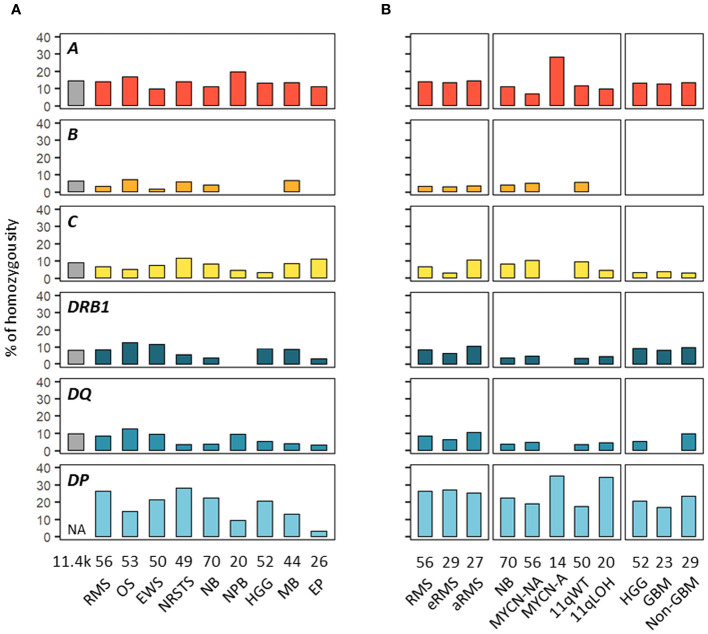
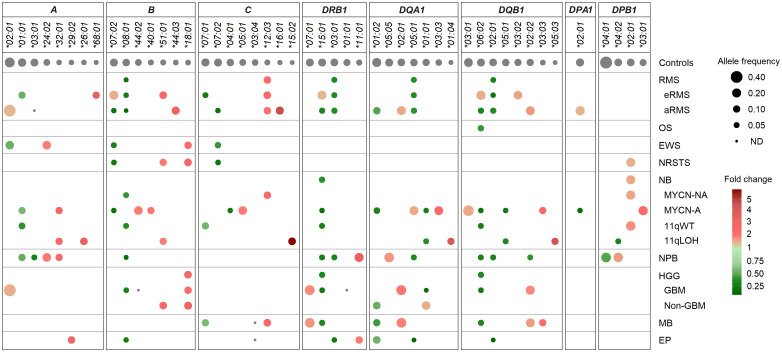
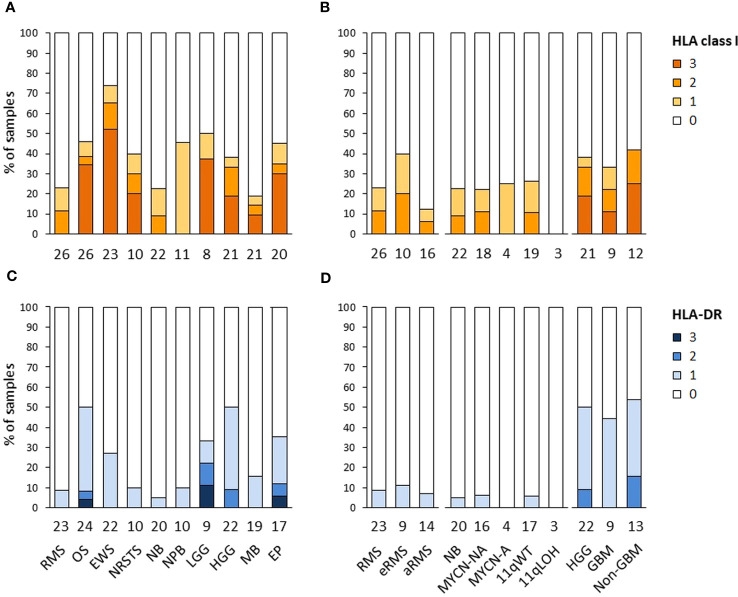
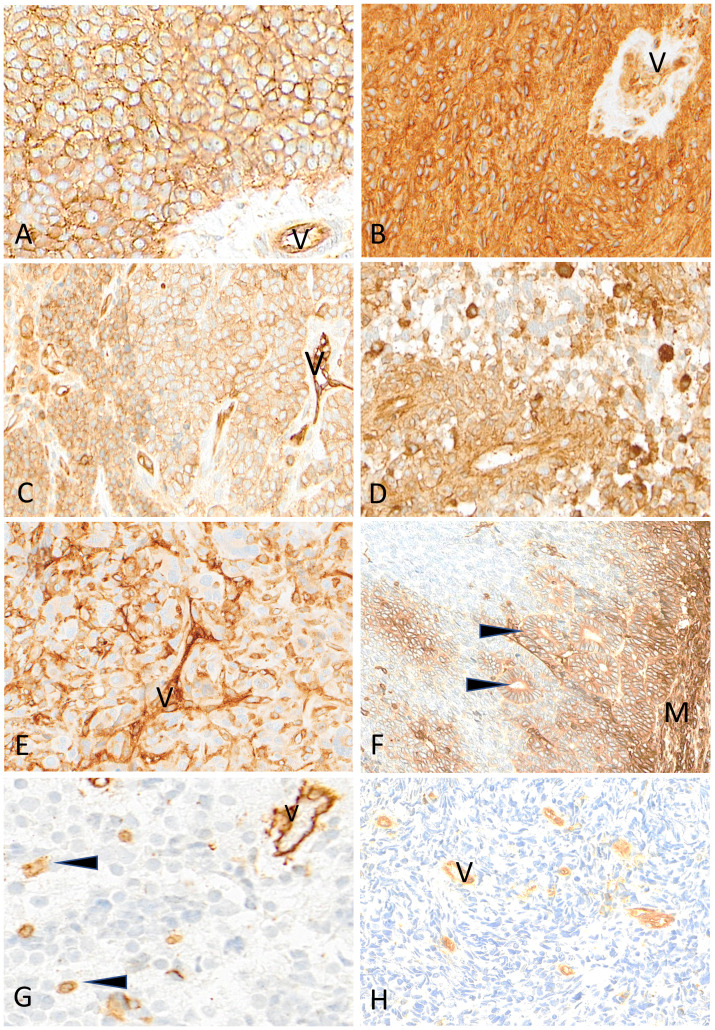
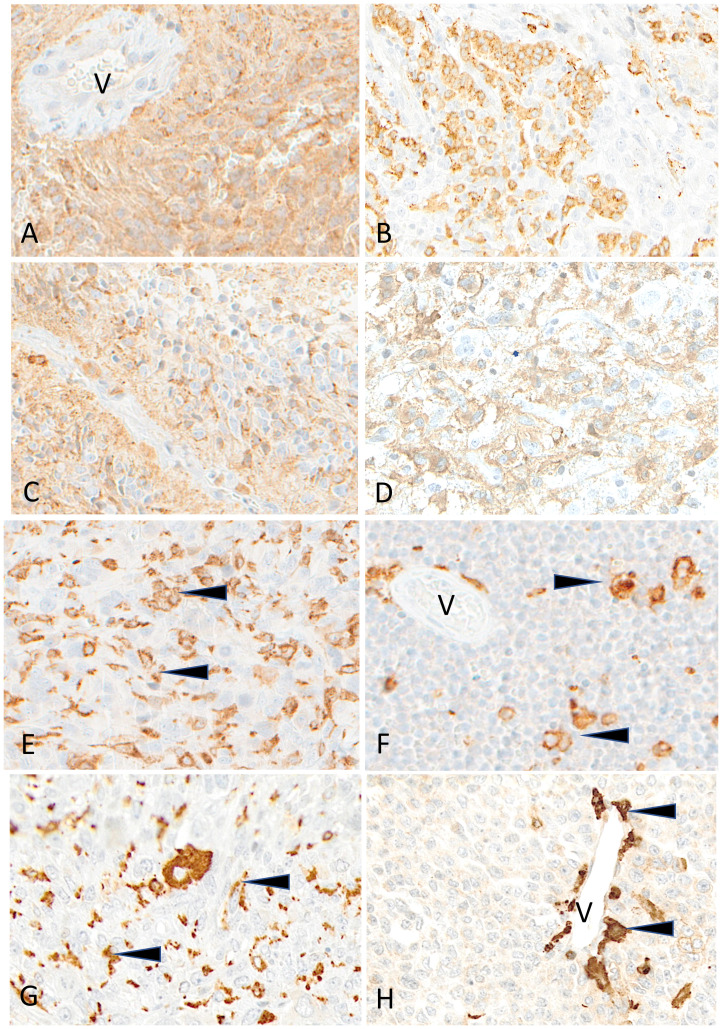
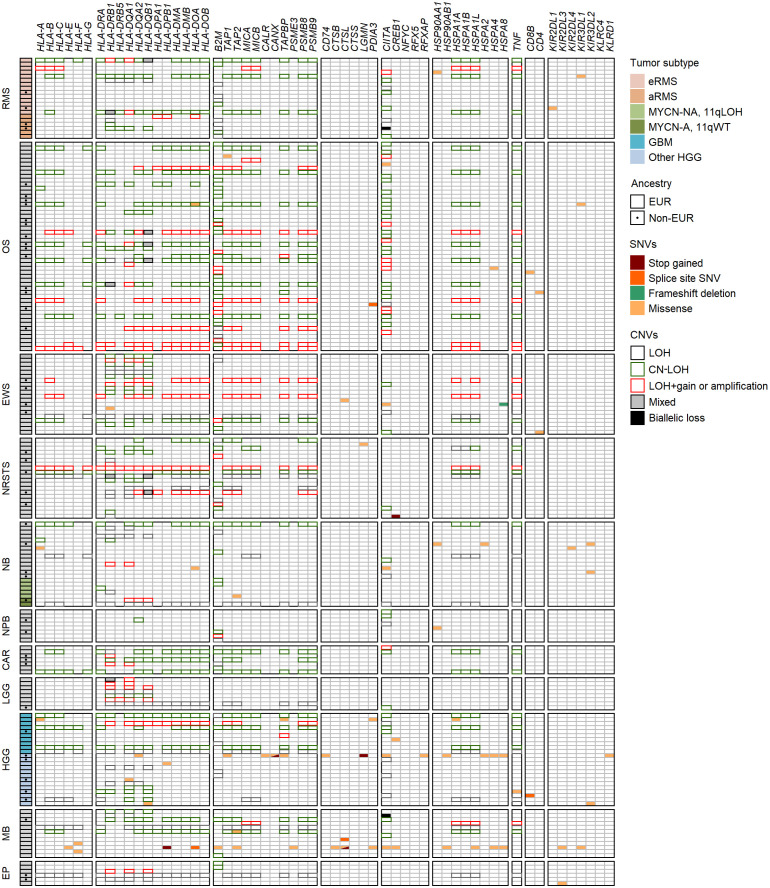
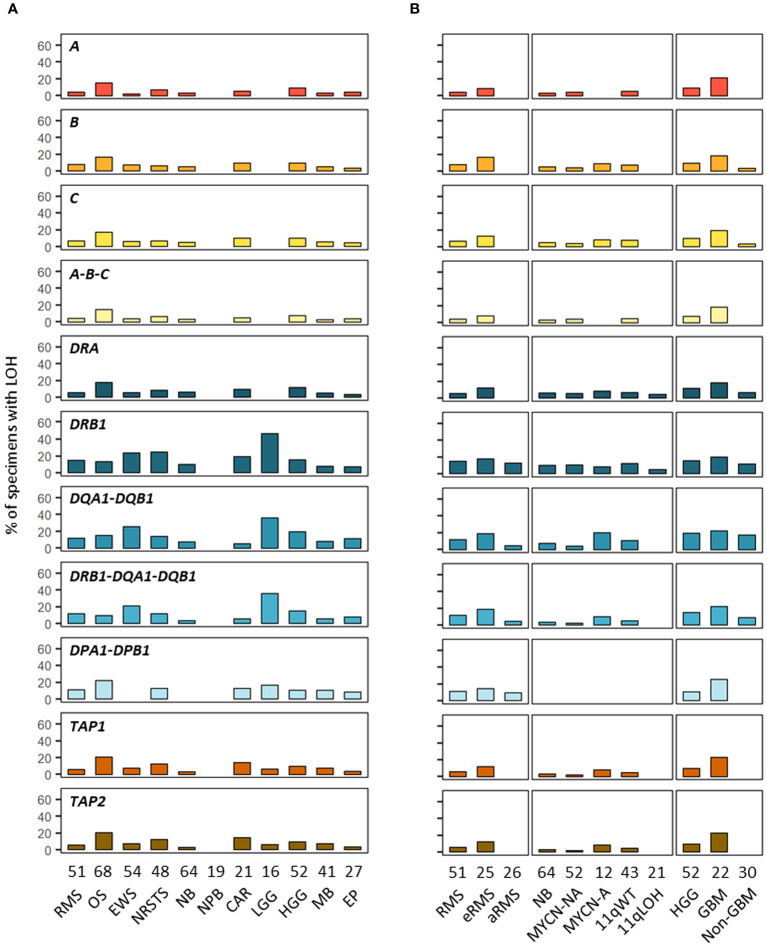
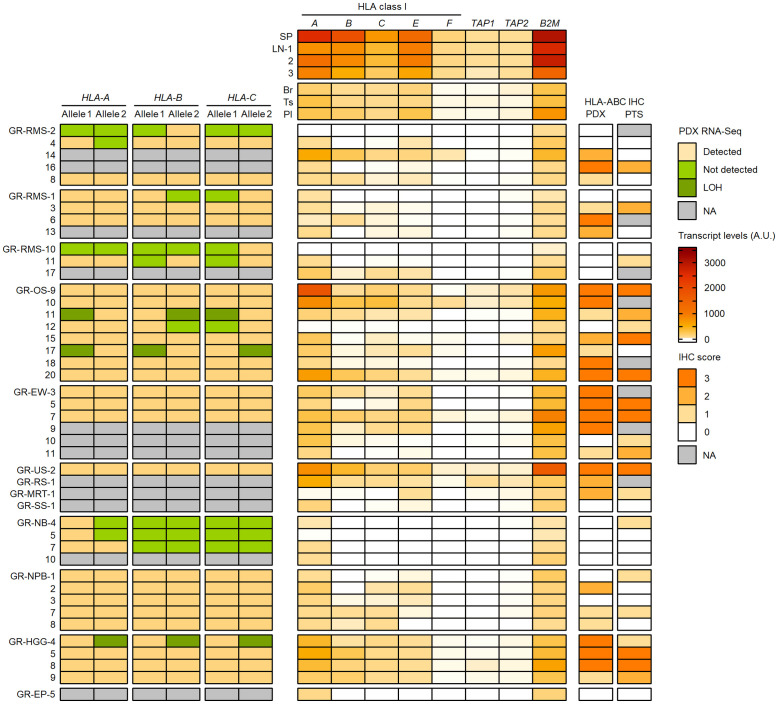
The human leukocyte antigen (HLA) system is a major factor controlling cancer immunosurveillance and response to immunotherapy, yet its status in pediatric cancers remains fragmentary. We determined high-confidence HLA genotypes in 576 children, adolescents and young adults with recurrent/refractory solid tumors from the MOSCATO-01 and MAPPYACTS trials, using normal and tumor whole exome and RNA sequencing data and benchmarked algorithms. There was no evidence for narrowed HLA allelic diversity but discordant homozygosity and allele frequencies across tumor types and subtypes, such as in embryonal and alveolar rhabdomyosarcoma, neuroblastoma MYCN and 11q subtypes, and high-grade glioma, and several alleles may represent protective or susceptibility factors to specific pediatric solid cancers. There was a paucity of somatic mutations in HLA and antigen processing and presentation (APP) genes in most tumors, except in cases with mismatch repair deficiency or genetic instability. The prevalence of loss-of-heterozygosity (LOH) ranged from 5.9 to 7.7% in HLA class I and 8.0 to 16.7% in HLA class II genes, but was widely increased in osteosarcoma and glioblastoma (~15-25%), and for DRB1-DQA1-DQB1 in Ewing sarcoma (~23-28%) and low-grade glioma (~33-50%). HLA class I and HLA-DR antigen expression was assessed in 194 tumors and 44 patient-derived xenografts (PDXs) by immunochemistry, and class I and APP transcript levels quantified in PDXs by RT-qPCR. We confirmed that HLA class I antigen expression is heterogeneous in advanced pediatric solid tumors, with class I loss commonly associated with the transcriptional downregulation of HLA-B and transporter associated with antigen processing (TAP) genes, whereas class II antigen expression is scarce on tumor cells and occurs on immune infiltrating cells. Patients with tumors expressing sufficient HLA class I and TAP levels such as some glioma, osteosarcoma, Ewing sarcoma and non-rhabdomyosarcoma soft-tissue sarcoma cases may more likely benefit from T cell-based approaches, whereas strategies to upregulate HLA expression, to expand the immunopeptidome, and to target TAP-independent epitopes or possibly LOH might provide novel therapeutic opportunities in others. The consequences of HLA class II expression by immune cells remain to be established. Immunogenetic profiling should be implemented in routine to inform immunotherapy trials for precision medicine of pediatric cancers.

Keywords: HLA; immunogenetics; immunotherapy; pediatric cancers; refractory and recurrent solid tumors; tumor immunity.


Conflict of interest statement

The authors declare that the research was conducted in the absence of any commercial or financial relationships that could be construed as a potential conflict of interest. The author(s) declared that they were an editorial board member of Frontiers, at the time of submission. This had no impact on the peer review process and the final decision.

Figures

Figure 1
Figure 1
HLA class I and II allelic diversity and genetic ancestry in patients with advanced pediatric solid cancers. (A, B) Numbers of HLA class I and II alleles detected in patients with specific tumor types (A), and stratified by molecular subtypes for RMS (eRMS, aRMS), neuroblastoma (MYCN-NA, MYCN-A, 11qWT, 11qLOH), and HGG (GBM, non-GBM) (B). (C, D) Predominant genetic ancestry fractions (≥ 70%) of patients with specific tumor types (C) and subtypes (D), as determined using EthSEQ (67, 68) based on reference superpopulations (EUR, European; AFR, African; AMR, Native/Latin American; EAS, East Asian; SAS, South Asian). Patients with no predominant genetic ancestry fraction were classified as admixed. The number of patients in each cohort is indicated at the bottom of the corresponding bar charts. RMS, rhabdomyosarcoma; eRMS, embryonal/fusion negative RMS; aRMS, alveolar/fusion positive RMS; OS, osteosarcoma; EWS, Ewing sarcoma; NRSTS, non-rhabdomyosarcoma soft-tissue sarcoma; NB, neuroblastoma; NPB, nephroblastoma; CAR, carcinoma; LGG, low-grade glioma; HGG, high-grade glioma; GBM, glioblastoma; MB, medulloblastoma; EP, ependymoma.
Figure 2
Figure 2
HLA class I and II haplotype combinations in EUR patients with advanced pediatric solid cancers. Inferred HLA-A-B-C (A, B) and HLA-DRB1-DQA1-DQB1 haplotypes (C, D) were classified as known (Kwn) or variant (Var) in comparison to reference HLA haplotypes reported in EUR controls from the NMDP and Be The Match® repository (70, 71).
Figure 3
Figure 3
HLA-DRB1-DRB3/4/5 haplotype combinations in EUR patients with specific solid tumor types (A) and subtypes (B). HLA-DRB1-DRB3/4/5 haplotypes were inferred according to known combinations of DRB1 with DRB3, DRB4 and/or DRB5 genes (–74).
Figure 4
Figure 4
HLA homozygosity frequencies in EUR patients with advanced pediatric solid cancers. The percentages of patients homozygous for HLA class I and II genes are indicated in cohorts corresponding to specific tumor types (A) and subtypes (B). Reference frequencies reported in EUR control individuals (75) are shown on the left (grey bar; NA: not available). The label in the upper left corner of each panel refers to the corresponding HLA gene. DQ and DP refer to HLA-DQA1-DQB1 and HLA-DPA1-DPB1, respectively.
Figure 5
Figure 5
HLA class I and II alleles under- or overrepresented in EUR patients with advanced pediatric solid cancers in comparison with controls. HLA genes and alleles are indicated on the top and ordered by their descending frequencies in EUR control individuals (70, 71, 76, 77). Bubbles are sized according to allele frequencies, and colored by the ratio (fold change) of allele frequencies between patients and controls (underrepresented, green; overrepresented, red).
Figure 6
Figure 6
HLA class I and HLA-DR antigen expression in advanced pediatric solid tumors. The percentages of specimens with HLA class I (A, B) and HLA-DR (C, D) immunoreactivity on tumor cells assessed by IHC were scored using a semi-quantitative scale as follows: 3 (“high”, ≥ 70% tumor cells), 2 (“intermediate”, ≥ 30 to < 70%), 1 (“low”, ≥ 5 to < 30%), and 0 (negative, < 5%). Tumor samples are classified by specific tumor types (A, C), or subtypes for RMS (eRMS, aRMS), neuroblastoma (MYCN-NA, MYCN-A, 11qWT, 11qLOH), and HGG (GBM, non-GBM) (B, D). The numbers of samples are indicated below the corresponding bar charts.
Figure 7
Figure 7
Representative examples of HLA class I immunostaining in advanced pediatric solid tumors. All tumor cells in a case of Ewing sarcoma (A) and a case of ependymoma (B) are homogeneously and strongly labeled by anti-HLA class I antibody (V, tumor vessel). In (C) all tumor cells in this other case of Ewing sarcoma are reactive with anti-HLA class I antibody but with variable apparent levels of intensity (V, tumor vessel as internal control). In a case of HGG (D) and in a case of osteosarcoma (E), HLA class I shows a patchy expression in tumor cells (V, tumor vessel; arrowheads, immune cells). In this case of nephroblastoma (F), HLA class I is strongly expressed by mesenchymal cells (M) and tubular epithelial structures (arrowheads) but is undetectable in undifferentiated blastema cells. In a case of neuroblastoma (G) and a case of rhabdomyosarcoma (H), HLA class I is undetectable on tumor cells while immune cells (arrowheads) and tumor vessels (V) are labeled. Indirect immunoperoxidase with nuclear counterstaining by hematoxylin. Original magnifications: (A–C) x220; (D) x280; (E) x220; (F) x180; (G) x320; (H) x280.
Figure 8
Figure 8
Representative examples of HLA-DR immunostaining in advanced pediatric solid tumors. HLA-DR is homogeneously expressed in a case of ependymoma (A) (V, tumor vessel). A patchy expression is visible in cases of osteosarcoma (B), of HGG (C) and of LGG (D). HLA-DR is undetectable on tumor cells in cases of osteosarcoma (E), Ewing sarcoma (F), rhabdomyosarcoma (G) and neuroblastoma (H); variable numbers of immune cells (arrowheads) are positive (V, tumor vessel). Indirect immunoperoxidase with nuclear counterstaining by hematoxylin. Original magnifications: (A) x200; (B) x180; (C, D) x280; (E) x220; (F) x250; (G) x220; (H) x300.
Figure 9
Figure 9
Landscape of SNVs and CNVs in HLA and APP genes in advanced pediatric solid tumors. Mutations detected in the coding sequences of 47 out of 78 selected genes (KEGG pathway hsa04612) are illustrated according to the type of SNVs and their consequence. Tumor subtypes are shown when applicable, and non-EUR patients indicated by a dot. CNVs in the HLA region, B2M and CIITA genes associated with LOH, LOH+amplification, CN-LOH and/or biallelic losses are indicated by colored boxes.
Figure 10
Figure 10
Prevalence of HLA LOH in advanced pediatric solid tumor types (A) and subtypes (B). The label in the upper left corner of each panel refers to the corresponding HLA gene(s) or their combination.
Figure 11
Figure 11
Detection of HLA class I alleles, quantification of HLA and APP transcripts, and IHC scores in PDX models in comparison with primary tumor samples. HLA class I (A–C) alleles detected (light brown) or not (green) from PDX WES and RNA-Seq in comparison with normal and patient tumor NGS data are illustrated on the left panel. The upper, middle and lower RMS groups correspond to eRMS, aRMS, and other RMS PDXs, respectively. Patterns consistent with HLA class I LOH are indicated in dark green. Relative transcript levels (arbitrary units, A.U. x100) of HLA class I classical (A–C) and nonclassical (E, F) genes, TAP1, TAP2 and B2M as quantified by RT-qPCR (Taqman assay) in selected normal tissues (top) and PDXs (bottom) are shown on the middle panel. HLA class I IHC scores (using the EMR8-5 mAb) in comparison between PDXs and the corresponding primary tumor specimens are indicated on the right panel.

References

    1. Gröbner SN, Worst BC, Weischenfeldt J, Buchhalter I, Kleinheinz K, Rudneva VA, et al. . The landscape of genomic alterations across childhood cancers. Nature (2018) 555(7696):321–7. doi: 10.1038/nature25480 - DOI - PubMed
    1. Ma X, Liu Y, Liu Y, Alexandrov LB, Edmonson MN, Gawad C, et al. . Pan-cancer genome and transcriptome analyses of 1,699 paediatric leukaemias and solid tumours. Nature (2018) 555(7696):371–6. doi: 10.1038/nature25795 - DOI - PMC - PubMed
    1. Dupain C, Harttrampf AC, Boursin Y, Lebeurrier M, Rondof W, Robert-Siegwald G, et al. . Discovery of new fusion transcripts in a cohort of pediatric solid cancers at relapse and relevance for personalized medicine. Mol Ther (2019) 27(1):200–18. doi: 10.1016/j.ymthe.2018.10.022 - DOI - PMC - PubMed
    1. Tanaka M, Yamazaki Y, Kanno Y, Igarashi K, Aisaki KI, Kanno J, et al. . Ewing’s sarcoma precursors are highly enriched in embryonic osteochondrogenic progenitors. J Clin Invest (2014) 124(7):3061–74. doi: 10.1172/JCI72399 - DOI - PMC - PubMed
    1. Vitte J, Gao F, Coppola G, Judkins AR, Giovannini M. Timing of Smarcb1 and Nf2 inactivation determines schwannoma versus rhabdoid tumor development. Nat Commun (2017) 8(1):1–12. doi: 10.1038/s41467-017-00346-5 - DOI - PMC - PubMed

Publication types

Substances