

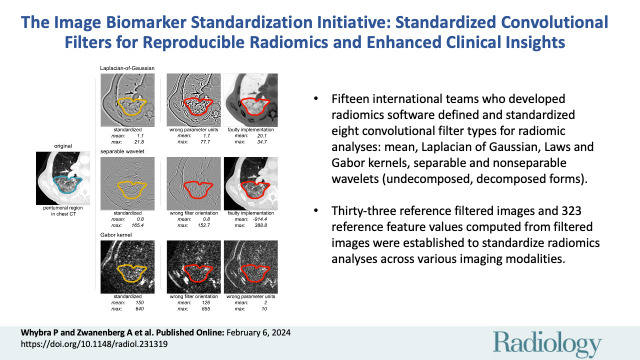
The Image Biomarker Standardization Initiative: Standardized Convolutional Filters for Reproducible Radiomics and Enhanced Clinical Insights
- PMID: 38319168
- PMCID: PMC10902595
- DOI: 10.1148/radiol.231319
The Image Biomarker Standardization Initiative: Standardized Convolutional Filters for Reproducible Radiomics and Enhanced Clinical Insights
Abstract
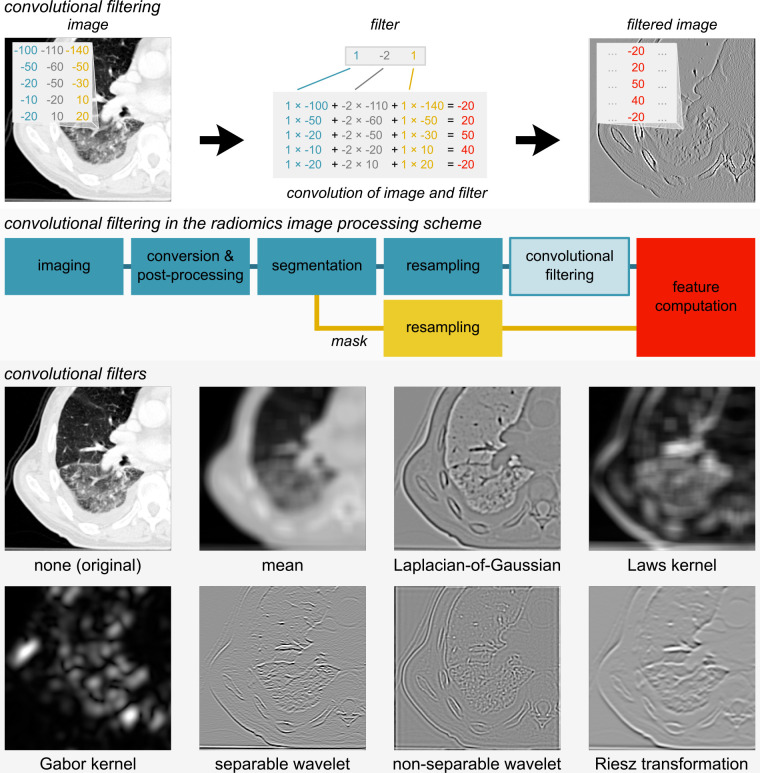
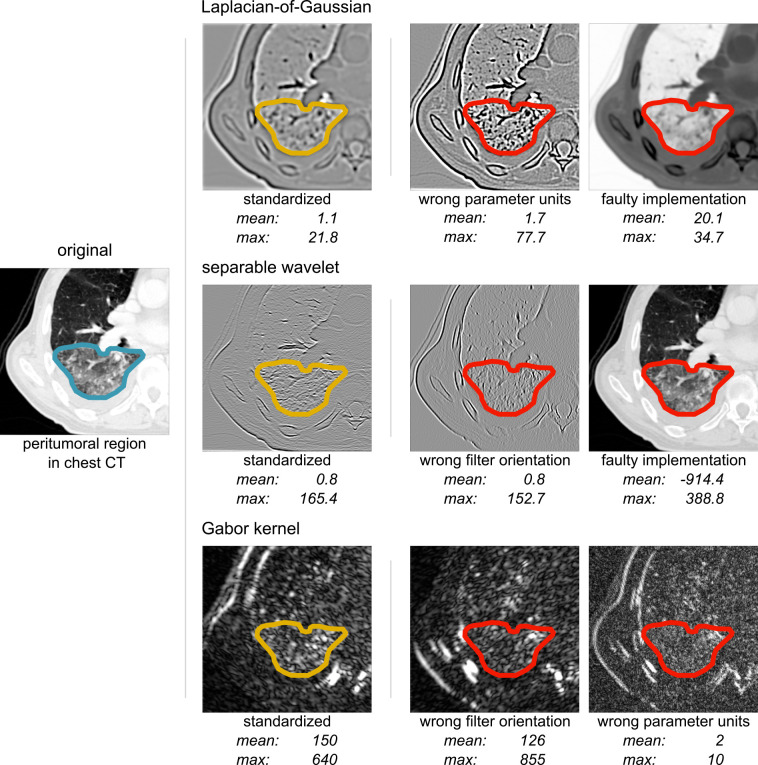
Filters are commonly used to enhance specific structures and patterns in images, such as vessels or peritumoral regions, to enable clinical insights beyond the visible image using radiomics. However, their lack of standardization restricts reproducibility and clinical translation of radiomics decision support tools. In this special report, teams of researchers who developed radiomics software participated in a three-phase study (September 2020 to December 2022) to establish a standardized set of filters. The first two phases focused on finding reference filtered images and reference feature values for commonly used convolutional filters: mean, Laplacian of Gaussian, Laws and Gabor kernels, separable and nonseparable wavelets (including decomposed forms), and Riesz transformations. In the first phase, 15 teams used digital phantoms to establish 33 reference filtered images of 36 filter configurations. In phase 2, 11 teams used a chest CT image to derive reference values for 323 of 396 features computed from filtered images using 22 filter and image processing configurations. Reference filtered images and feature values for Riesz transformations were not established. Reproducibility of standardized convolutional filters was validated on a public data set of multimodal imaging (CT, fluorodeoxyglucose PET, and T1-weighted MRI) in 51 patients with soft-tissue sarcoma. At validation, reproducibility of 486 features computed from filtered images using nine configurations × three imaging modalities was assessed using the lower bounds of 95% CIs of intraclass correlation coefficients. Out of 486 features, 458 were found to be reproducible across nine teams with lower bounds of 95% CIs of intraclass correlation coefficients greater than 0.75. In conclusion, eight filter types were standardized with reference filtered images and reference feature values for verifying and calibrating radiomics software packages. A web-based tool is available for compliance checking.
© RSNA, 2024 See also the editorial by Huisman and D'Antonoli in this issue.
Conflict of interest statement
Figures
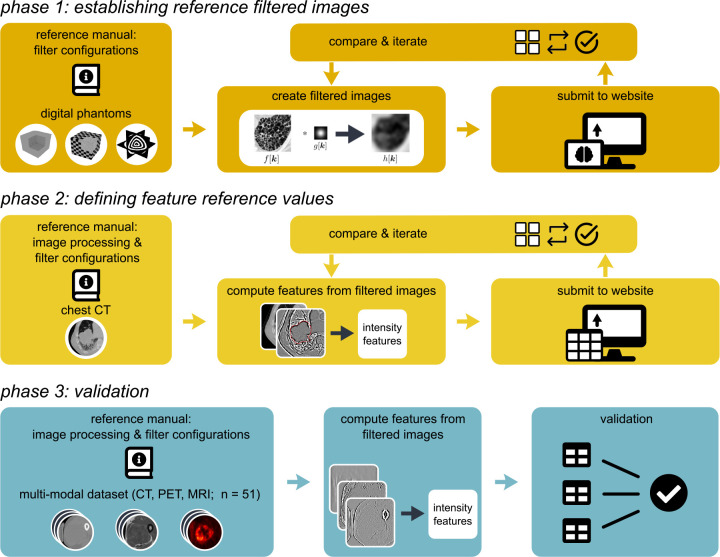
![Results overview. In phase 1, participating teams computed 36 filtered
images of convolutional filters according to predefined configurations.
These filtered images were compared, and consensus was measured. Teams
updated their implementations iteratively, which led to an improvement of
consensus over time (arbitrary [arb.] unit; 27 months). Consensus strength
was based on matching the voxel-wise difference between filtered images and
the tentative reference filtered image within a tolerance. The number of
participating teams at each point is shown. In phase 2, participating teams
computed 396 features from filtered images of convolutional filters
according to predefined filter and image processing configurations. As in
phase 1, teams updated their implementations iteratively. Unlike phase 1,
improvement in consensus was mostly because of more teams enrolling over
time (arbitrary unit; 15 months). Consensus strength was based on the number
of teams matching the tentative reference feature value within a tolerance
and was assigned according to the same categories as in phase 1. In phase 3,
reproducibility of features computed from filtered images was validated.
Teams computed 486 features from a public data set of 51 patients with
soft-tissue sarcoma that were scanned using CT, fluorine 18
fluorodeoxyglucose (FDG) PET, and T1-weighted (T1w) MRI. Reproducibility was
assessed using the lower bound of the 95% CI of the intraclass correlation
coefficient: poor, lower bound less than 0.50; moderate, between 0.50 and
0.75; good, between 0.75 and 0.90; excellent, greater than 0.90; and
unknown, computed by fewer than two teams.](https://cdn.ncbi.nlm.nih.gov/pmc/blobs/82a2/10902595/da08eedd759e/radiol.231319.fig4.jpg)
References
Publication types
MeSH terms
Substances
Grants and funding
LinkOut - more resources
Full Text Sources
