. 2024 May 2;84(9):1475-1490.
doi: 10.1158/0008-5472.CAN-23-2812.

Targeting TACC3 Induces Immunogenic Cell Death and Enhances T-DM1 Response in HER2-Positive Breast Cancer

Affiliations

Targeting TACC3 Induces Immunogenic Cell Death and Enhances T-DM1 Response in HER2-Positive Breast Cancer

Mustafa Emre Gedik et al. Cancer Res. .

Abstract

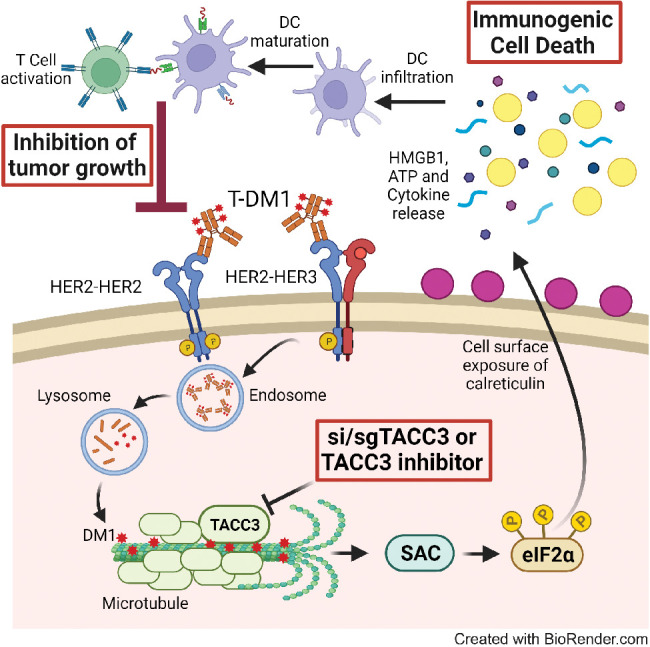
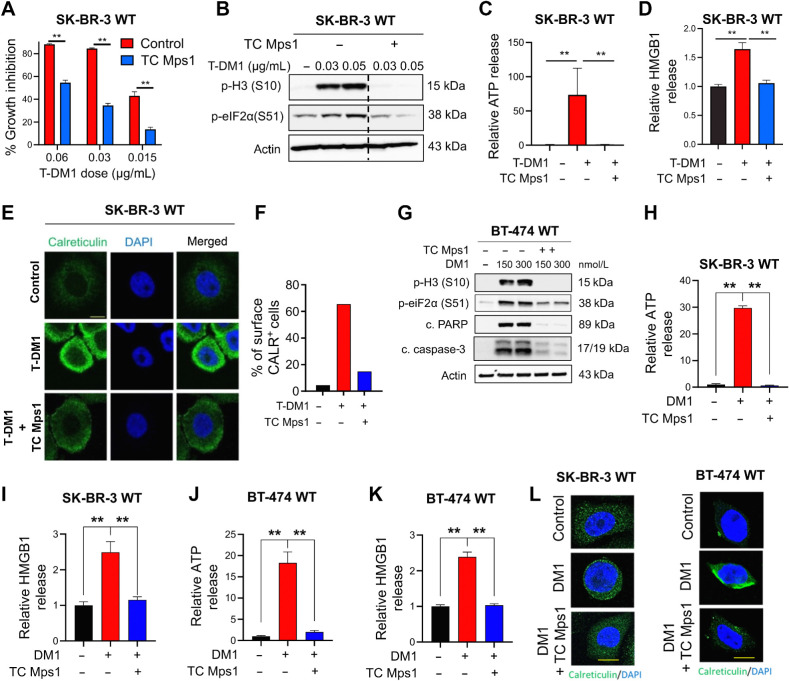
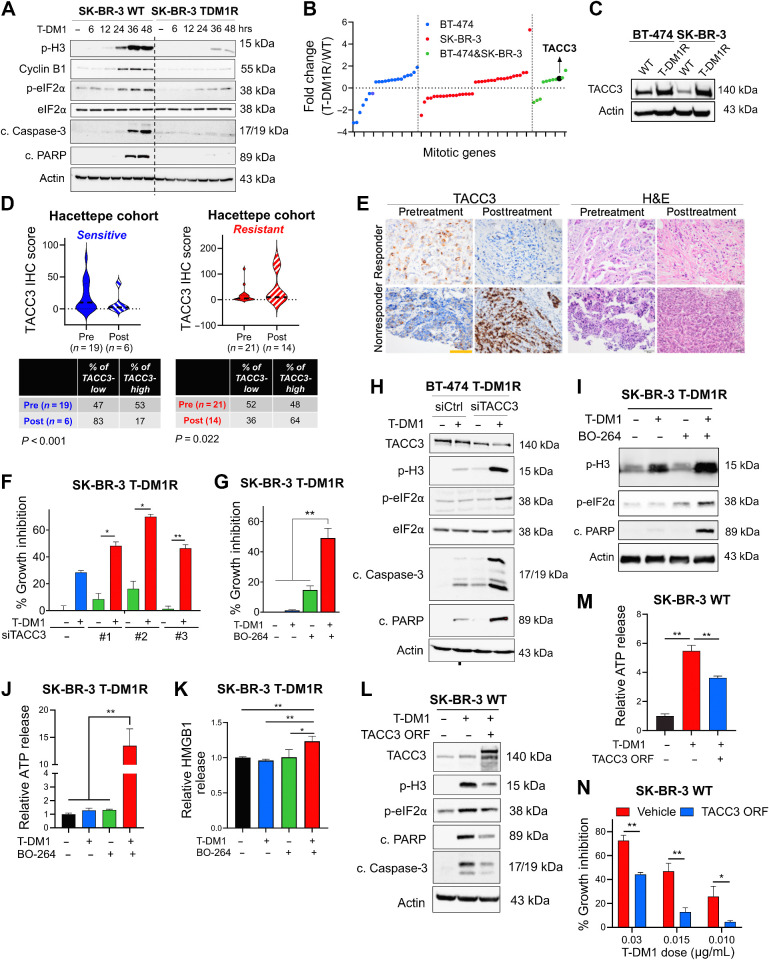
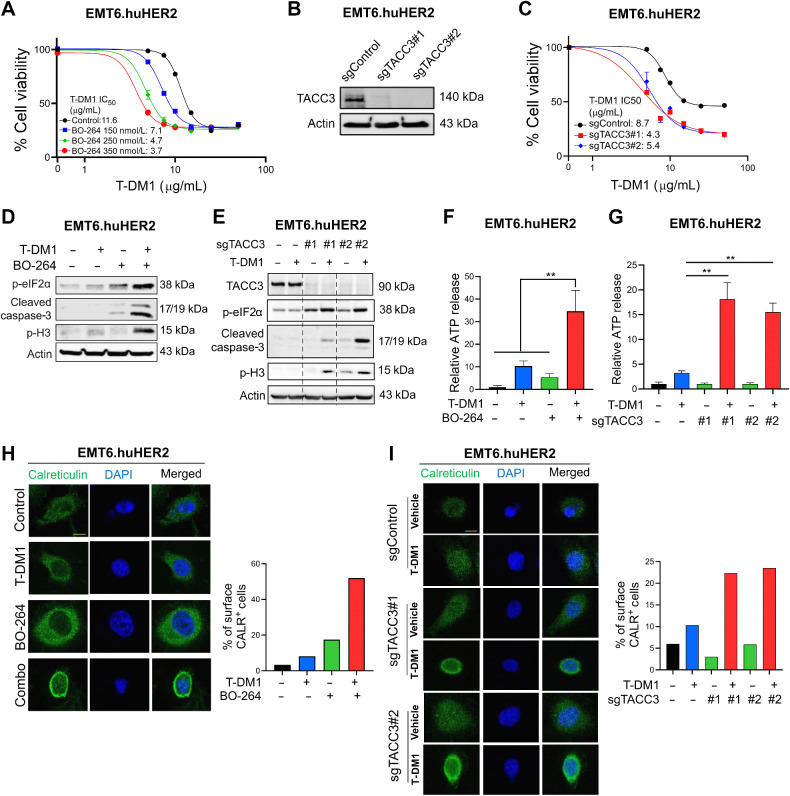
Trastuzumab emtansine (T-DM1) was the first and one of the most successful antibody-drug conjugates (ADC) approved for treating refractory HER2-positive breast cancer. Despite its initial clinical efficacy, resistance is unfortunately common, necessitating approaches to improve response. Here, we found that in sensitive cells, T-DM1 induced spindle assembly checkpoint (SAC)-dependent immunogenic cell death (ICD), an immune-priming form of cell death. The payload of T-DM1 mediated ICD by inducing eIF2α phosphorylation, surface exposure of calreticulin, ATP and HMGB1 release, and secretion of ICD-related cytokines, all of which were lost in resistance. Accordingly, ICD-related gene signatures in pretreatment samples correlated with clinical response to T-DM1-containing therapy, and increased infiltration of antitumor CD8+ T cells in posttreatment samples was correlated with better T-DM1 response. Transforming acidic coiled-coil containing 3 (TACC3) was overexpressed in T-DM1-resistant cells, and T-DM1 responsive patients had reduced TACC3 protein expression whereas nonresponders exhibited increased TACC3 expression during T-DM1 treatment. Notably, genetic or pharmacologic inhibition of TACC3 restored T-DM1-induced SAC activation and induction of ICD markers in vitro. Finally, TACC3 inhibition in vivo elicited ICD in a vaccination assay and potentiated the antitumor efficacy of T-DM1 by inducing dendritic cell maturation and enhancing intratumoral infiltration of cytotoxic T cells. Together, these results illustrate that ICD is a key mechanism of action of T-DM1 that is lost in resistance and that targeting TACC3 can restore T-DM1-mediated ICD and overcome resistance.

Significance: Loss of induction of immunogenic cell death in response to T-DM1 leads to resistance that can be overcome by targeting TACC3, providing an attractive strategy to improve the efficacy of T-DM1.


Figures

None
Graphical abstract
Figure 1. T-DM1 induces ICD markers in T-DM1–sensitive breast cancer cells and ICD correlates with T-DM1 sensitivity in patients. A, Western blot analysis of mitotic arrest [p-H3 (S10)], apoptosis (cleaved caspase-3 and PARP), and ICD marker [p-eIF2α (S51)] in T-DM1–treated SK-BR-3 WT (left) and BT-474 WT (right) cells. B and C, Relative ATP release (B) and HMGB1 release (C) from T-DM1–treated SK-BR-3 WT and BT-474 WT cells (n = 3, 4). D, Immunofluorescence cell-surface staining of calreticulin (green) in T-DM1–treated SK-BR-3 WT cells. Scale bar, 10 μm. DAPI was used to stain the nucleus. Its quantification is provided on the right. E, Cytokine array blot analysis showing the differentially secreted cytokines in T-DM1–treated SK-BR-3 WT cells. F, Schematic summary of the treatment scheme and the sample collection timeline in GSE194040 (22). G, Heatmap of ICD-related genes found in the ICD gene signature score (33) and their correlation with pCR in T-DM1 + pertuzumab-treated patients from GSE194040. pCR: 1, sensitive; pCR: 0, resistant. Chi-square analysis of sensitive vs. resistant tumors expressing low vs. high ICD score is provided below. H, Percentage of CD8+ cells in sensitive (sens) vs. resistant (res) tumors collected pre- (n = 40) and post-T-DM1 (n = 18) treatment. Tables of the percentages of CD8-low or CD8-high tumors (based on average levels of CD8+ cells in each group) are given below and significance was calculated using Chi-square test. I, The representative images from H. Scale bar, 150 μm. Data correspond to mean values ± SD. P values for the bar graphs were calculated with the unpaired, two-tailed Student t test. Significance for the Chi-square analysis was calculated with the Chi-square test. **, P < 0.01. (F, Created with BioRender.com.)
Figure 1.
T-DM1 induces ICD markers in T-DM1–sensitive breast cancer cells and ICD correlates with T-DM1 sensitivity in patients. A, Western blot analysis of mitotic arrest [p-H3 (S10)], apoptosis (cleaved caspase-3 and PARP), and ICD marker [p-eIF2α (S51)] in T-DM1–treated SK-BR-3 WT (left) and BT-474 WT (right) cells. B and C, Relative ATP release (B) and HMGB1 release (C) from T-DM1–treated SK-BR-3 WT and BT-474 WT cells (n = 3, 4). D, Immunofluorescence cell-surface staining of calreticulin (green) in T-DM1–treated SK-BR-3 WT cells. Scale bar, 10 μm. DAPI was used to stain the nucleus. Its quantification is provided on the right. E, Cytokine array blot analysis showing the differentially secreted cytokines in T-DM1–treated SK-BR-3 WT cells. F, Schematic summary of the treatment scheme and the sample collection timeline in GSE194040 (22). G, Heatmap of ICD-related genes found in the ICD gene signature score (33) and their correlation with pCR in T-DM1 + pertuzumab-treated patients from GSE194040. pCR: 1, sensitive; pCR: 0, resistant. Chi-square analysis of sensitive vs. resistant tumors expressing low vs. high ICD score is provided below. H, Percentage of CD8+ cells in sensitive (sens) vs. resistant (res) tumors collected pre- (n = 40) and post-T-DM1 (n = 18) treatment. Tables of the percentages of CD8-low or CD8-high tumors (based on average levels of CD8+ cells in each group) are given below and significance was calculated using Chi-square test. I, The representative images from H. Scale bar, 150 μm. Data correspond to mean values ± SD. P values for the bar graphs were calculated with the unpaired, two-tailed Student t test. Significance for the Chi-square analysis was calculated with the Chi-square test. **, P < 0.01. (F, Created with BioRender.com.)
Figure 2. T-DM1–induced ICD is driven by SAC-dependent mitotic arrest induced by the payload, DM1. A, Percent growth inhibition in SK-BR-3 WT cells treated with T-DM1 alone or in combination with 1 μmol/L TC Mps1 (Mps1 inhibitor; n = 4). B, Western blot analysis of p-H3 and p-eIF2α in SK-BR-3 WT cells treated with T-DM1 alone or in combination with 1 μmol/L TC Mps1. Actin was used as a loading control. C and D, Relative ATP (C) and HMGB1 (D) release in SK-BR-3 WT cells treated with T-DM1 alone or in combination with 1 μmol/L TC Mps1 (n = 3). E, Immunofluorescence cell-surface staining of calreticulin (green) in SK-BR-3 WT cells treated with T-DM1 alone or in combination with 1 μmol/L TC Mps1. Scale bar, 10 μm. F, The quantification graph of E. G, Western blot analysis of mitotic arrest, apoptosis, and the ICD marker, p-eIF2α (S51), in BT-474 cells treated with two different doses of DM1 (150 and 300 nmol/L) with or without TC Mps1. Actin was used as the loading control. H and I, Relative ATP (H) and HMGB1 (I) release in SK-BR-3 cells treated with DM1 (15 nmol/L) with or without TC Mps1 (n = 3). J and K, Relative ATP (J) and HMGB1 (K) release in BT-474 cells treated with DM1 (150 nmol/L) with or without TC Mps1 (n = 3). L, Surface calreticulin staining of SK-BR-3 and BT-474 cells treated with DM1 (15 nmol/L for SK-BR-3 and 150 nmol/L for BT-474) with or without TC Mps1. Data correspond to mean values ± SD. P values were calculated with the unpaired, two-tailed Student t test. **, P < 0.01.
Figure 2.
T-DM1–induced ICD is driven by SAC-dependent mitotic arrest induced by the payload, DM1. A, Percent growth inhibition in SK-BR-3 WT cells treated with T-DM1 alone or in combination with 1 μmol/L TC Mps1 (Mps1 inhibitor; n = 4). B, Western blot analysis of p-H3 and p-eIF2α in SK-BR-3 WT cells treated with T-DM1 alone or in combination with 1 μmol/L TC Mps1. Actin was used as a loading control. C and D, Relative ATP (C) and HMGB1 (D) release in SK-BR-3 WT cells treated with T-DM1 alone or in combination with 1 μmol/L TC Mps1 (n = 3). E, Immunofluorescence cell-surface staining of calreticulin (green) in SK-BR-3 WT cells treated with T-DM1 alone or in combination with 1 μmol/L TC Mps1. Scale bar, 10 μm. F, The quantification graph of E. G, Western blot analysis of mitotic arrest, apoptosis, and the ICD marker, p-eIF2α (S51), in BT-474 cells treated with two different doses of DM1 (150 and 300 nmol/L) with or without TC Mps1. Actin was used as the loading control. H and I, Relative ATP (H) and HMGB1 (I) release in SK-BR-3 cells treated with DM1 (15 nmol/L) with or without TC Mps1 (n = 3). J and K, Relative ATP (J) and HMGB1 (K) release in BT-474 cells treated with DM1 (150 nmol/L) with or without TC Mps1 (n = 3). L, Surface calreticulin staining of SK-BR-3 and BT-474 cells treated with DM1 (15 nmol/L for SK-BR-3 and 150 nmol/L for BT-474) with or without TC Mps1. Data correspond to mean values ± SD. P values were calculated with the unpaired, two-tailed Student t test. **, P < 0.01.
Figure 3. ICD-related factors are lost in T-DM1 resistance upon TACC3 overexpression, TACC3 correlates with clinical T-DM1 resistance, and its inhibition overcomes T-DM1 resistance and restores ICD markers in vitro. A, Western blot analysis of mitotic arrest, apoptosis, and ICD markers in SK-BR-3 WT and T-DM1–resistant (T-DM1R) cells treated with 0.05 μg/mL T-DM1 in a time-dependent manner. B, The log-fold change of the mitotic genes differentially expressed only in BT-474, SK-BR-3, or both T-DM1R cells compared with WT counterparts in RNA-seq analysis. C, Western blot analysis of TACC3 protein expression in BT-474 and SK-BR-3 WT vs. T-DM1R cells. Actin was used as a loading control. D, TACC3 IHC score in Hacettepe cohort patients before and after treatment with T-DM1 who are sensitive (left) vs. resistant (right) to T-DM1. The percentages of patients who have TACC3-low or -high tumors in the pre- and posttreatment groups are given below, and significance was calculated using the Chi-square test. E, Representative TACC3 IHC and hematoxylin and eosin (H&E) staining in the tumor tissues of patients from D. Scale bar, 100 μm. F, Percent growth inhibition in SK-BR-3 T-DM1R cells transfected with siTACC3 and treated with 0.03 μmol/L T-DM1 (n = 4–6). G, Percent growth inhibition in SK-BR-3 T-DM1R cells treated with T-DM1 alone or in combination with 1 μmol/L TACC3 inhibitor (BO-264; n = 4–6). H, Western blot analysis of mitotic arrest, apoptosis, and ICD markers in BT-474 T-DM1R cells transfected with siTACC3 and treated with T-DM1. Actin was used as a loading control. I, Western blot analysis of mitotic arrest, apoptosis, and ICD markers in SK-BR-3 T-DM1R cells treated with T-DM1 alone or in combination with BO-264. Actin was used as a loading control. J, Relative ATP release from SK-BR-3 T-DM1R cells treated with T-DM1 alone or in combination with BO-264 (n = 3, 4). K, Relative HMGB1 release from SK-BR-3 T-DM1R cells treated with T-DM1 alone or in combination with BO-264 (n = 3). L, Western blot analysis of mitotic arrest, apoptosis, and ICD markers in SK-BR-3 WT cells overexpressing TACC3 and treated with T-DM1. Actin was used as a loading control. M, Relative ATP release from SK-BR-3 WT cells overexpressing TACC3 and treated with T-DM1 (n = 3). N, Percent growth inhibition in SK-BR-3 WT cells overexpressing TACC3 and treated with T-DM1 (n = 3). Data correspond to mean values ± SD. Significance for D was calculated with one-way Wilcoxon signed-rank test. P values for other subfigures were calculated with the unpaired, two-tailed Student t test. *, P < 0.05; **, P < 0.01.
Figure 3.
ICD-related factors are lost in T-DM1 resistance upon TACC3 overexpression, TACC3 correlates with clinical T-DM1 resistance, and its inhibition overcomes T-DM1 resistance and restores ICD markers in vitro. A, Western blot analysis of mitotic arrest, apoptosis, and ICD markers in SK-BR-3 WT and T-DM1–resistant (T-DM1R) cells treated with 0.05 μg/mL T-DM1 in a time-dependent manner. B, The log-fold change of the mitotic genes differentially expressed only in BT-474, SK-BR-3, or both T-DM1R cells compared with WT counterparts in RNA-seq analysis. C, Western blot analysis of TACC3 protein expression in BT-474 and SK-BR-3 WT vs. T-DM1R cells. Actin was used as a loading control. D, TACC3 IHC score in Hacettepe cohort patients before and after treatment with T-DM1 who are sensitive (left) vs. resistant (right) to T-DM1. The percentages of patients who have TACC3-low or -high tumors in the pre- and posttreatment groups are given below, and significance was calculated using the Chi-square test. E, Representative TACC3 IHC and hematoxylin and eosin (H&E) staining in the tumor tissues of patients from D. Scale bar, 100 μm. F, Percent growth inhibition in SK-BR-3 T-DM1R cells transfected with siTACC3 and treated with 0.03 μmol/L T-DM1 (n = 4–6). G, Percent growth inhibition in SK-BR-3 T-DM1R cells treated with T-DM1 alone or in combination with 1 μmol/L TACC3 inhibitor (BO-264; n = 4–6). H, Western blot analysis of mitotic arrest, apoptosis, and ICD markers in BT-474 T-DM1R cells transfected with siTACC3 and treated with T-DM1. Actin was used as a loading control. I, Western blot analysis of mitotic arrest, apoptosis, and ICD markers in SK-BR-3 T-DM1R cells treated with T-DM1 alone or in combination with BO-264. Actin was used as a loading control. J, Relative ATP release from SK-BR-3 T-DM1R cells treated with T-DM1 alone or in combination with BO-264 (n = 3, 4). K, Relative HMGB1 release from SK-BR-3 T-DM1R cells treated with T-DM1 alone or in combination with BO-264 (n = 3). L, Western blot analysis of mitotic arrest, apoptosis, and ICD markers in SK-BR-3 WT cells overexpressing TACC3 and treated with T-DM1. Actin was used as a loading control. M, Relative ATP release from SK-BR-3 WT cells overexpressing TACC3 and treated with T-DM1 (n = 3). N, Percent growth inhibition in SK-BR-3 WT cells overexpressing TACC3 and treated with T-DM1 (n = 3). Data correspond to mean values ± SD. Significance for D was calculated with one-way Wilcoxon signed-rank test. P values for other subfigures were calculated with the unpaired, two-tailed Student t test. *, P < 0.05; **, P < 0.01.
Figure 4. Targeting TACC3 sensitizes the human HER2-expressing EMT6.huHER2 cells to T-DM1 and induces ICD markers. A, Cell viability assay in EMT6.huHER2 cells treated with increasing doses of T-DM1 alone or combination with different doses of BO-264 for 3 days (n = 4). B, Validation of TACC3 knockout in EMT6.huHER2 cells obtained using CRISPR/Cas9 system. C, Cell viability assay in EMT6.huHER2.sgTACC3 vs. sgControl cells treated with increasing doses of T-DM1 for 3 days (n = 4). D, Western blot analysis of mitotic arrest, apoptosis, and ICD markers in EMT6.huHER2 cells treated with T-DM1 alone or in combination with BO-264. Actin was used as a loading control. E, Western blot analysis of TACC3, mitotic arrest, apoptosis, and ICD markers in EMT6.huHER2.sgTACC3 vs. sgControl cells treated with T-DM1. Actin was used as a loading control. F, Relative ATP release from EMT6.huHER2 cells treated with T-DM1 alone or in combination with BO-264 (n = 3). G, Relative ATP release from EMT6.huHER2.sgTACC3 vs. sgControl cells treated with T-DM1 (n = 3, 4). H, Immunofluorescence cell-surface staining of calreticulin (green) in EMT6.huHER2 cells treated with T-DM1 alone or in combination with BO-264. Its quantification is provided on the right. I, Immunofluorescence cell-surface staining of calreticulin (green) in EMT6.huHER2.sgTACC3 vs. sgControl cells treated with T-DM1. Its quantification is provided on the right. Data correspond to mean values ± SD. P values were calculated with the unpaired, two-tailed Student t test. **, P < 0.01.
Figure 4.
Targeting TACC3 sensitizes the human HER2-expressing EMT6.huHER2 cells to T-DM1 and induces ICD markers. A, Cell viability assay in EMT6.huHER2 cells treated with increasing doses of T-DM1 alone or combination with different doses of BO-264 for 3 days (n = 4). B, Validation of TACC3 knockout in EMT6.huHER2 cells obtained using CRISPR/Cas9 system. C, Cell viability assay in EMT6.huHER2.sgTACC3 vs. sgControl cells treated with increasing doses of T-DM1 for 3 days (n = 4). D, Western blot analysis of mitotic arrest, apoptosis, and ICD markers in EMT6.huHER2 cells treated with T-DM1 alone or in combination with BO-264. Actin was used as a loading control. E, Western blot analysis of TACC3, mitotic arrest, apoptosis, and ICD markers in EMT6.huHER2.sgTACC3 vs. sgControl cells treated with T-DM1. Actin was used as a loading control. F, Relative ATP release from EMT6.huHER2 cells treated with T-DM1 alone or in combination with BO-264 (n = 3). G, Relative ATP release from EMT6.huHER2.sgTACC3 vs. sgControl cells treated with T-DM1 (n = 3, 4). H, Immunofluorescence cell-surface staining of calreticulin (green) in EMT6.huHER2 cells treated with T-DM1 alone or in combination with BO-264. Its quantification is provided on the right. I, Immunofluorescence cell-surface staining of calreticulin (green) in EMT6.huHER2.sgTACC3 vs. sgControl cells treated with T-DM1. Its quantification is provided on the right. Data correspond to mean values ± SD. P values were calculated with the unpaired, two-tailed Student t test. **, P < 0.01.
Figure 5. Inhibition of TACC3 in combination with T-DM1 leads to ex vivo DC maturation, T-cell activation, and release of ICD-related proinflammatory cytokines. A, Schematic representation of the experimental workflow for DC maturation, T-cell activation, and cytokine profiling experiments. B and C, Flow cytometry analysis of DC maturation markers in DC cells incubated with the CM collected from EMT6.huHER2 cells treated with 7.5 μg/mL T-DM1 and 500 nmol/L BO-264, alone or in combination (B) or in EMT6.huHER2.sgControl vs. sgTACC3 cells treated with 7.5 μg/mL T-DM1 (C). D, Quantification of CD80+/CD86+ cells from B and C (n = 2). E and F, Flow cytometry analysis of T-cell activation marker, CD25 in CD8+ T cells cocultured with DCs from B and C. G, Quantification of the CD25 mean fluorescence intensity (MFI) from E and F (n = 2). H, Levels of proinflammatory cytokines in the media collected from DC-T-cell cocultures from E. Data correspond to mean values ± SD. P values were calculated with the unpaired, two-tailed Student t test. **, P < 0.01. (A, Created with BioRender.com.)
Figure 5.
Inhibition of TACC3 in combination with T-DM1 leads to ex vivo DC maturation, T-cell activation, and release of ICD-related proinflammatory cytokines. A, Schematic representation of the experimental workflow for DC maturation, T-cell activation, and cytokine profiling experiments. B and C, Flow cytometry analysis of DC maturation markers in DC cells incubated with the CM collected from EMT6.huHER2 cells treated with 7.5 μg/mL T-DM1 and 500 nmol/L BO-264, alone or in combination (B) or in EMT6.huHER2.sgControl vs. sgTACC3 cells treated with 7.5 μg/mL T-DM1 (C). D, Quantification of CD80+/CD86+ cells from B and C (n = 2). E and F, Flow cytometry analysis of T-cell activation marker, CD25 in CD8+ T cells cocultured with DCs from B and C. G, Quantification of the CD25 mean fluorescence intensity (MFI) from E and F (n = 2). H, Levels of proinflammatory cytokines in the media collected from DC-T-cell cocultures from E. Data correspond to mean values ± SD. P values were calculated with the unpaired, two-tailed Student t test. **, P < 0.01. (A, Created with BioRender.com.)
Figure 6. TACC3 inhibition elicits ICD in vivo and potentiates TDM1 response via increasing the infiltration of antitumor immune cells in vivo. A, Schematic representation of the in vivo vaccination assay. B, Tumor-free survival curves of BALB/c mice vaccinated with PBS or single agent or combination-treated EMT6.huHER2 cells (n = 5–7). C, Tumor growth of the MMTV.f.huHER2#5 model under low dose T-DM1 (5 mg/kg, once) in combination with BO-264 (50 mg/kg, daily; n = 6, 7). D, Tumor weights of the mice in C after 14 days of treatment. E and F, Representative resected tumor pictures (E) and body weights (F) from mice in C. G, Western blot analysis of p-eIF2α and eIF2α protein expression levels in tumors from C. Actin was used as a loading control. H, Relative band density graphs for p-eIF2α normalized to eIF2α from G (n = 3). I and J, Multiplex immunofluorescence staining of CD11c/CD86 in short-term-treated MMTV.f.huHER2#5 tumors and its quantification (n = 3). K and L, Multiplex immunofluorescence staining of CD25/CD8 in short-term-treated MMTV.f.huHER2#5 tumors and its quantification (n = 3). Scale bar, 50 μm. M, Levels of the cytokines in the serums of the mice with short-term–treated MMTV.f.huHER2#5 tumors (n = 3). Data for the bar graphs and box plots correspond to mean values ± SD, whereas data for the tumor volume and body weight graphs correspond to mean values ± SEM. Endpoint criteria for mice in C and F are treatment for 14 days or until reaching ethical tumor size cutoff. P values for the bar graphs and box plots were calculated with the unpaired, two-tailed Student t test. The significance for the tumor volume graph and multiplex IHC quantification was calculated with two-way and one-way ANOVA, respectively. *, P < 0.05; **, P < 0.01. (A, Created with BioRender.com.)
Figure 6.
TACC3 inhibition elicits ICD in vivo and potentiates TDM1 response via increasing the infiltration of antitumor immune cells in vivo. A, Schematic representation of the in vivo vaccination assay. B, Tumor-free survival curves of BALB/c mice vaccinated with PBS or single agent or combination-treated EMT6.huHER2 cells (n = 5–7). C, Tumor growth of the MMTV.f.huHER2#5 model under low dose T-DM1 (5 mg/kg, once) in combination with BO-264 (50 mg/kg, daily; n = 6, 7). D, Tumor weights of the mice in C after 14 days of treatment. E and F, Representative resected tumor pictures (E) and body weights (F) from mice in C. G, Western blot analysis of p-eIF2α and eIF2α protein expression levels in tumors from C. Actin was used as a loading control. H, Relative band density graphs for p-eIF2α normalized to eIF2α from G (n = 3). I and J, Multiplex immunofluorescence staining of CD11c/CD86 in short-term-treated MMTV.f.huHER2#5 tumors and its quantification (n = 3). K and L, Multiplex immunofluorescence staining of CD25/CD8 in short-term-treated MMTV.f.huHER2#5 tumors and its quantification (n = 3). Scale bar, 50 μm. M, Levels of the cytokines in the serums of the mice with short-term–treated MMTV.f.huHER2#5 tumors (n = 3). Data for the bar graphs and box plots correspond to mean values ± SD, whereas data for the tumor volume and body weight graphs correspond to mean values ± SEM. Endpoint criteria for mice in C and F are treatment for 14 days or until reaching ethical tumor size cutoff. P values for the bar graphs and box plots were calculated with the unpaired, two-tailed Student t test. The significance for the tumor volume graph and multiplex IHC quantification was calculated with two-way and one-way ANOVA, respectively. *, P < 0.05; **, P < 0.01. (A, Created with BioRender.com.)
Figure 7. Schematic summary of the proposed model of T-DM1 sensitivity, resistance, and targeting T-DM1 resistance. A, In T-DM1–sensitive tumors, the activation of SAC and mitotic arrest lead to apoptosis and activation of ICD markers, e.g., eIF2α phosphorylation, ATP secretion, calreticulin surface exposure, and HMGB1 release, leading to DC maturation and cytotoxic T-cell, culminating in tumor growth inhibition. B, In T-DM1–resistant tumors, overexpression of TACC3 prevents activation of SAC, mitotic cell death, and ICD, thus promoting cell survival. C, Inhibition of TACC3 in combination with T-DM1 in the resistant tumors restores SAC activation and mitotic arrest, leading to apoptosis, induction of ICD hallmarks, and secretion of proinflammatory cytokines, thereby increasing the infiltration of DCs and T cells, thus restoring T-DM1 sensitivity. (Created with BioRender.com.)
Figure 7.
Schematic summary of the proposed model of T-DM1 sensitivity, resistance, and targeting T-DM1 resistance. A, In T-DM1–sensitive tumors, the activation of SAC and mitotic arrest lead to apoptosis and activation of ICD markers, e.g., eIF2α phosphorylation, ATP secretion, calreticulin surface exposure, and HMGB1 release, leading to DC maturation and cytotoxic T-cell, culminating in tumor growth inhibition. B, In T-DM1–resistant tumors, overexpression of TACC3 prevents activation of SAC, mitotic cell death, and ICD, thus promoting cell survival. C, Inhibition of TACC3 in combination with T-DM1 in the resistant tumors restores SAC activation and mitotic arrest, leading to apoptosis, induction of ICD hallmarks, and secretion of proinflammatory cytokines, thereby increasing the infiltration of DCs and T cells, thus restoring T-DM1 sensitivity. (Created with BioRender.com.)

Update of

References

    1. Galluzzi L, Buque A, Kepp O, Zitvogel L, Kroemer G. Immunogenic cell death in cancer and infectious disease. Nat Rev Immunol 2017;17:97–111. - PubMed
    1. Kroemer G, Galassi C, Zitvogel L, Galluzzi L. Immunogenic cell stress and death. Nat Immunol 2022;23:487–500. - PubMed
    1. Galluzzi L, Humeau J, Buque A, Zitvogel L, Kroemer G. Immunostimulation with chemotherapy in the era of immune checkpoint inhibitors. Nat Rev Clin Oncol 2020;17:725–41. - PubMed
    1. Pol J, Vacchelli E, Aranda F, Castoldi F, Eggermont A, Cremer I, et al. . Trial watch: immunogenic cell death inducers for anticancer chemotherapy. Oncoimmunology 2015;4:e1008866. - PMC - PubMed
    1. Liu P, Zhao L, Pol J, Levesque S, Petrazzuolo A, Pfirschke C, et al. . Crizotinib-induced immunogenic cell death in non-small cell lung cancer. Nat Commun 2019;10:1486. - PMC - PubMed

Publication types

MeSH terms