. 2024 Apr 1;223(4):e202307094.
doi: 10.1083/jcb.202307094. Epub 2024 Feb 6.

A role for Vps13-mediated lipid transfer at the ER-endosome contact site in ESCRT-mediated sorting

Affiliations

A role for Vps13-mediated lipid transfer at the ER-endosome contact site in ESCRT-mediated sorting

Sho W Suzuki et al. J Cell Biol. .

Abstract

Endosomes are specialized organelles that function in the secretory and endocytic protein sorting pathways. Endocytosed cell surface receptors and transporters destined for lysosomal degradation are sorted into intraluminal vesicles (ILVs) at endosomes by endosomal sorting complexes required for transport (ESCRT) proteins. The endosomes (multivesicular bodies, MVBs) then fuse with the lysosome. During endosomal maturation, the number of ILVs increases, but the size of endosomes does not decrease despite the consumption of the limiting membrane during ILV formation. Vesicle-mediated trafficking is thought to provide lipids to support MVB biogenesis. However, we have uncovered an unexpected contribution of a large bridge-like lipid transfer protein, Vps13, in this process. Here, we reveal that Vps13-mediated lipid transfer at ER-endosome contact sites is required for the ESCRT pathway. We propose that Vps13 may play a critical role in supplying lipids to the endosome, ensuring continuous ESCRT-mediated sorting during MVB biogenesis.


Conflict of interest statement

Disclosures: The authors declare no competing interests exist.

Figures
None
Graphical abstract
Figure S1.
Figure S1.
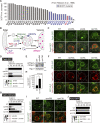
Endosomal sorting pathways in vps13Δ cells. (A) CPY missorting index in vps mutants. The graph represents the percentage of secreted CPY-Invertase as reported by Robison et al. (1988). (B) Schematic of vacuolar protein sorting. (C) Localization of Pep4–GFP. (D) Quantification of Pep4–GFP localization from C. (E) Western blotting analysis of Pep4 sorting. Cell lysates were analyzed by immunoblotting using anti-Pep4 and anti-Pgk1 antibodies. (F) Localization of GFP–ALP and Vph1–mCherry. (G) Quantification of Vph1–mCherry localization from F. (H) Quantification of Vps10–GFP fluorescence from Fig. 1 J. (I) Kex2–GFP localization in WT, vps35Δ (retromer), and vps13Δ cells. (J) Quantification of Kex2–GFP localization from I. Scale bar: 1 µm. Source data are available for this figure: SourceData FS1.
Figure 1.
Figure 1.
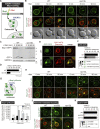
Vps13 is required for the ESCRT pathway. (A) Schematic of Mup1 sorting. (B) Mup1–GFP localization after methionine stimulation. (C) Western blotting analysis of Mup1 sorting. Cell lysates were analyzed by immunoblotting using anti-GFP and anti-G6PDH antibodies. Vacuole delivery of Mup1–GFP yields protease-resistant GFP fragments (GFP’). (D) Quantification of Mup1–GFP processing from C. (E) GFP–CPS localization. (F) Quantification of GFP–CPS localization of each category from E. (G) Schematic of Mup1–pHluorin assay. (H) Mup1–pHluorin localization after methionine stimulation. (I) Quantification of Mup1–pHluorin fluorescence at endosomes from H. (J) Vps10–GFP localization in WT, vps35Δ (retromer), and vps13Δ cells. (K) Quantification of Vps10–GFP localization from J. Scale bar: 1 µm. Source data are available for this figure: SourceData F1.
Figure 2.
Figure 2.
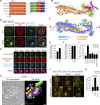
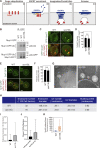
The ER–endosome contact site localization of Vps13 is critical for ESCRT-mediated sorting. (A) Schematic of Vps13 mutants. (B) The ribbon cartoon of Vps13 was generated using AlphaFold2. (C) The surface model of the alphafold predicted structure of Vps13. Blue and yellow indicate hydrophilic and hydrophobic residues, respectively. (D) Vps13–GFP localization at the ER–endosome contact site. Vps13–GFP, DsRed–HDEL (ER), and Mup1–BFP (endosome) expressing WT and vps4Δ cells were stimulated with methionine for 30 min. Scale bar: 1 µm. (E) Quantification of Mup1-BFP puncta associated with the ER (DsRed-HDEL) from D. (F) Quantification of Vps13–GFP localization at the ER–endosome contact site from D. (G) Live-cell imaging analysis of Vps13–GFP at the ER-endosome contact site. Vps13–GFP, DsRed–HDEL (ER), and Mup1–BFP (endosome) expressing WT cells were stimulated with methionine for 30 min. Scale bar: 500 nm. (H) Two-dimensional cross-sections and three-dimensional models of vps4Δ cells. ER is traced in green. Ribosomes are indicated as green dots. The endosome stacks are shown in different colors to differentiate individual membranes. Round endosomes are traced in yellow. Larger tubular and cisternal structures are in various shades. Scale bars: 100 nm. (I and K) Quantification of Mup1 sorting in vps13 mutants from Fig. S2, J and K. (J) Mup1–GFP localization after methionine stimulation in vps13 mutants. Scale bar: 1 µm.
Figure S2.
Figure S2.
Vps13 localization at the ER–endosome contact site. (A) Localization of Vps13–GFP. Scale bar: 1 µm. (B) Quantification of Vps13–GFP colocalizing with mCherry–Vps21 from A. (C) Localization of Vps13ΔC–GFP (residues 1–1851). Scale bar: 1 µm. (D) Quantification of Vps13–GFP puncta localization from C. (E) The localization of Vps13N–GFP (residues 1–39). Scale bar: 1 µm. (F) Line scan analysis for the region highlighted by the yellow dash line in E. (G) Vps13–GFP localization at the ER–endosome contact site. Vps13–GFP, DsRed–HDEL (ER), and Mup1–BFP (endosome) expressing cells were stimulated with methionine. Scale bar: 1 µm. (H) Live cell-imaging analysis of the ER (GFP-HDEL) and endosome (mCherry–Vps21). Scale bar: 500 nm. (I) The diameter of the ER contact with the endosome. The membrane was designed ER by the observation of its bound ribosomes, dimensions, and staining by high-pressure freezing and electron tomography. ER diameters per 100-nm interval starting at the endosome contact along the 500 nm length of ER were determined. (J and K) Mup1–GFP processing in vps13 mutants after methionine stimulation. Cell lysates were analyzed by immunoblotting using anti-GFP and anti-G6PDH antibodies. (L) Western blotting analysis of Vps13 expression. Cell lysates were analyzed by immunoblotting using anti-HA and anti-Pgk1 antibodies. Source data are available for this figure: SourceData FS2.
Figure S3.
Figure S3.
Characterization of MVB biogenesis in vps13 mutants. (A) Schematic of ESCRT-mediated sorting at the endosome. (B) The ubiquitination of Mup1–GFP. Mup1–GFP expressing cells were stimulated with methionine for 15 min and then immunoprecipitated under denatured conditions. The immunoprecipitated (IP) products were analyzed by immunoblotting using anti-GFP and anti-ubiquitin antibodies. (C) GFP–Vps27 (ESCRT-0) localization. Scale bar: 1 µm. (D) Quantification of GFP–Vps27 localization from C. (E) Snf7–GFP (ESCRT-III) localization. Scale bar: 1 µm. (F) Quantification of Snf7–GFP localization from E. (G) Thin section electron miscopy images of WT and vps13Δ yeast cells. Scale bars: 100 nm. (H) The value of quantification data of electron tomography analysis. (I) Quantification of endosome clustering. (J) Quantification of the chance of MVBs (endosomes) in WT and vps13Δ cells. (K) Fluorescence intensity of the Vps55–mNeonGreen punctate structures from Fig. 4 D. Source data are available for this figure: SourceData FS3.
Figure 3.
Figure 3.
Vps13 is not required for cargo ubiquitination and ESCRT recruitment. (A) Schematic of a rapamycin-dependent degradation system for Can1. (B) Can1–FKBP localization. Rapamycin-insensitive mutant cells (tor1-1, fpr1Δ) expressing Can1–GFP–2xFKBP (Can1–FKBP) and FRB–3xUb were treated with rapamycin. (C) Can1–FKBP processing after rapamycin treatments. Cell lysates were analyzed by immunoblotting using anti-GFP and anti-G6PDH antibodies. (D) Quantification of Can-FKBP sorting from C. (E) Vps4–GFP localization. (F) Quantification of endosomal Vps4–GFP localization from E. Scale bar: 1 µm. Source data are available for this figure: SourceData F3.
Figure 4.
Figure 4.
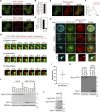
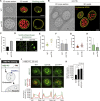
Efficient intraluminal vesicle formation requires Vps13. (A and B) Cross-sectional tomographic slices and three-dimensional models of WT and vps13Δ cells. Endosome-limiting membranes are traced in yellow, and detached ILVs are traced in red. ILV budding profiles are traced in green. Scale bars: 100 nm. (C) Quantification of the number of endosomes. (D) Vps55–mNeonGreen localization. Scale bars: 1 µm. (E) Measurement of the diameter of endosomes. (F) Quantification of the number of ILVs per endosome. (G) Measurement of ILV diameter. (H) Quantification of the budding profile (BPs) per endosome. The percentage of the limiting membrane incorporated into ILV budding profiles was measured for each strain. (I) Schematic of NBD-PC sorting. (J) NBD-PC localization after 30 min staining. Scale bars: 1 µm. (K) Quantification of NBD-PC intensity at the vacuole membrane.
Figure 5.
Figure 5.
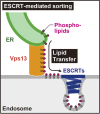
Model of a role of Vps13 in ESCRT-mediated sorting. A lipid transfer protein Vps13 may play a critical role in providing lipids to the endosome that permit continuous ESCRT-mediated sorting. During autophagosome formation, Atg2, another Vps13-like lipid transfer protein, delivers lipids from the ER to the autophagosome to support its expansion.

References

    1. Bean, B.D.M., Dziurdzik S.K., Kolehmainen K.L., Fowler C.M.S., Kwong W.K., Grad L.I., Davey M., Schluter C., and Conibear E.. 2018. Competitive organelle-specific adaptors recruit Vps13 to membrane contact sites. J. Cell Biol. 217:3593–3607. 10.1083/jcb.201804111 - DOI - PMC - PubMed
    1. Bilodeau, P.S., Urbanowski J.L., Winistorfer S.C., and Piper R.C.. 2002. The Vps27p Hse1p complex binds ubiquitin and mediates endosomal protein sorting. Nat. Cell Biol. 4:534–539. 10.1038/ncb815 - DOI - PubMed
    1. Carlton, J.G., Agromayor M., and Martin-Serrano J.. 2008. Differential requirements for Alix and ESCRT-III in cytokinesis and HIV-1 release. Proc. Natl. Acad. Sci. USA. 105:10541–10546. 10.1073/pnas.0802008105 - DOI - PMC - PubMed
    1. Dabrowski, R., Tulli S., and Graef M.. 2023. Parallel phospholipid transfer by Vps13 and Atg2 determines autophagosome biogenesis dynamics. J. Cell Biol. 222:e202211039. 10.1083/jcb.202211039 - DOI - PMC - PubMed
    1. Dziurdzik, S.K., and Conibear E.. 2021. The Vps13 family of lipid transporters and its role at membrane contact sites. Int. J. Mol. Sci. 22:2905. 10.3390/ijms22062905 - DOI - PMC - PubMed

Publication types

MeSH terms

Substances

LinkOut - more resources