Clinical Trial
. 2024 May 1;14(5):766-785.
doi: 10.1158/2159-8290.CD-23-0857.

Early Immune Remodeling Steers Clinical Response to First-Line Chemoimmunotherapy in Advanced Gastric Cancer

Affiliations
Clinical Trial

Early Immune Remodeling Steers Clinical Response to First-Line Chemoimmunotherapy in Advanced Gastric Cancer

Minae An et al. Cancer Discov. .

Abstract

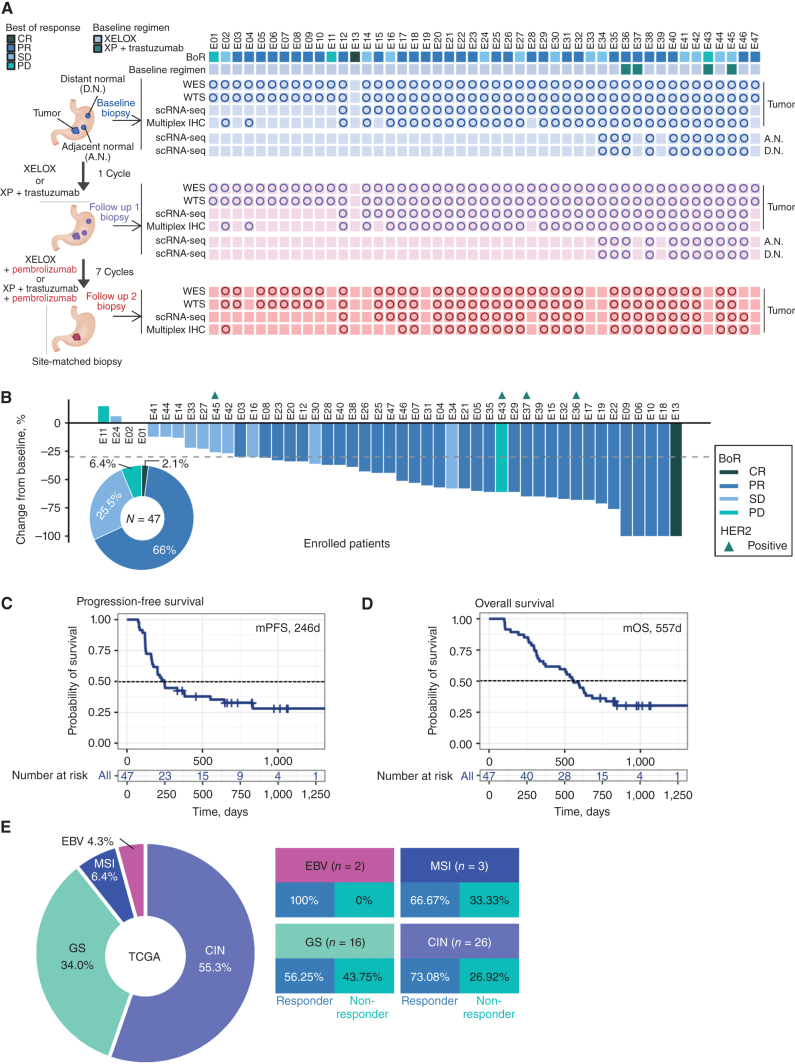
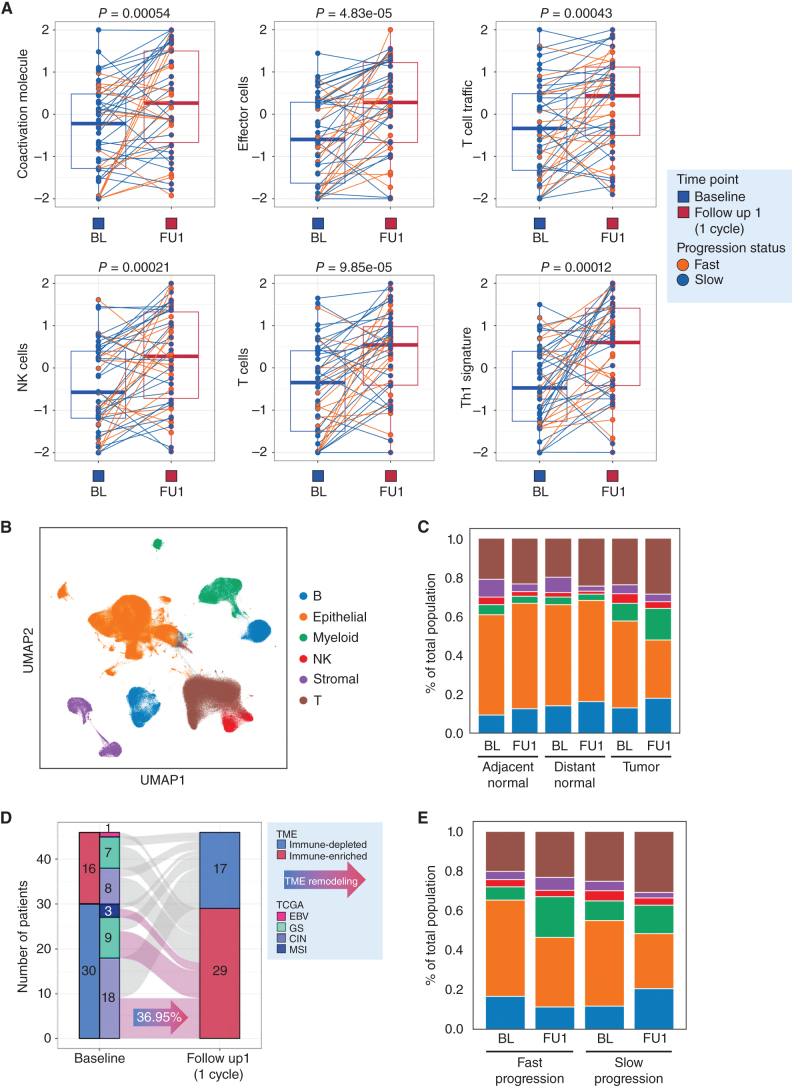
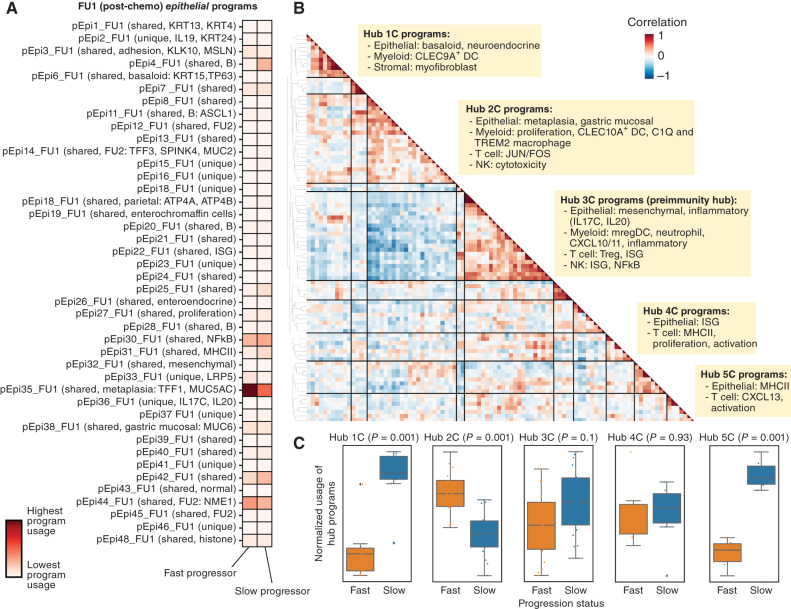
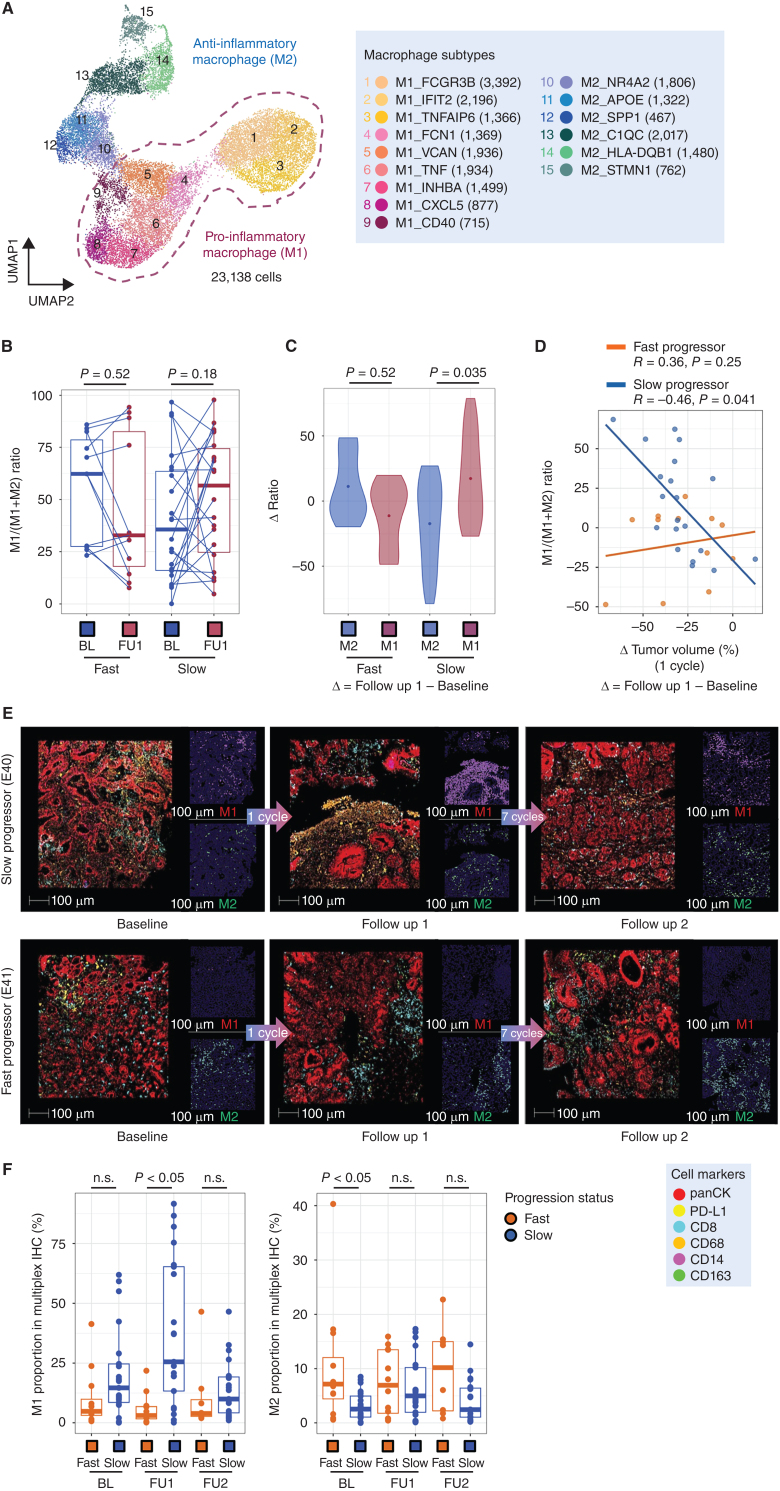
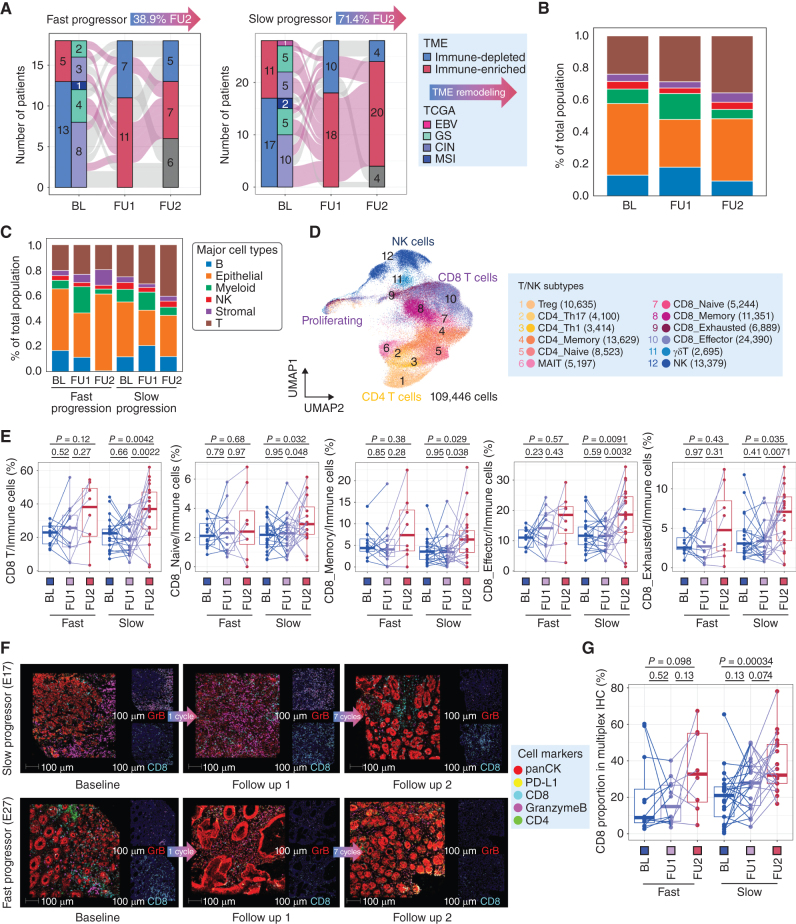
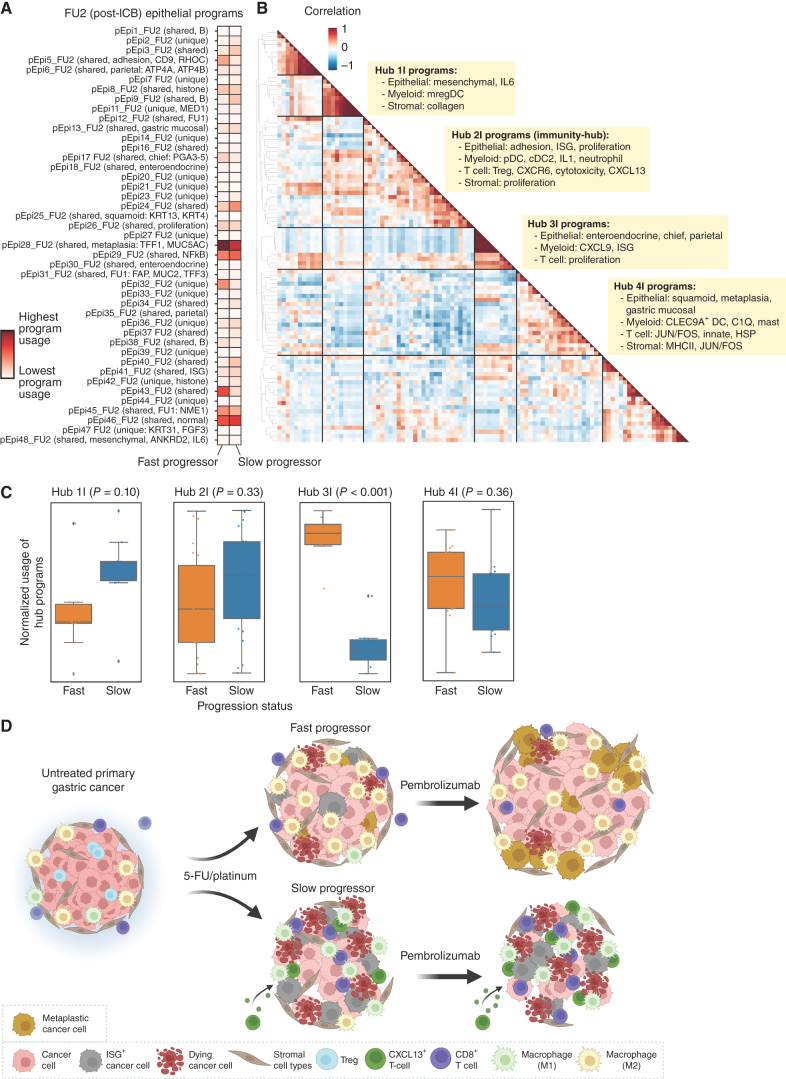
Adding anti-programmed cell death protein 1 (anti-PD-1) to 5-fluorouracil (5-FU)/platinum improves survival in some advanced gastroesophageal adenocarcinomas (GEA). To understand the effects of chemotherapy and immunotherapy, we conducted a phase II first-line trial (n = 47) sequentially adding pembrolizumab to 5-FU/platinum in advanced GEA. Using serial biopsy of the primary tumor at baseline, after one cycle of 5-FU/platinum, and after the addition of pembrolizumab, we transcriptionally profiled 358,067 single cells to identify evolving multicellular tumor microenvironment (TME) networks. Chemotherapy induced early on-treatment multicellular hubs with tumor-reactive T-cell and M1-like macrophage interactions in slow progressors. Faster progression featured increased MUC5A and MSLN containing treatment resistance programs in tumor cells and M2-like macrophages with immunosuppressive stromal interactions. After pembrolizumab, we observed increased CD8 T-cell infiltration and development of an immunity hub involving tumor-reactive CXCL13 T-cell program and epithelial interferon-stimulated gene programs. Strategies to drive increases in antitumor immune hub formation could expand the portion of patients benefiting from anti-PD-1 approaches.

Significance: The benefit of 5-FU/platinum with anti-PD-1 in first-line advanced gastric cancer is limited to patient subgroups. Using a trial with sequential anti-PD-1, we show coordinated induction of multicellular TME hubs informs the ability of anti-PD-1 to potentiate T cell-driven responses. Differential TME hub development highlights features that underlie clinical outcomes. This article is featured in Selected Articles from This Issue, p. 695.


Figures

Figure 1. Phase II trial results and sample collection schema. A, Sample collection schedule and analysis platforms in a phase II sequential chemoimmunotherapy trial. Circles correspond to samples included in analyses. B, Waterfall plot demonstrating RECISTv1.1 response for patients in the trial. C, Clinical trial patient composition and response rates by TCGA molecular subgroup. D, Kaplan–Meier curve showing progression-free survival (PFS) by fast and slow progressor categorization. Statistical comparison performed using a log-rank test. E, Kaplan–Meier curve showing overall survival (OS) by fast and slow progressor categorization. Statistical comparison performed using a log-rank test.
Figure 1.
Phase II trial results and sample collection schema. A, Sample collection schedule and analysis platforms in a phase II sequential chemoimmunotherapy trial. Circles correspond to samples included in analyses. B, Waterfall plot demonstrating RECISTv1.1 response for patients in the trial. C, Clinical trial patient composition and response rates by TCGA molecular subgroup. D, Kaplan–Meier curve showing progression-free survival (PFS) by fast and slow progressor categorization. Statistical comparison performed using a log-rank test. E, Kaplan–Meier curve showing overall survival (OS) by fast and slow progressor categorization. Statistical comparison performed using a log-rank test.
Figure 2. A single cycle of 5-FU/platinum remodels the TME in advanced gastric cancer. A, Changes in enrichment in bulk RNA-seq data of immune-related pathways from baseline (Base) to FU1. Statistical comparison performed using a Wilcoxon signed-rank test. B, UMAP embedding of single-cell transcriptomes obtained from all samples in this trial. Labeled are canonical cell types. C, Cell-type proportions, obtained from scRNAseq data, in adjacent normal, distance normal and tumor tissue, at baseline (BL) and after 1 cycle of chemotherapy (FU1). D, Redistribution of TME subtypes following one cycle of 5FU/platinum chemotherapy. TME subtypes were obtained using a classification performed on bulk RNA-seq data. E, Cell type proportions, obtained from scRNAseq data, in tumor samples of fast and slow progressing patients at BL and FU1.
Figure 2.
A single cycle of 5-FU/platinum remodels the TME in advanced gastric cancer. A, Changes in enrichment in bulk RNA-seq data of immune-related pathways from baseline (Base) to FU1. Statistical comparison performed using a Wilcoxon signed-rank test. B, UMAP embedding of single-cell transcriptomes obtained from all samples in this trial. Labeled are canonical cell types. C, Cell-type proportions, obtained from scRNAseq data, in adjacent normal, distance normal and tumor tissue, at baseline (BL) and after 1 cycle of chemotherapy (FU1). D, Redistribution of TME subtypes following one cycle of 5FU/platinum chemotherapy. TME subtypes were obtained using a classification performed on bulk RNA-seq data. E, Cell type proportions, obtained from scRNAseq data, in tumor samples of fast and slow progressing patients at BL and FU1.
Figure 3. Identification of covarying gene programs that underlie chemotherapy resistance and response. A, cNMF was performed on epithelial cells at FU1. Shown is the mean usage of each cNMF gene program in the epithelial cells of fast and slow progressing patients. B, Heat map showing pairwise correlation of gene program activities across all patient samples at FU1 using the 90th percentile of patient-level program activity in epithelial, myeloid, T, NK, and stromal cells. Hierarchical clustering was performed to identify clusters of covarying proteins, which have been labeled as Hub1C to 5C. C, Average z-scored usage of all gene programs in each hub split by fast and slow progressing patients. Statistical comparison performed using a two-sample t test with Bonferroni correction.
Figure 3.
Identification of covarying gene programs that underlie chemotherapy resistance and response. A, cNMF was performed on epithelial cells at FU1. Shown is the mean usage of each cNMF gene program in the epithelial cells of fast and slow progressing patients. B, Heat map showing pairwise correlation of gene program activities across all patient samples at FU1 using the 90th percentile of patient-level program activity in epithelial, myeloid, T, NK, and stromal cells. Hierarchical clustering was performed to identify clusters of covarying proteins, which have been labeled as Hub1C to 5C. C, Average z-scored usage of all gene programs in each hub split by fast and slow progressing patients. Statistical comparison performed using a two-sample t test with Bonferroni correction.
Figure 4. Chemotherapy leads to macrophage repolarization in patients with favorable responses. A, UMAP embedding of single-cell transcriptomes of all macrophages from all samples in this trial. Labeled are granular macrophage subtypes, including designation of M1 and M2 subtypes. B, Relative proportion of M1 macrophages of all macrophages, obtained from scRNAseq data, at BL and FU1 in fast and slow progressing patients. Statistical comparison performed using a Wilcoxon signed-rank test. C, Change in M1 and M2 macrophage proportions from BL to FU1, obtained from scRNAseq data, in fast and slow progressing patients. Statistical comparison performed using a Wilcoxon signed-rank test. D, Change in relative M1 proportion from BL to FU1 plotted against change in tumor volume after 1 cycle of chemotherapy, segregated by fast and slow progressing patients. E, Multiplexed immunofluorescence (mIF) images of BL, FU1 and FU2 samples from two patients, E40 (slow progressor) and E41 (fast progressor), staining for panCK, PD-L1, CD163, CD68, CD14 and CD8. F, Proportion of M1 macrophages, obtained from mIF images, at BL and FU1 in fast versus slow progressing patients. Statistical comparison performed using a Wilcoxon signed-rank test.
Figure 4.
Chemotherapy leads to macrophage repolarization in patients with favorable responses. A, UMAP embedding of single-cell transcriptomes of all macrophages from all samples in this trial. Labeled are granular macrophage subtypes, including designation of M1 and M2 subtypes. B, Relative proportion of M1 macrophages of all macrophages, obtained from scRNAseq data, at BL and FU1 in fast and slow progressing patients. Statistical comparison performed using a Wilcoxon signed-rank test. C, Change in M1 and M2 macrophage proportions from BL to FU1, obtained from scRNAseq data, in fast and slow progressing patients. Statistical comparison performed using a Wilcoxon signed-rank test. D, Change in relative M1 proportion from BL to FU1 plotted against change in tumor volume after 1 cycle of chemotherapy, segregated by fast and slow progressing patients. E, Multiplexed immunofluorescence (mIF) images of BL, FU1 and FU2 samples from two patients, E40 (slow progressor) and E41 (fast progressor), staining for panCK, PD-L1, CD163, CD68, CD14 and CD8. F, Proportion of M1 macrophages, obtained from mIF images, at BL and FU1 in fast versus slow progressing patients. Statistical comparison performed using a Wilcoxon signed-rank test.
Figure 5. The addition of immunotherapy to 5-FU/platinum chemotherapy redistributes T-cell phenotypes. A, Remodeling of TME from immune depleted to immune-enriched environments derived from bulk RNA-seq profiles in fast and slow progressing patients, shown across timepoints. B, Cell type proportions, obtained from scRNAseq data, of all tumor samples at BL, FU1 and after immunotherapy treatment (FU2). C, Cell type proportions, obtained from scRNAseq data, in tumor samples of fast and slow progressing patients at BL, FU1, and FU2. D, UMAP embedding of single-cell transcriptomes of all T and NK cells from all samples in this trial. Labeled are granular T- and NK-cell subtypes. E, Cell type proportions as a proportion of all immune cells, obtained from scRNAseq data, of total, naïve, memory, effector, and exhausted CD8 T cells. Statistical comparisons performed using a Wilcoxon signed-rank test. F, Multiplexed immunofluorescence (mIF) images of BL, FU1 and FU2 samples from two patients, E17 (slow progressor) and E27 (fast progressor), staining for panCK, PD-L1, CD4, CD8, and Granzyme B. G, Proportion of CD8 T cells macrophages, obtained from mIF images, at BL, FU1 and FU2 in fast versus slow progressing patients. Statistical comparison performed using a Wilcoxon signed-rank test.
Figure 5.
The addition of immunotherapy to 5-FU/platinum chemotherapy redistributes T-cell phenotypes. A, Remodeling of TME from immune depleted to immune-enriched environments derived from bulk RNA-seq profiles in fast and slow progressing patients, shown across timepoints. B, Cell type proportions, obtained from scRNAseq data, of all tumor samples at BL, FU1 and after immunotherapy treatment (FU2). C, Cell type proportions, obtained from scRNAseq data, in tumor samples of fast and slow progressing patients at BL, FU1, and FU2. D, UMAP embedding of single-cell transcriptomes of all T and NK cells from all samples in this trial. Labeled are granular T- and NK-cell subtypes. E, Cell type proportions as a proportion of all immune cells, obtained from scRNAseq data, of total, naïve, memory, effector, and exhausted CD8 T cells. Statistical comparisons performed using a Wilcoxon signed-rank test. F, Multiplexed immunofluorescence (mIF) images of BL, FU1 and FU2 samples from two patients, E17 (slow progressor) and E27 (fast progressor), staining for panCK, PD-L1, CD4, CD8, and Granzyme B. G, Proportion of CD8 T cells macrophages, obtained from mIF images, at BL, FU1 and FU2 in fast versus slow progressing patients. Statistical comparison performed using a Wilcoxon signed-rank test.
Figure 6. Multicellular hubs underlie chemoimmunotherapy resistance and response. A, cNMF was performed on epithelial cells at FU2. Shown is the mean usage of each cNMF gene program in the epithelial cells of fast and slow progressing patients. B, Heat map showing pairwise correlation of gene program activities across all patient samples at FU2 using the 90th percentile of patient-level program activity in epithelial, myeloid, T, NK, and stromal cells. Hierarchical clustering was performed to identify clusters of covarying proteins, which have been labeled as Hub1C to 5C. C, Average z-scored usage of all gene programs in each hub split by fast and slow progressing patients. Statistical comparison performed using a two-sample t test with Bonferroni correction. D, Summary schematic of proposed changes to the TME after 1 cycle of chemotherapy and chemoimmunotherapy in fast versus slow progressing patients; in particular, fast progressing patients have induction of metaplasia programs and increased abundance of suppressive M2 macrophages. Slow progressing patients have increased infiltration of CXCL13+ CD8 T cells after chemotherapy, and increased tumor-intrinsic ISG induction and inflammatory M1 macrophage subsets.
Figure 6.
Multicellular hubs underlie chemoimmunotherapy resistance and response. A, cNMF was performed on epithelial cells at FU2. Shown is the mean usage of each cNMF gene program in the epithelial cells of fast and slow progressing patients. B, Heat map showing pairwise correlation of gene program activities across all patient samples at FU2 using the 90th percentile of patient-level program activity in epithelial, myeloid, T, NK, and stromal cells. Hierarchical clustering was performed to identify clusters of covarying proteins, which have been labeled as Hub1C to 5C. C, Average z-scored usage of all gene programs in each hub split by fast and slow progressing patients. Statistical comparison performed using a two-sample t test with Bonferroni correction. D, Summary schematic of proposed changes to the TME after 1 cycle of chemotherapy and chemoimmunotherapy in fast versus slow progressing patients; in particular, fast progressing patients have induction of metaplasia programs and increased abundance of suppressive M2 macrophages. Slow progressing patients have increased infiltration of CXCL13+ CD8 T cells after chemotherapy, and increased tumor-intrinsic ISG induction and inflammatory M1 macrophage subsets.

References

    1. Yoon HH, Jin Z, Kour O, Kankeu Fonkoua LA, Shitara K, Gibson MK, et al. . Association of PD-L1 expression and other variables with benefit from immune checkpoint inhibition in advanced gastroesophageal cancer: systematic review and meta-analysis of 17 phase 3 randomized clinical trials. JAMA Oncol 2022;8:1456–65. - PMC - PubMed
    1. Shitara K, Ajani JA, Moehler M, Garrido M, Gallardo C, Shen L, et al. . Nivolumab plus chemotherapy or ipilimumab in gastro-oesophageal cancer. Nature 2022;603:942–8. - PMC - PubMed
    1. Kim R, An M, Lee H, Mehta A, Heo YJ, Kim K-M, et al. . Early tumor-immune microenvironmental remodeling and response to first-line fluoropyrimidine and platinum chemotherapy in advanced gastric cancer. Cancer Discov 2022;12:984–1001. - PMC - PubMed
    1. Tang X, Li M, Wu X, Guo T, Zhang L, Tang L, et al. . Neoadjuvant PD-1 blockade plus chemotherapy induces a high pathological complete response rate and anti-tumor immune subsets in clinical stage III gastric cancer. Oncoimmunology 2022;11:2135819. - PMC - PubMed
    1. Xing X, Shi J, Jia Y, Dou Y, Li Z, Dong B, et al. . Effect of neoadjuvant chemotherapy on the immune microenvironment in gastric cancer as determined by multiplex immunofluorescence and T cell receptor repertoire analysis. J Immunother Cancer 2022;10:e003984. - PMC - PubMed

Publication types

MeSH terms