. 2024 Feb 6;147(1):32.
doi: 10.1007/s00401-023-02679-6.

Transmembrane protein 97 is a potential synaptic amyloid beta receptor in human Alzheimer's disease

Affiliations

Transmembrane protein 97 is a potential synaptic amyloid beta receptor in human Alzheimer's disease

Martí Colom-Cadena et al. Acta Neuropathol. .

Abstract

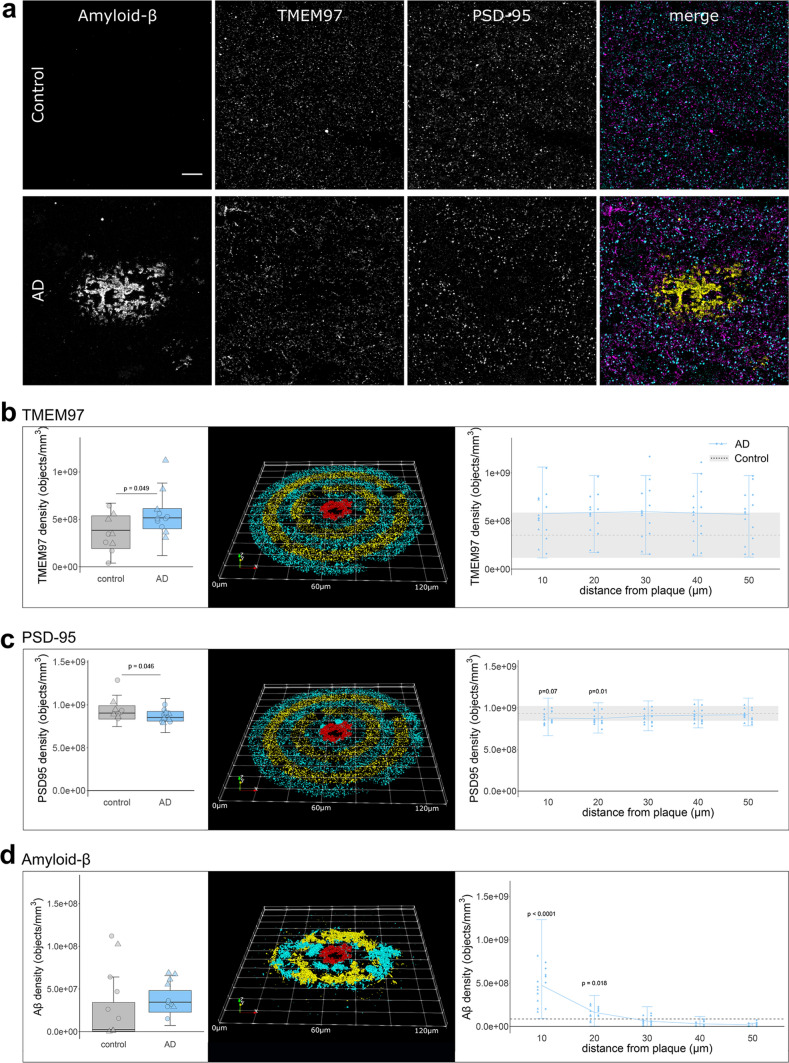
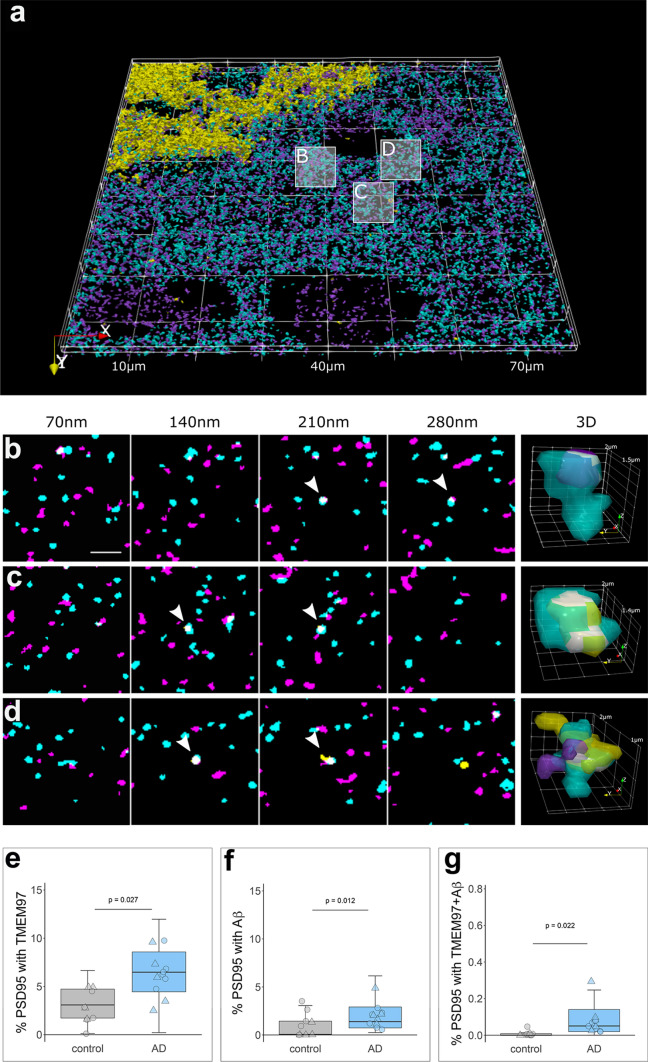
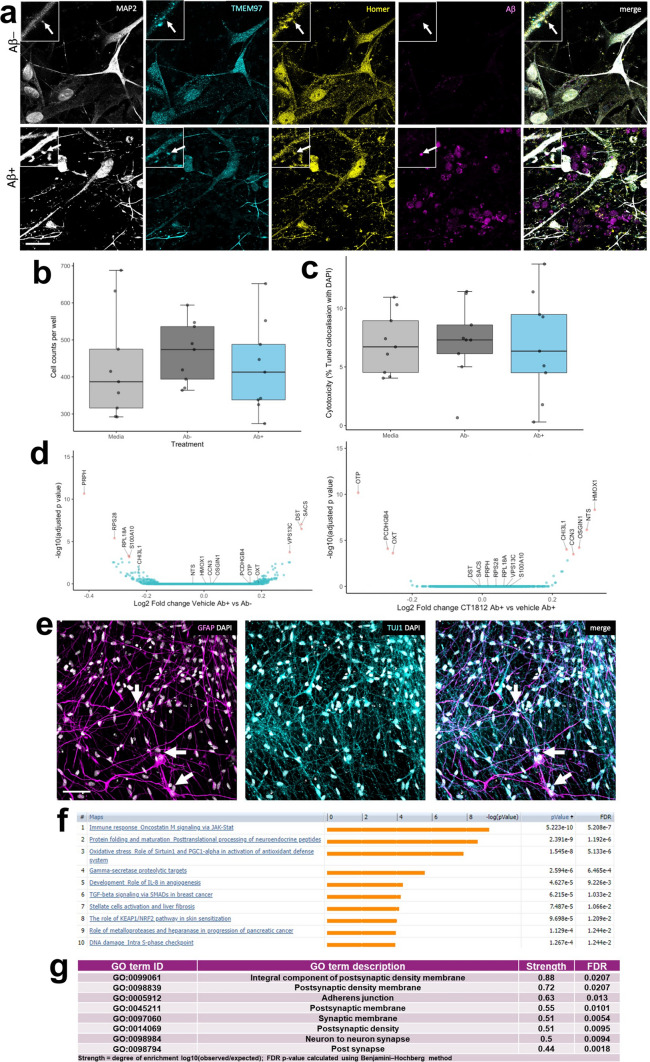
Synapse loss correlates with cognitive decline in Alzheimer's disease, and soluble oligomeric amyloid beta (Aβ) is implicated in synaptic dysfunction and loss. An important knowledge gap is the lack of understanding of how Aβ leads to synapse degeneration. In particular, there has been difficulty in determining whether there is a synaptic receptor that binds Aβ and mediates toxicity. While many candidates have been observed in model systems, their relevance to human AD brain remains unknown. This is in part due to methodological limitations preventing visualization of Aβ binding at individual synapses. To overcome this limitation, we combined two high resolution microscopy techniques: array tomography and Förster resonance energy transfer (FRET) to image over 1 million individual synaptic terminals in temporal cortex from AD (n = 11) and control cases (n = 9). Within presynapses and post-synaptic densities, oligomeric Aβ generates a FRET signal with transmembrane protein 97. Further, Aβ generates a FRET signal with cellular prion protein, and post-synaptic density 95 within post synapses. Transmembrane protein 97 is also present in a higher proportion of post synapses in Alzheimer's brain compared to controls. We inhibited Aβ/transmembrane protein 97 interaction in a mouse model of amyloidopathy by treating with the allosteric modulator CT1812. CT1812 drug concentration correlated negatively with synaptic FRET signal between transmembrane protein 97 and Aβ. In human-induced pluripotent stem cell derived neurons, transmembrane protein 97 is present in synapses and colocalizes with Aβ when neurons are challenged with human Alzheimer's brain homogenate. Transcriptional changes are induced by Aβ including changes in genes involved in neurodegeneration and neuroinflammation. CT1812 treatment of these neurons caused changes in gene sets involved in synaptic function. These data support a role for transmembrane protein 97 in the synaptic binding of Aβ in human Alzheimer's disease brain where it may mediate synaptotoxicity.

Keywords: Alzheimer’s disease; Aβ; Cellular prion protein; Sigma-2; Synapses; TMEM97.


Conflict of interest statement

TSJ is a member of the Scientific Advisory Board of Cognition Therapeutics and Scottish Brain Sciences. NI, LW, and SC were employees of Cognition Therapeutics, and MEH and AOC are current employees of Cognition Therapeutics.

Figures

Fig. 1
Fig. 1
Immunoreactivity pattern and density of TMEM97, Aβ and PSD95. a representative maximum intensity projection images of ten consecutive 70 nm-thick sections from a control and an Alzheimer’s case. Immunoreactivity against Aβ (6E10, yellow), TMEM97 (magenta) and PSD95 (cyan) is shown. Overall density (left) or the density in relation to Aβ plaque cores (right) of TMEM97 (b), PSD95 (c) and Aβ (d) is plotted. The 3D reconstructions were made from 19 consecutive sections of a representative Alzheimer’s case. The Aβ core is shown in red and the objects distributed every 10um bins are coloured. Scale bar represents 10 µm. Boxplots show quartiles and medians calculated from all image stacks in the study. Data points show case means (females, triangles; males, circles). p values on left panels show significant effect of disease (ANOVA after linear mixed effects model). On right panels, p values show Tukey corrected post-hoc significant differences between 50 μm and the indicated plaque distance in the AD data. In D, note the scales are different in the two plots as there is an order of magnitude more Aβ near plaques than when averaged across all images
Fig. 2
Fig. 2
TMEM97 is found at higher levels in Alzheimer’s synaptic terminals compared to healthy controls. 3D reconstructions were made from 20 consecutive 70 nm-thick sections from a representative Alzheimer’s case stained for Aβ (6E10, yellow), TMEM97 (magenta) and PSD95 (cyan). In the top 3D reconstruction (a), three white boxes label the magnified regions that highlight: a PSD95 terminal with TMEM97 (b), a post-synaptic terminal with Aβ (c) and a PSD95 synaptic terminal with both Aβ and TMEM97 (d). In magnified images (bd), four consecutive sections from the image stack are shown (each 70 nm apart). White arrowheads indicate synaptic localization and a 3D reconstruction (right panel) of the pointed synapse where colocalization is observed (white). Box plots show the percent of post-synaptic terminals that contained TMEM97 (E), Aβ (F), or both (G), in Alzheimer’s and control cases. Boxplots show quartiles and medians calculated from each image stack. Each data points refers to the means of a single human tissue donor (females, triangles; males, circles). p values show ANOVA after linear mixed effects models. Scale bar: 2 µm
Fig. 3
Fig. 3
Aβ and TMEM97 are close enough at the Alzheimer’s synapses to generate a FRET effect. Pixels where pairs of interest were colocalized within synaptic puncta were analysed to determine whether they generate a FRET signal. The percent of synaptic pixels where FRET signal was detected by each protein pair are plotted (a). The green bar in the boxplot shows the window of detecting FRET signal defined by the positive control signal where an acceptor fluorophore was applied to the same protein as the donor fluorophore using a tertiary antibody (top) and negative controls where no acceptor fluorophore was present (bottom). Boxplots show quartiles and medians calculated from each image stack. Data points show case means (females, triangles; males, circles). p values show post-hoc Tukey corrected differences between the pair indicated and the biological negative control of PSD-synaptophysin FRET. Images in panel b show a maximum projection of five consecutive sections showing a 100 × 100 μm overview of the donor channel (yellow) acceptor channel (magenta) and the synaptic channel segmented in three dimensions used as region of interest for FRET (cyan) for each FRET pair used in the study. Panel c shows 5 × 5 μm regions containing examples of donor and acceptor staining in synaptic masks and the generated FRET signal in a single section with intensity represented by colour as in colour scale. Scale bars: 20 µm in b, 1 µm in c
Fig. 4
Fig. 4
Effect of TMEM97 modulator on synaptic Aβ and TMEM97 in the APP/PS1 + Tau mouse model. Representative images of immunoreactivity patterns found in vehicle or CT1812 treated mice are shown in a. Images show maximum intensity projections of 16 consecutive 70nm-thick sections of cases stained for Aβ (yellow), TMEM97 (magenta) and PSD95 (cyan). b, the estimated percent of receptor occupancy by the drug in the CT1812-treated group. c, quantification of overall densities of the three studied proteins. d, the percent of synaptic pixels that contain both Aβ and TMEM97, and FRET signal. e, the post-synaptic terminals localisation of Aβ, TMEM97, or both. f, Correlations were estimated between measured parameters and a correlation matrix of the assessed variables is shown (left panel) in which the colour and size reflect the rho (scale below the plot) and the statistically significant correlations are highlighted with a shaded square. The correlation between percent estimated receptor occupancy and percent of synaptic FRET signal (right panel) displaying the regression line (red), the 95% confidence interval (green) and the Spearman correlation results (rho, p value). Scale bar: 10µm. Boxplots show quartiles and medians calculated from each image stack. Data points refer to case means (females, triangles; males, circles). Analysis with linear mixed effects models including treatment group and sex interaction
Fig. 5
Fig. 5
Challenge of human iPSC neurons with Alzheimer’s brain homogenate. (a) Immunocytochemistry for dendrites (MAP2, grey), TMEM97 (cyan), post synapses (homer, yellow), and Aβ (6E10, magenta) reveals that Aβ accumulates in TMEM97-containing post synapses in iPSC-derived human neurons challenged with Alzheimer’s brain homogenate when the homogenate was mock immunodepleted (Ab +), but not when it was immunodepleted for Aβ (Ab−). DAPI positive cell counts (b) and a TUNEL cytotoxicity assay (c) show that brain homogenate treatments do not induce cell death. RNA sequencing reveals seven significantly differentially expressed genes between Ab + and Ab− homogenate treatment (d, differentially expressed genes with adjusted p value < 0.05 shown in pink in volcano plot). When comparing Aβ challenged cultures treated with CT1812 and vehicle, eight genes are differentially expressed (volcano plot in e differentially expressed genes with adjusted p value < 0.05 shown in pink). Staining for astrocytes (GFAP, magenta), neurons (TUJ1, cyan) and nuclei (DAPI, white) reveals that a small proportion of cells in our cultures are astrocytes (arrows) which extend many processes (f). Pathway analysis using MetaCore (unadjusted p value < 0.05) shows enrichment of immune/inflammatory pathways with Aβ treatment compared to immunodepleted Aβ treatment (g). Using STRING protein interaction analysis of Aβ + Drug vs. Aβ + Vehicle conditions (unadjusted p value < 0.05), the top GO Components (sorted by strength) were involved in synaptic biology (top 8 shown, h). Scale bar in panel a 20 μm, insets 10 × 10 μm, Scale bar in panel e 50 μm
Fig. 6
Fig. 6
Model of post-synaptic interactions of Aβ. Based on our study, we observe that Aβ is in close proximity to TMEM97, PSD95, and PrPc. Also, TMEM97-PGRMC1 and TMEM97-PrPc were found close enough to generate FRET signals. There was no FRET signal generated between PGRMC1 and PSD95 nor between PSD95 and synaptophysin which should not be in close enough proximity to generate a signal. These data are consistent with Aβ being a binding partner of these synaptic proteins either at the synaptic membrane or potentially within the post-synapse at spine apparatus

References

    1. Abd-Elrahman KS, Albaker A, de Souza JM, Ribeiro FM, Schlossmacher MG, Tiberi M, Hamilton A, Ferguson SSG. Aβ oligomers induce pathophysiological mGluR5 signaling in Alzheimer’s disease model mice in a sex-selective manner. Sci Signal. 2020 doi: 10.1126/scisignal.abd2494. - DOI - PubMed
    1. Agostini A, Yuchun D, Li B, Kendall DA, Pardon M-C. Sex-specific hippocampal metabolic signatures at the onset of systemic inflammation with lipopolysaccharide in the APPswe/PS1dE9 mouse model of Alzheimer’s disease. Brain Behav Immun. 2020;83:87–111. doi: 10.1016/j.bbi.2019.09.019. - DOI - PMC - PubMed
    1. Alon A, Schmidt HR, Wood MD, Sahn JJ, Martin SF, Kruse AC. Identification of the gene that codes for the σ2 receptor. Proc Natl Acad Sci USA. 2017;114:7160–7165. doi: 10.1073/pnas.1705154114. - DOI - PMC - PubMed
    1. Bartz F, Kern L, Erz D, Zhu M, Gilbert D, Meinhof T, Wirkner U, Erfle H, Muckenthaler M, Pepperkok R, Runz H. Identification of cholesterol-regulating genes by targeted RNAi screening. Cell Metab. 2009;10:63–75. doi: 10.1016/j.cmet.2009.05.009. - DOI - PubMed
    1. Benilova I, De Strooper B. Promiscuous Alzheimer’s amyloid: yet another partner. Science. 2013;341:1354–1355. doi: 10.1126/science.1244166. - DOI - PubMed

Publication types