. 2024 Feb 6;134(6):e170329.
doi: 10.1172/JCI170329.

PI3K/mTOR is a therapeutically targetable genetic dependency in diffuse intrinsic pontine glioma

Ryan J Duchatel  1   2   3 Evangeline R Jackson  1   2   3 Sarah G Parackal  4   5 Dylan Kiltschewskij  2   6 Izac J Findlay  1   2   3 Abdul Mannan  1   2 Dilana E Staudt  1   2   3 Bryce C Thomas  1   2   3 Zacary P Germon  1   2 Sandra Laternser  7 Padraic S Kearney  1   2 M Fairuz B Jamaluddin  6 Alicia M Douglas  1   2 Tyrone Beitaki  1   2 Holly P McEwen  1   2 Mika L Persson  1   2   3 Emily A Hocke  8 Vaibhav Jain  8 Michael Aksu  8 Elizabeth E Manning  6 Heather C Murray  2   6 Nicole M Verrills  2   6 Claire Xin Sun  4   5 Paul Daniel  4   5 Ricardo E Vilain  2 David A Skerrett-Byrne  9 Brett Nixon  9 Susan Hua  2   6 Charles E de Bock  10   11 Yolanda Colino-Sanguino  10   11 Fatima Valdes-Mora  10   11 Maria Tsoli  10   11 David S Ziegler  10   11   12 Murray J Cairns  2   6 Eric H Raabe  13 Nicholas A Vitanza  14   15 Esther Hulleman  16 Timothy N Phoenix  17 Carl Koschmann  18 Frank Alvaro  1   2   19 Christopher V Dayas  6 Christopher L Tinkle  20 Helen Wheeler  21   22   23 James R Whittle  24   25   26 David D Eisenstat  27   28 Ron Firestein  4   5 Sabine Mueller  7   29 Santosh Valvi  30   31   32 Jordan R Hansford  33   34   35 David M Ashley  36 Simon G Gregory  8   36 Lindsay B Kilburn  37   38 Javad Nazarian  7   37   38 Jason E Cain  4   5 Matthew D Dun  1   2   3
Affiliations

PI3K/mTOR is a therapeutically targetable genetic dependency in diffuse intrinsic pontine glioma

Ryan J Duchatel et al. J Clin Invest. .

Abstract

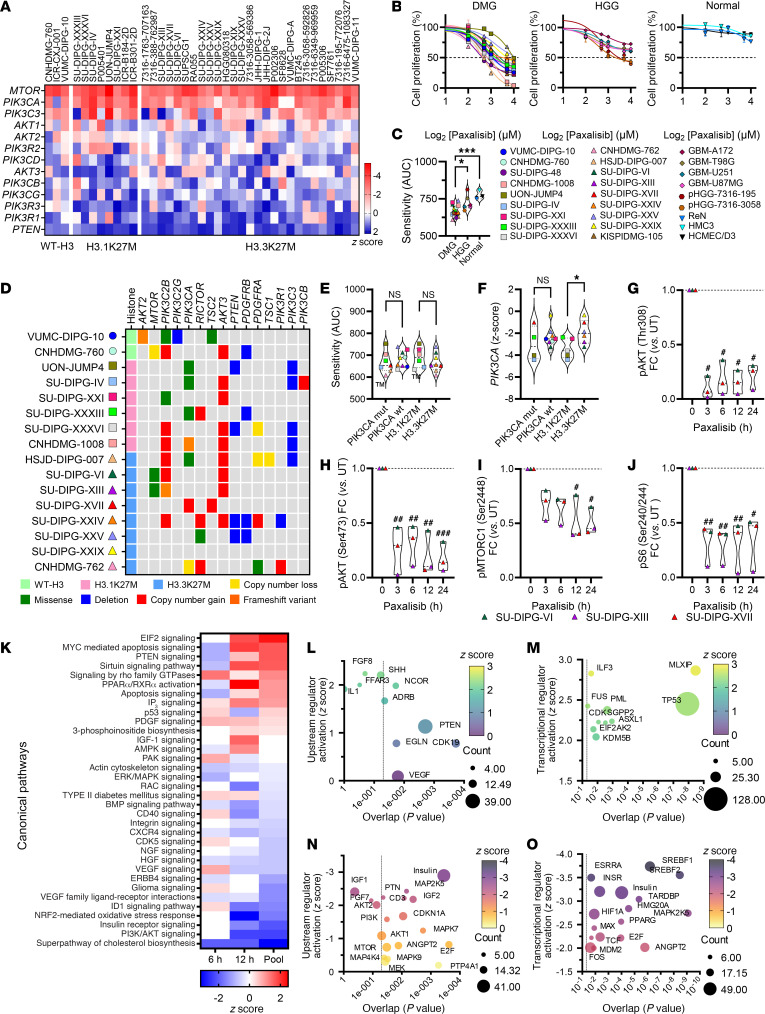
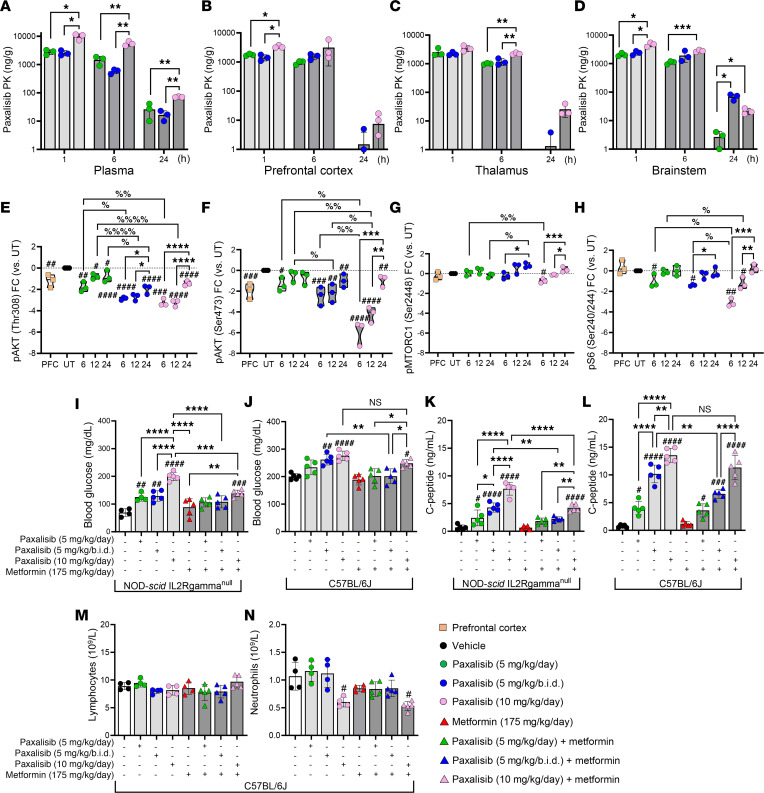
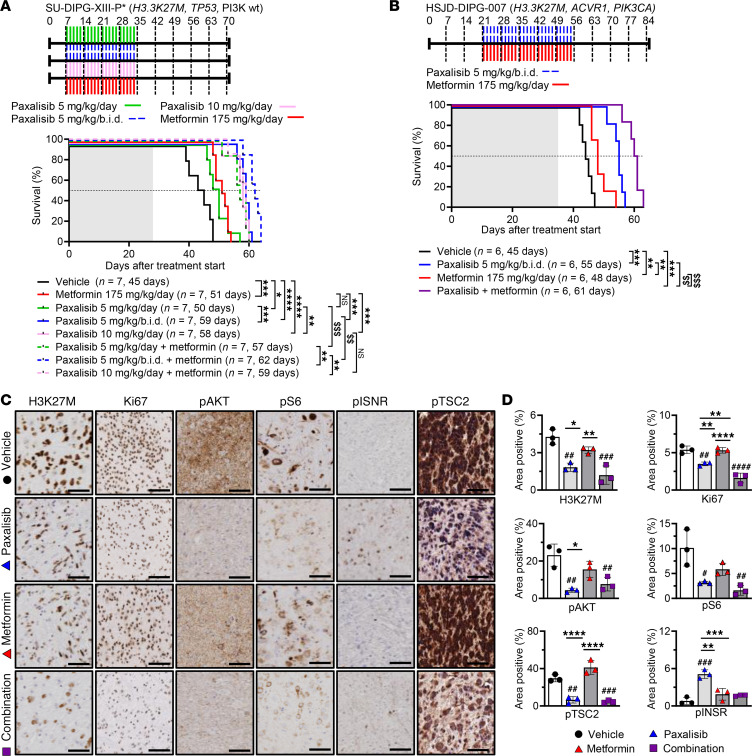
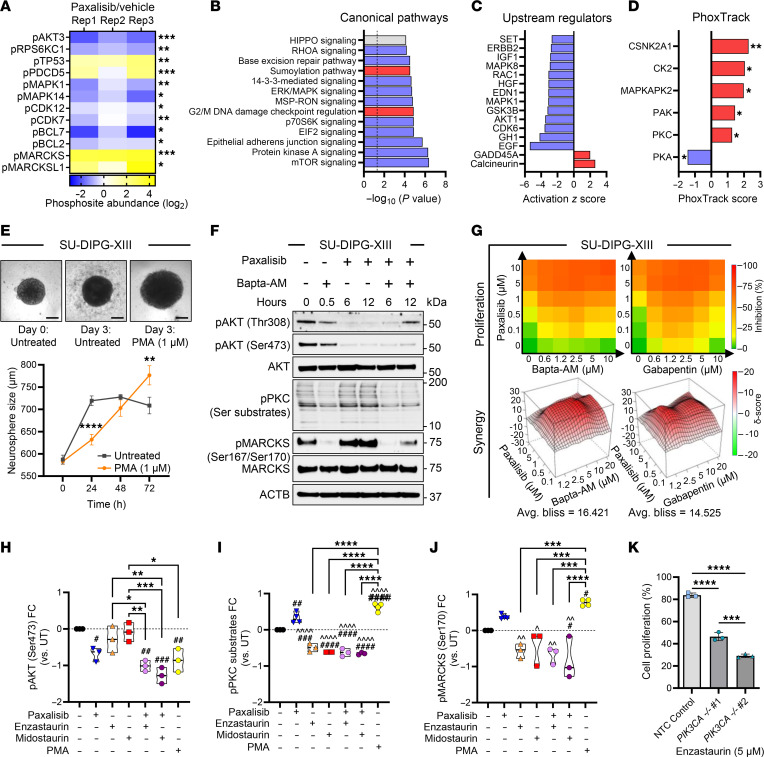
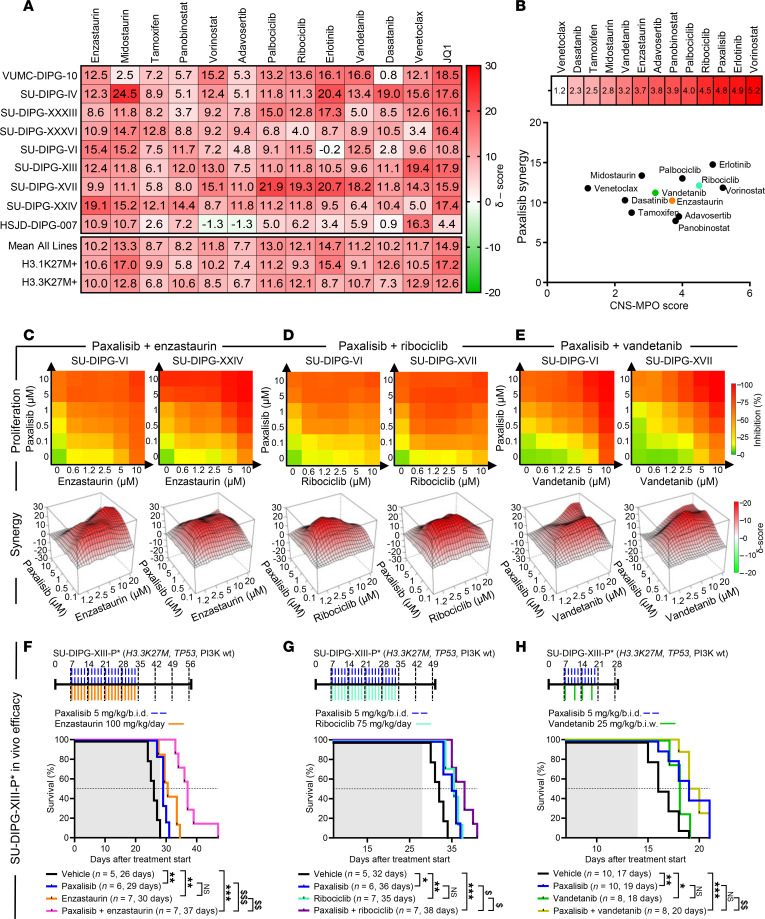
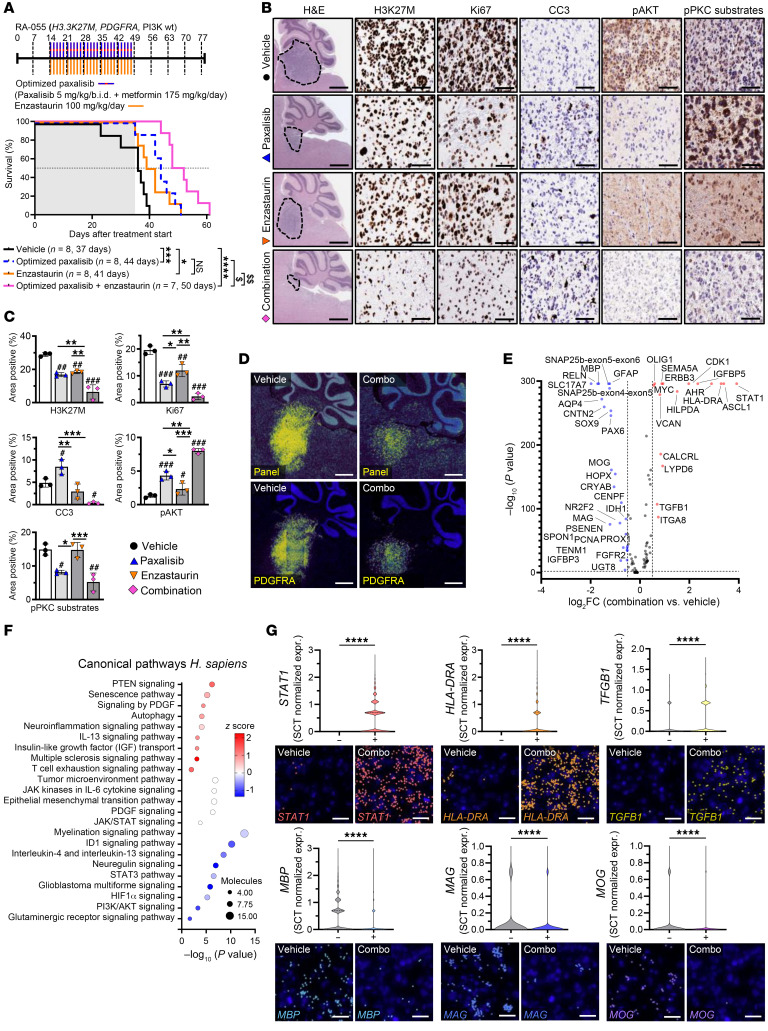
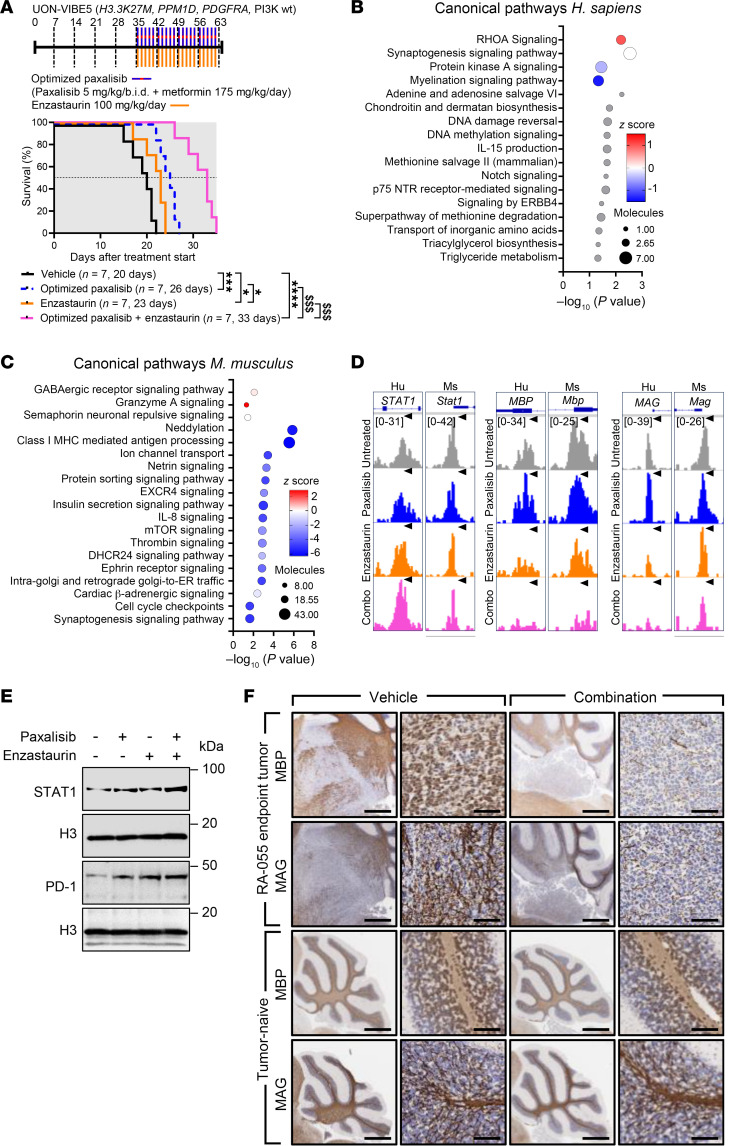
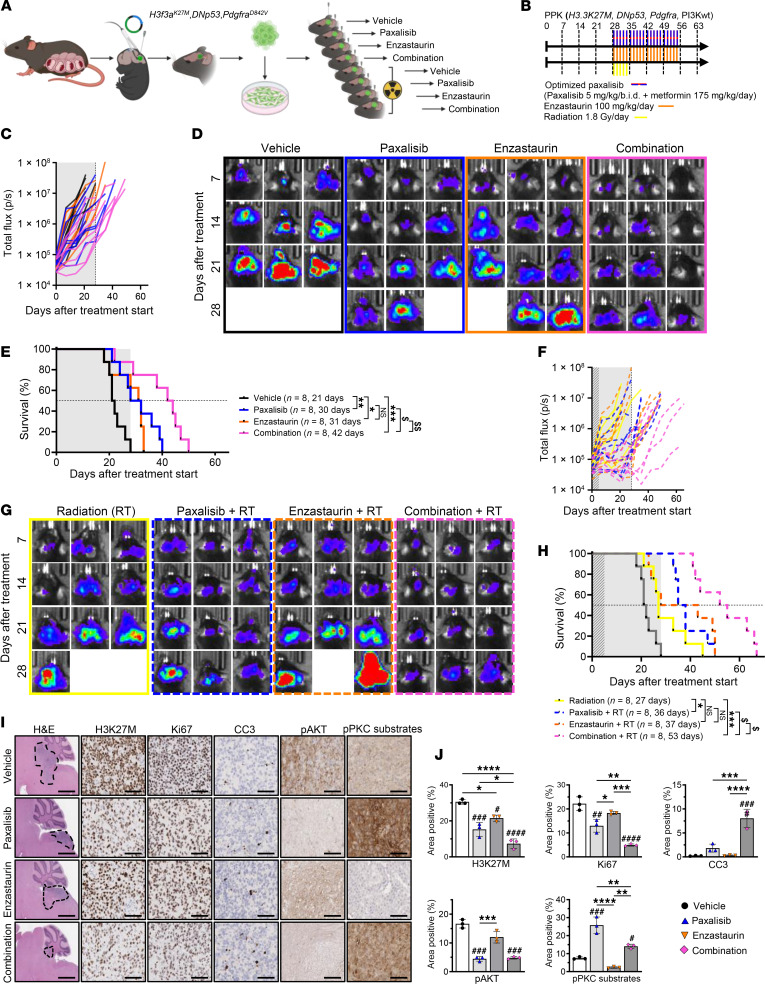
Diffuse midline glioma (DMG), including tumors diagnosed in the brainstem (diffuse intrinsic pontine glioma; DIPG), are uniformly fatal brain tumors that lack effective treatment. Analysis of CRISPR/Cas9 loss-of-function gene deletion screens identified PIK3CA and MTOR as targetable molecular dependencies across patient derived models of DIPG, highlighting the therapeutic potential of the blood-brain barrier-penetrant PI3K/Akt/mTOR inhibitor, paxalisib. At the human-equivalent maximum tolerated dose, mice treated with paxalisib experienced systemic glucose feedback and increased insulin levels commensurate with patients using PI3K inhibitors. To exploit genetic dependence and overcome resistance while maintaining compliance and therapeutic benefit, we combined paxalisib with the antihyperglycemic drug metformin. Metformin restored glucose homeostasis and decreased phosphorylation of the insulin receptor in vivo, a common mechanism of PI3K-inhibitor resistance, extending survival of orthotopic models. DIPG models treated with paxalisib increased calcium-activated PKC signaling. The brain penetrant PKC inhibitor enzastaurin, in combination with paxalisib, synergistically extended the survival of multiple orthotopic patient-derived and immunocompetent syngeneic allograft models; benefits potentiated in combination with metformin and standard-of-care radiotherapy. Therapeutic adaptation was assessed using spatial transcriptomics and ATAC-Seq, identifying changes in myelination and tumor immune microenvironment crosstalk. Collectively, this study has identified what we believe to be a clinically relevant DIPG therapeutic combinational strategy.

Keywords: Brain cancer; Drug therapy; Oncogenes; Oncology; Therapeutics.


Figures

Figure 1
Figure 1. Patient-derived DMG cell lines are sensitive to paxalisib in vitro.
(A) CRISPR/Cas9 loss-of-function screening across H3K27-altered subtypes of DMG; WT-H3 (EZHIP) (n = 3), H3.1K27M (n = 8), H3.3K27M (n = 27). (B) Sensitivity of DMG WT-H3 (circles), H3.1K27M (squares), H3.3K27M (triangles), (n = 18), GBM (diamonds) (n = 4) and HGG (hexagons) (n = 2) patient-derived cell lines and normal (upsidedown triangle) (n = 3) to 72 hours paxalisib treatment. (C) Comparison of DMG to HGG/GBM and normal cell lines (AUC) to 72 hours paxalisib treatment (DMG versus HGG/GBM, P = 0.0023 and normal P = 0.0008, 1-way ANOVA). (D) Oncoprint of aberrations (TSO500) in DIPG cell lines (n = 16). (E) Comparison of paxalisib sensitivity (AUC) mutant versus WT PIK3CA DMG cell lines and H3K27M mutation subgroups (1-way ANOVA). (F) Analysis of paxalisib sensitivity versus PIK3CA AUC z-score in PIK3CA mutant versus WT DIPG cell lines and H3K27M mutation subgroups (PIK3CA mut versus PIK3CA WT; H3.1K27M versus H3.3K27M; 1-way ANOVA, *P < 0.05). (GJ) Phosphorylation of PI3K/Akt/mTOR signaling proteins after 1 μM paxalisib treatment for 3, 6, 12, and 24 hours, SU-DIPG-VI, SU-DIPG-XIII and SU-DIPG-XVII (n = 3, 1-way ANOVA, treated versus untreated; #P < 0.05, ##P < 0.01, ###P < 0.001). Analysis of altered gene expression of SU-DIPG-VI following 6 and 12 hours 1 μM paxalisib treatment identifying (K) activated canonical pathways (red) and inactivated pathways (blue); (L) upregulated upstream regulators, and (M) transcriptional regulators; (N) decreased upstream regulators, and (O) transcriptional regulators (activation z-score, P value, size correlating to number of target molecules in data set).
Figure 2
Figure 2. Pharmacokinetics and pharmacodynamics of optimized paxalisib treatment.
(AD) Paxalisib pharmacokinetics and (EH) pharmacodynamics following modified dosing. (AD) Concentration of paxalisib in (A) plasma, (B) prefrontal cortex (PFC), (C) thalamus, and (D) brainstem, measured by multiple reaction monitoring mass spectroscopy (MRM) ± treatment with paxalisib at 5 mg/kg/day, 5 mg/kg/b.i.d., or 10 mg/kg/day and measured after 1, 6 and 24 hours (1-way ANOVA). (EH) Phosphorylation analysis using SU-DIPG-XIII-P* tumor tissue treated with 5 mg/kg/day, 5 mg/kg/b.i.d., or 10 mg/kg/day paxalisib for 2-weeks and resected 6, 12 and 24 hours after treatment (1-way ANOVA). (IJ) Blood glucose (KL) and C-peptide measurements 4 hours after treatment with 5 mg/kg/day, 5 mg/kg/b.i.d., or 10 mg/kg/day paxalisib in combination with 175 mg/kg/day metformin in immunocompromised NSG and immunocompetent C57BL/6J mice. (M and N) Lymphocyte and neutrophil counts from C57BL/6J mice 4 hours following treatment with 5 mg/kg/day, 5 mg/kg/b.i.d., 10 mg/kg/day paxalisib in combination with 175 mg/kg/day metformin (n = 3, 1-way ANOVA, treated versus untreated; #P < 0.05, ##P < 0.01, ###P < 0.001, ####P < 0.0001, intra/inter-treatment comparison */%P < 0.05, **/%%P < 0.01, ***/%%%P < 0.001, ****/%%%%P < 0.0001).
Figure 3
Figure 3. Patient-derived DIPG xenograft model efficacy using optimized paxalisib treatment.
(A) Kaplan-Meier survival analysis of SU-DIPG-XIII-P* xenografts treated with vehicle, paxalisib 5 mg/kg/day, 5 mg/kg/b.i.d., or 10 mg/kg/day or in combination with metformin 175 mg/kg/day (log-rank test). (B) HSJD-DIPG-007 xenografts treated with vehicle, paxalisib 5 mg/kg/b.i.d., metformin 175 mg/kg/day, or combined paxalisib and metformin (log-rank test). Shaded area indicates time receiving treatment. (C) Tumor tissue resected from HSJD-DIPG-007 xenografts following 4 weeks of treatment and analyzed by IHC (n = 3 mice per treatment, representative images are presented; scale bar: 50 μM) and (D) IHC quantified (n = 3, 1-way ANOVA, treated versus untreated; #P < 0.05, ##P < 0.01, ###P < 0.001, ####P < 0.0001, intra/inter-treatment comparison; *P < 0.05, **P < 0.01, ***P < 0.001, ****P < 0.0001, synergistic comparisons $$P < 0.01, $$$P < 0.001, shaded area indicates treatment time).
Figure 4
Figure 4. Phosphoproteomic analysis identified potent PKC activation following PI3K inhibition.
(A) Significantly regulated phosphoproteins following paxalisib treatment (Student’s t test; *P < 0.05, **P < 0.01, ***P < 0.001). (B) Canonical pathways and (C) upstream regulators significantly altered by paxalisib treatment determined by Ingenuity Pathway Analysis (IPA, activated pathways positive z-score (red), inactivated pathways negative z-score (blue)). (D) PhoxTrack predicted activated (red), inactivated (blue). (E) PKC activated using Phorbol-12-myristate-13-acetate (PMA) using SU-DIPG-XIII cells (scale bar: 200 μM, 2-way ANOVA, PMA versus untreated **P < 0.01, ****P < 0.0001). (F) BAPTA-AM inhibition of paxalisib-induced PKC substrates and MARCKS phosphorylation, measured by immunoblotting (n = 3, representative immunoblot presented). (G) Bliss-synergy analysis of the combination of paxalisib with BAPTA-AM and Gabapentin. (HJ) Quantification of signaling protein phosphorylation following combinations of paxalisib and PKC inhibitors after 24 hours (n = 3 biological replicates, 1-way ANOVA, treated versus untreated; #P < 0.05, ##P < 0.01, ###P < 0.001, ####P < 0.0001, intra-treatment comparison; *P < 0.05, **P < 0.01, ***P < 0.001, ****P < 0.0001, treated versus paxalisib; ^P < 0.05, ^^P < 0.01, ^^^^P < 0.0001). (K) Proliferation of SU-DIPGXXXVI following CRISPR/Cas9 knockdown of PIK3CA in cell lines compared with nontargeting control (NTC) and treated with enzastaurin for 72 hours (biological triplicate, 1-way ANOVA; ***P < 0.001, ****P < 0.0001).
Figure 5
Figure 5. High-throughput drug screen identifies synergistic paxalisib drug combinations.
(A) Bliss synergy analysis using paxalisib in combination with clinically relevant inhibitors in a panel of DIPG cells lines (n = 9), measured by resazurin cell growth and proliferation assays after 72 hours exposure (biological triplicate). (B) CNS-MPO analysis of compounds targeting pathways modulated by paxalisib treatment and plotted against paxalisib combination synergy scores. Cell proliferation and bliss synergy analysis for the combination of (C) paxalisib and enzastaurin, (D) paxalisib and ribociclib, and (E) paxalisib and vandetanib. (FH) Kaplan-Meier survival analysis of SU-DIPG-XIII-P* xenografts treated with paxalisib (5 mg/kg/b.i.d.) and (F) enzastaurin (100 mg/kg/day), (G) ribociclib (75 mg/kg/day) and (H) vandetanib (25 mg/kg/b.i.w.) (log-rank test, *P < 0.05, **P < 0.01, ***P < 0.001, ****P < 0.0001, synergistic comparisons; $P < 0.01, $$P < 0.01, $$$P < 0.001, shaded area indicates treatment time).
Figure 6
Figure 6. In vivo spatial transcriptomics identifies pathways underpinning therapeutic adaptation.
(A) Kaplan-Meier survival analysis of RA-055 xenografts treated with the optimized combination of paxalisib (5 mg/kg/b.i.d.) + metformin (175 mg/kg/day) and enzastaurin (100 mg/kg/day) (shaded area indicates treatment time, log-rank test, treated versus untreated; *P < 0.05, **P < 0.01, ***P < 0.001,****P < 0.0001, synergistic comparisons; $$P < 0.01, $$$P < 0.001). (B) Tumor tissue was resected from RA-055 xenografts following 4 weeks of treatment and analyzed by IHC (n = 3 per treatment, representative images shown, scale bar: 50 μm) and (C) images quantified using ImageJ (technical triplicate, across biological replicates, n = 3, 1-way ANOVA, treated versus untreated; *P < 0.05, **P < 0.01, ***P < 0.001, intra-treatment comparison; #P < 0.05, ##P < 0.01, ###P < 0.001). (D) Representative images of 10 × Xenium analysis using a panel of 358 genes, with tumors identified by high PDGFRA expression (scale bar: 1,000 μm). (E) Differential gene expression analysis (Wilcoxon test) on normalized count data, presented as log2FC. (F) IPA pathway analysis of significantly altered genes following treatment. (G) Significantly altered gene transcripts, STAT1, HLA-DRA, TGFB1, and MBP, MAG, MOG visualized using Xenium Explorer, with corresponding violin plots of SCTransform normalized count data (scale bar: 25 μm, 1-way ANOVA, treated versus untreated; ***P < 0.001, ****P < 0.0001).
Figure 7
Figure 7. Assessment of open chromatin DIPG models treated at advanced disease stages identifies altered tumor myelination and interactions with the tumor immune microenvironment.
(A) Kaplan-Meier survival analysis of UON-VIBE5 xenografts treated with the optimized combination of paxalisib (5 mg/kg/b.i.d.) + metformin (175 mg/kg/day), and enzastaurin (100 mg/kg/day) (shaded area indicates treatment time, log-rank test, treated versus untreated; *P < 0.05, **P < 0.01, ***P < 0.001,****P < 0.0001, synergistic comparisons; $$P < 0.01, $$$P < 0.001). IPA canonical pathway analysis of significantly altered pathways following combination treatment of (B) human and (C) mouse genes from peaks located at promoter and enhancer regions. (D) Representative tracks for selected genes of interest visualized by integrative genomics viewer, and corresponding (E) immunoblot validation. (F) IHC validation of MBP and MAG expression in RA-055-engrafted mice and tumor-naive C57BL/6J mice treated with the combination of optimized paxalisib and enzastaurin (n = 3 per treatment, representative images shown, scale bar: 50 μm).
Figure 8
Figure 8. Combining paxalisib and enzastaurin with RT using an immunocompetent syngeneic DIPG mouse model.
(A) In utero electroporation syngeneic allograft model of DIPG serially transplanted into C57BL/6J mice, (B) treated with optimized paxalisib (5 mg/kg/b.i.d. paxalisib + 175 mg/kg/day metformin) and enzastaurin (100mg/kg/day), alone and in combination with RT (1.8 Gy/day), for 4 weeks. (C) Monitoring of tumor burden using BLI over time (representative BLI images presented, shaded area indicates treatment time), (D) of mice treated with optimized paxalisib, enzastaurin, or the combination without RT. (E) Kaplan Meier survival analysis of mice treated with optimized paxalisib, enzastaurin, or the combination (shaded area indicates treatment time, log-rank test, treated versus untreated; *P < 0.05, ***P < 0.001, ****P < 0.0001, synergistic comparisons; $P < 0.01, $$P < 0.01). (F) Monitoring of tumor burden using BLI over time (representative images presented) (G) of mice treated with optimized paxalisib, enzastaurin ± RT. (H) Kaplan Meier survival analysis of mice treated with optimized paxalisib, enzastaurin, or the combination, with upfront RT (shaded area indicates treatment time, log-rank test, *P < 0.05, ***P < 0.001, ****P < 0.0001, synergistic comparisons; $P < 0.01, $$P < 0.01). Vehicle Kaplan-Meier curve is duplicated from (E) for visual reference. (I) IHC analysis of tumors resected 2 weeks after treatment and (J) quantified using ImageJ (measured in technical triplicate, across biological replicates, n = 3, 1-way ANOVA, *P < 0.05, **P < 0.01, ***P < 0.001, treated versus untreated; #P < 0.05, ##P < 0.01, ###P < 0.001, ####P < 0.0001).

Comment in

  • Just a spoonful of metformin helps the medicine go down

References

    1. Vanan MI, Eisenstat DD. DIPG in children — what can we learn from the past? Front Oncol. 2015;5:237. doi: 10.3389/fonc.2015.00237. - DOI - PMC - PubMed
    1. Cooney T, et al. Contemporary survival endpoints: an International Diffuse Intrinsic Pontine Glioma Registry study. Neuro Oncol. 2017;19(9):1279–1280. doi: 10.1093/neuonc/nox107. - DOI - PMC - PubMed
    1. Mackay A, et al. Integrated molecular meta-analysis of 1,000 pediatric high-grade and diffuse intrinsic pontine glioma. Cancer Cell. 2017;32(4):520–537. doi: 10.1016/j.ccell.2017.08.017. - DOI - PMC - PubMed
    1. Bender S, et al. Reduced H3K27me3 and DNA hypomethylation are major drivers of gene expression in K27M mutant pediatric high-grade gliomas. Cancer Cell. 2013;24(5):660–672. doi: 10.1016/j.ccr.2013.10.006. - DOI - PubMed
    1. Lewis PW, et al. Inhibition of PRC2 activity by a gain-of-function H3 mutation found in pediatric glioblastoma. Science. 2013;340(6134):857–861. doi: 10.1126/science.1232245. - DOI - PMC - PubMed

MeSH terms