. 2023 Oct;2(10):EVIDoa2300026.
doi: 10.1056/EVIDoa2300026. Epub 2023 Aug 4.

Performance of the Pediatric Asthma Risk Score across Diverse Populations

Affiliations

Performance of the Pediatric Asthma Risk Score across Diverse Populations

Jocelyn M Biagini et al. NEJM Evid. 2023 Oct.

Abstract

BACKGROUND: Methods to determine whether a toddler is likely to develop asthma are of value to parents and clinical trialists testing primary prevention strategies. The Pediatric Asthma Risk Score (PARS) is a 14-point score of six factors designed to predict asthma in early life. PARS was developed and validated in relatively homogenous populations, so its generalizability is unknown. METHODS: We computed PARS using the six factors of self-declared race (parent-reported as “Black” or “not Black”), parental asthma, eczema, any wheezing, wheezing without a cold, and polysensitization in 5634 children from birth to 3 years of age. The primary outcome of our analysis was the ability of PARS to predict asthma development at 5 to 10 years of age using the area under the receiver operating curve in each cohort and across all cohorts with varying ethnicity, sex, cohort type, birth decades, missing PARS factors, and polysensitization definition. We also performed a meta-analysis across all the cohorts. Finally, we compared PARS predictive ability with the binary Asthma Predictive Index (API). RESULTS: Across 10 cohorts, the area under the receiver operating curve for PARS was 0.76. PARS performance did not differ by ethnicity, sex, cohort type, enrollment decade, missing PARS factors, or polysensitization definition (all P>0.05). The weights of each factor in the meta-analysis were similar to the original PARS weights. PARS and API equally identified children at high risk for developing asthma or not; API missed 31% of children at moderate asthma risk. CONCLUSIONS: PARS provided robust estimates of asthma risk in children from a wide range of ethnicities, backgrounds, and susceptibility. (Funded by the National Institute of Allergy and Infectious Diseases and others.)


Figures

Figure 1.
Figure 1.
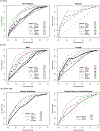
Performance of the PARS Model in Each of the 10 CREW Cohorts and Harmonized Across all Cohorts. A: PARS AUC in each cohort. B: AUCs and net reclassification for PARS and API. AUC: Area under the curve. API: Asthma Predictive Index. NRI: Net reclassification index. CAS: Childhood Allergy/Asthma Study. CCAAPS: Cincinnati Childhood Allergy and Air Pollution Study. CCCEH: Columbia Center for Children’s Environmental Health. COAST: Childhood Origins of Asthma Study. EHAAS: Epidemiology of Home Allergens and Asthma Study. IIS: The Infant Immune Study. INSPIRE: Infant Susceptibility to Pulmonary Infections and Asthma Following RSV Exposure. TCRS: Tucson Children’s Respiratory Study. URECA: Urban Environment and Childhood Asthma. WHEALS: Wayne County Health Environment Allergy and Asthma Longitudinal Study.
Figure 2.
Figure 2.
PARS AUC analyses stratified by A) parent-reported ethnicity, B) sex, and C) cohort type. AUC: Area under the curve. CAS: Childhood Allergy/Asthma Study. CCAAPS: Cincinnati Childhood Allergy and Air Pollution Study. CCCEH: Columbia Center for Children’s Environmental Health. COAST: Childhood Origins of Asthma Study. EHAAS: Epidemiology of Home Allergens and Asthma Study. IIS: The Infant Immune Study. INSPIRE: Infant Susceptibility to Pulmonary Infections and Asthma Following RSV Exposure. TCRS: Tucson Children’s Respiratory Study. URECA: Urban Environment and Childhood Asthma. WHEALS: Wayne County Health Environment Allergy and Asthma Longitudinal Study.
Figure 3.
Figure 3.
Odds ratio of each PARS factor in each of the 10 CREW cohorts and from the meta-analysis. META is the OR for the meta-analysis. CAS: Childhood Allergy/Asthma Study. CCAAPS: Cincinnati Childhood Allergy and Air Pollution Study. CCCEH: Columbia Center for Children’s Environmental Health. COAST: Childhood Origins of Asthma Study. EHAAS: Epidemiology of Home Allergens and Asthma Study. IIS: The Infant Immune Study. INSPIRE: Infant Susceptibility to Pulmonary Infections and Asthma Following RSV Exposure. TCRS: Tucson Children’s Respiratory Study. URECA: Urban Environment and Childhood Asthma. WHEALS: Wayne County Health Environment Allergy and Asthma Longitudinal Study.
Figure 4.
Figure 4.
Predicted (solid circles) versus observed (striped bars) asthma prevalence by PARS in 10 CREW cohorts. Gray shading depicts the proportion of children predicted to have asthma by the Asthma Predictive Index (API) of those that have asthma.

References

    1. Zahran HS, Bailey CM, Damon SA, Garbe PL, Breysse PN. Vital Signs: Asthma in Children - United States, 2001-2016. MMWR Morb Mortal Wkly Rep 2018;67(5):149–155. DOI: 10.15585/mmwr.mm6705e1. - DOI - PMC - PubMed
    1. Biagini Myers JM, Schauberger E, He H, et al. A Pediatric Asthma Risk Score to better predict asthma development in young children. J Allergy Clin Immunol 2019;143(5):1803–1810 e2. DOI: 10.1016/j.jaci.2018.09.037. - DOI - PMC - PubMed
    1. LeMasters GK, Wilson K, Levin L, et al. High prevalence of aeroallergen sensitization among infants of atopic parents. J Pediatr 2006;149(4):505–11. (In eng) (http://www.ncbi.nlm.nih.gov/entrez/query.fcgi?cmd=Retrieve&db=PubMed&dop...). - PMC - PubMed
    1. Kurukulaaratchy RJ, Fenn MH, Waterhouse LM, Matthews SM, Holgate ST, Arshad SH. Characterization of wheezing phenotypes in the first 10 years of life. Clin Exp Allergy 2003;33(5):573–8. (https://www.ncbi.nlm.nih.gov/pubmed/12752584). - PubMed
    1. Arshad SH, Holloway JW, Karmaus W, et al. Cohort Profile: The Isle Of Wight Whole Population Birth Cohort (IOWBC). Int J Epidemiol 2018;47(4):1043–1044i. DOI: 10.1093/ije/dyy023. - DOI - PMC - PubMed