. 2024 May 1;73(5):713-727.
doi: 10.2337/db23-0609.

Adipocyte-Specific Hnrnpa1 Knockout Aggravates Obesity-Induced Metabolic Dysfunction via Upregulation of CCL2

Affiliations

Adipocyte-Specific Hnrnpa1 Knockout Aggravates Obesity-Induced Metabolic Dysfunction via Upregulation of CCL2

Xiaoya Li et al. Diabetes. .

Abstract

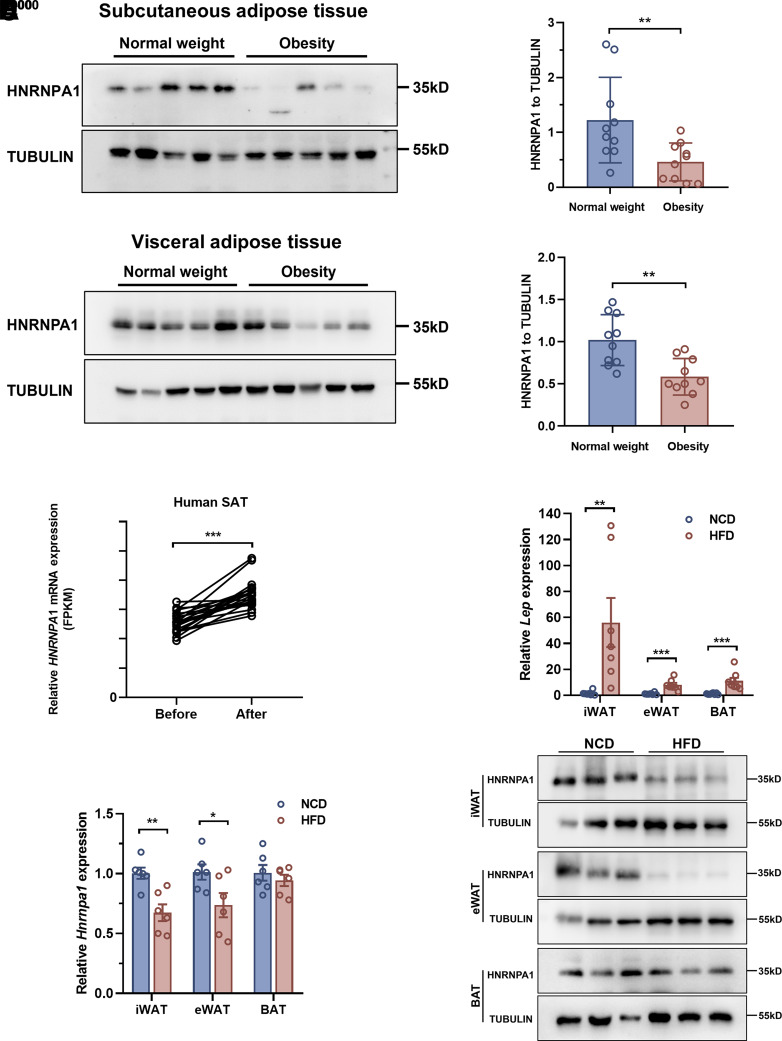
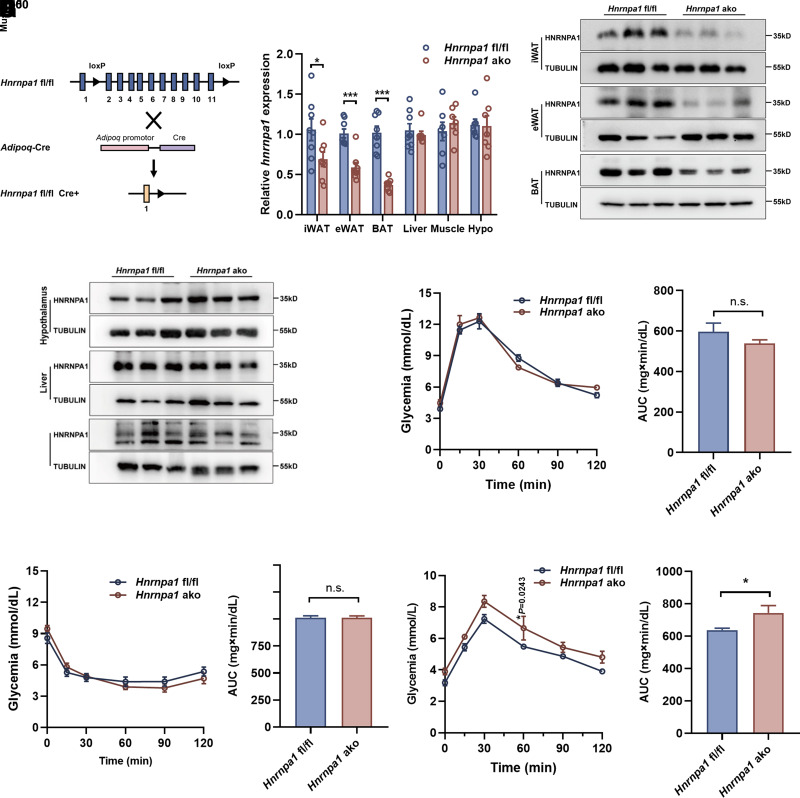
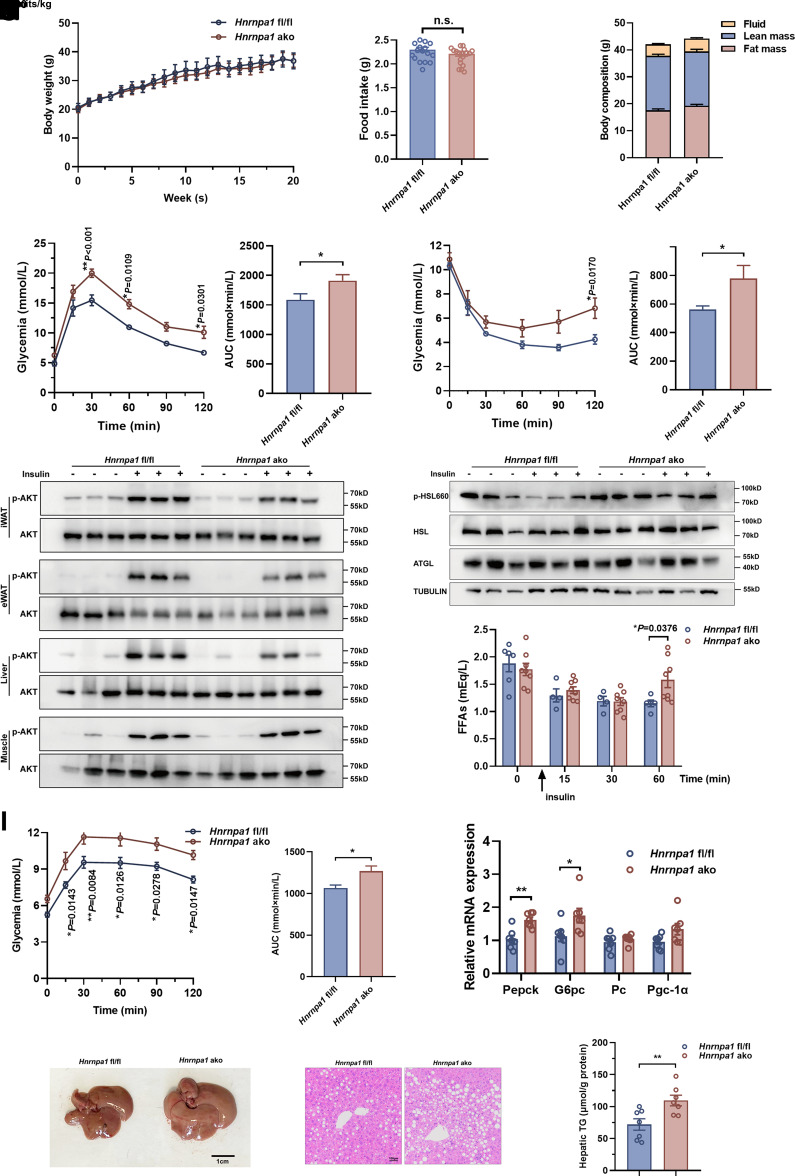
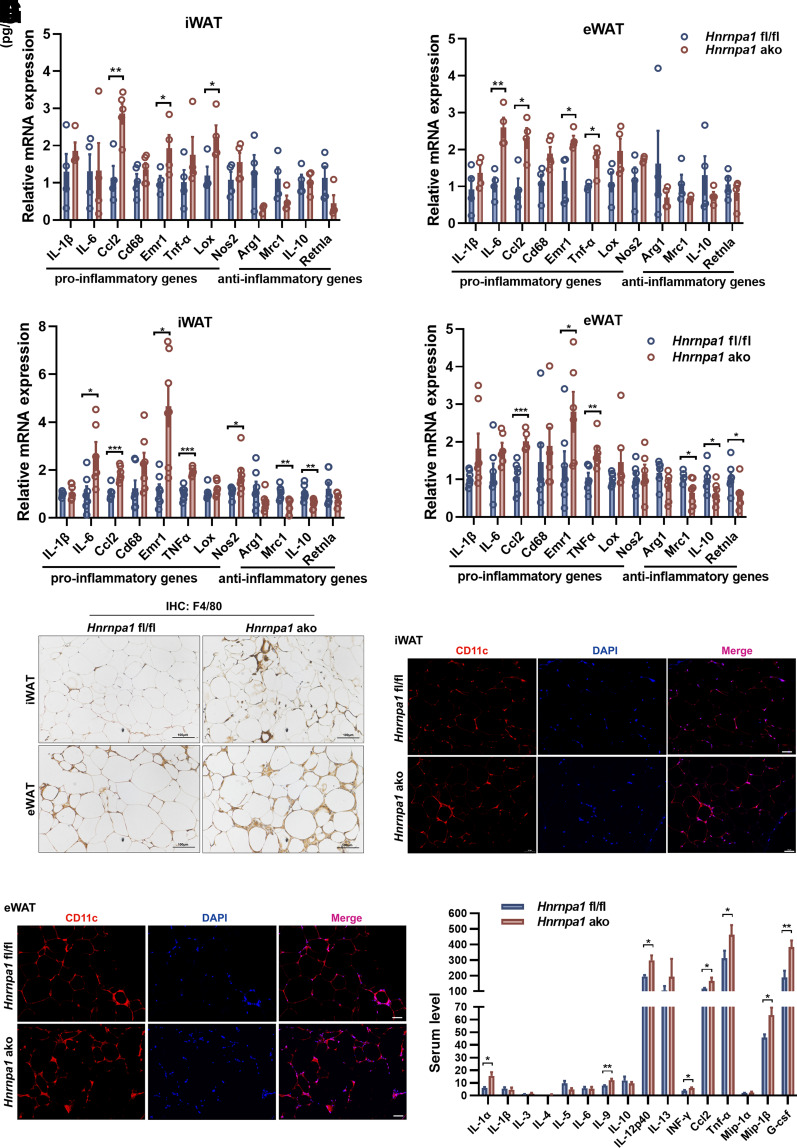
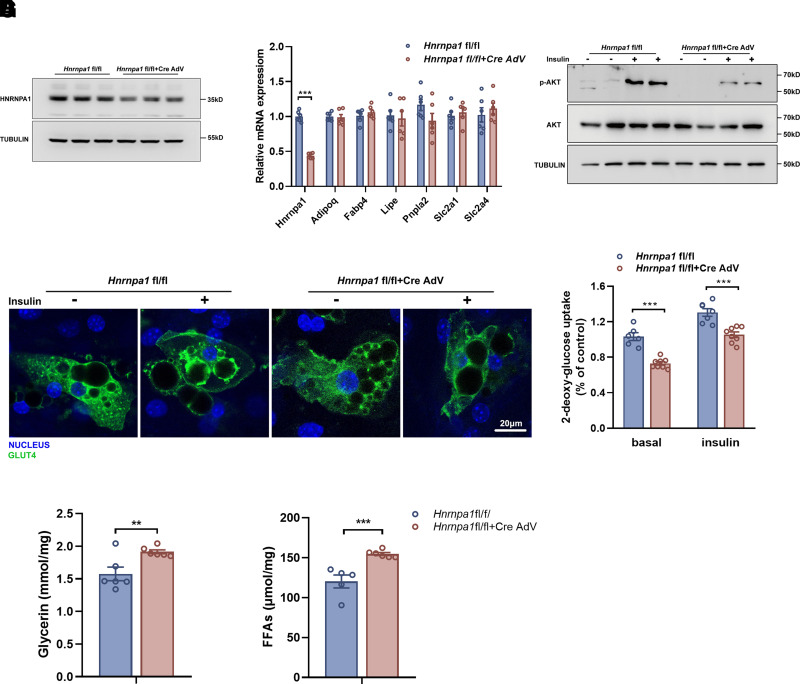
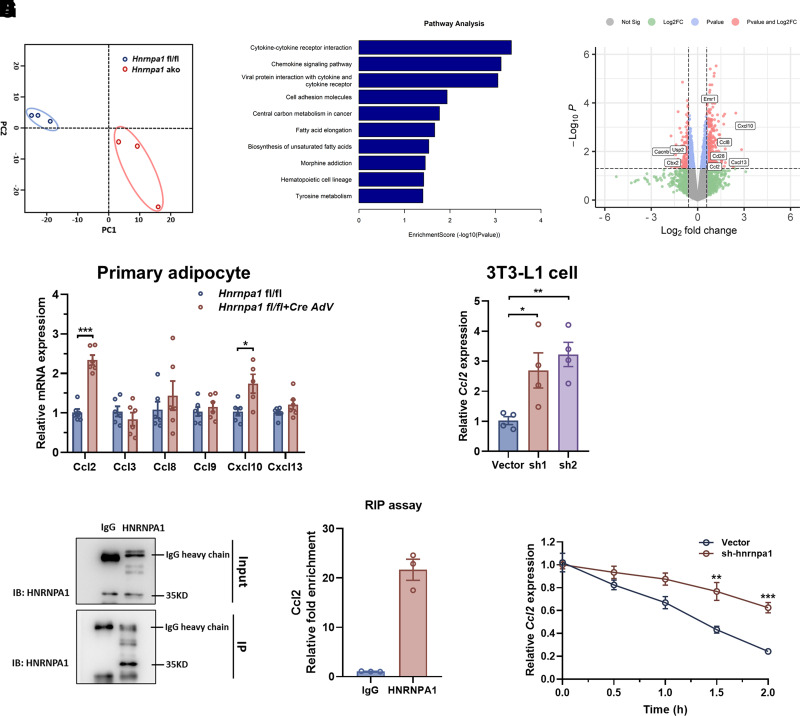
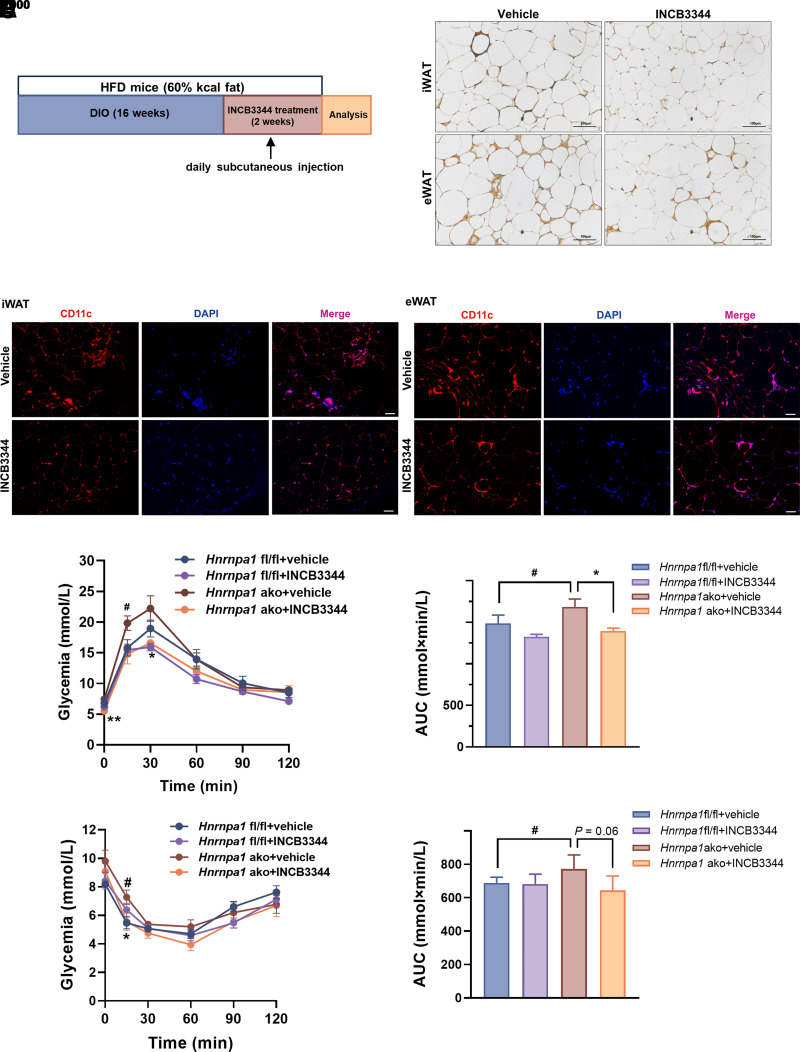
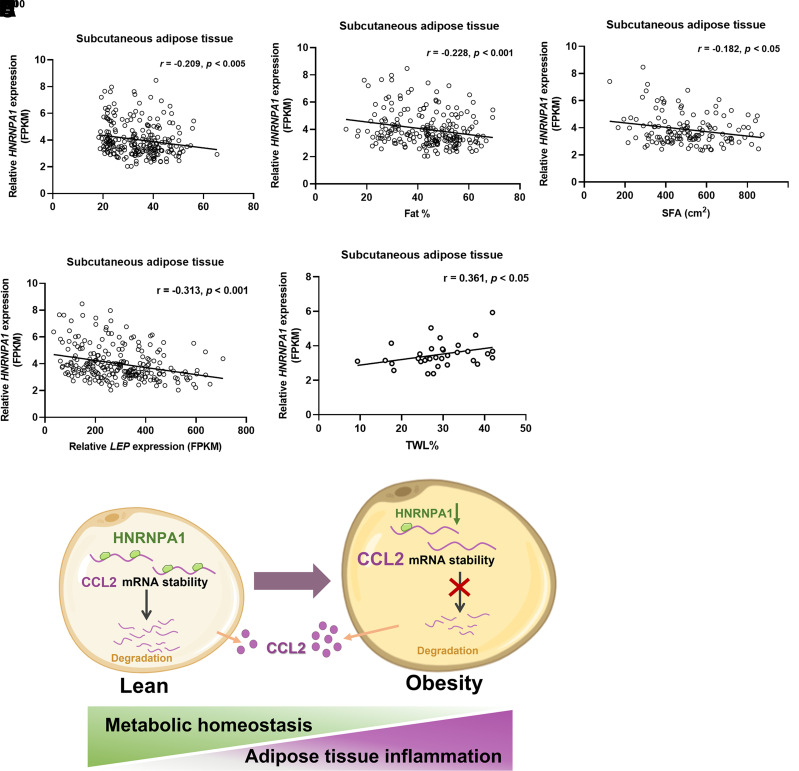
Heterogeneous nuclear ribonucleoprotein A1 (HNRNPA1) is involved in lipid and glucose metabolism via mRNA processing. However, whether and how HNRNPA1 alters adipocyte function in obesity remain obscure. Here, we found that the obese state downregulated HNRNPA1 expression in white adipose tissue (WAT). The depletion of adipocyte HNRNPA1 promoted markedly increased macrophage infiltration and expression of proinflammatory and fibrosis genes in WAT of obese mice, eventually leading to exacerbated insulin sensitivity, glucose tolerance, and hepatic steatosis. Mechanistically, HNRNPA1 interacted with Ccl2 and regulated its mRNA stability. Intraperitoneal injection of CCL2-CCR2 signaling antagonist improved adipose tissue inflammation and systemic glucose homeostasis. Furthermore, HNRNPA1 expression in human WAT was negatively correlated with BMI, fat percentage, and subcutaneous fat area. Among individuals with 1-year metabolic surgery follow-up, HNRNPA1 expression was positively related to percentage of total weight loss. These findings identify adipocyte HNRNPA1 as a link between adipose tissue inflammation and systemic metabolic homeostasis, which might be a promising therapeutic target for obesity-related disorders.


Conflict of interest statement

Duality of Interest. No potential conflicts of interest relevant to this article were reported.

Figures

Figure 1
Figure 1
HNRNPA1 expression in adipose tissue decreases in obesity. A: Representative Western blot analysis and quantification of HNRNPA1 expression in SAT from normal weight and obese individuals (n = 10 biologically independent samples). B: Representative Western blot analysis and quantification of HNRNPA1 expression in VAT from normal weight and obese individuals (n = 10 biologically independent samples). C: Changes of HNRNPA1 mRNA expression levels in human SAT before and after 3 months of Roux-en-Y gastric bypass. D and E: RT-qPCR analysis of leptin and Hnrnpa1 mRNA expression in iWAT, eWAT, and brown adipose tissue (BAT) from NCD- or HFD-fed mice (n = 6 biologically independent mice). F: Representative Western blot analysis of HNRNPA1 expression in iWAT, eWAT, and BAT from NCD- and HFD-fed mice (n = 3 biologically independent samples per group). Data are mean ± SEM. P values were determined by two-tailed Student t test. *P < 0.05, **P < 0.01, ***P < 0.001.
Figure 2
Figure 2
Adipocyte HNRNPA1 abrogation promotes hepatic gluconeogenesis under NCD feeding. A: Schematic representation of the generation of the Hnrnpa1 ako mouse model. B: RT-qPCR analysis of Hnrnpa1 mRNA expression in iWAT, eWAT, brown adipose tissue (BAT), liver, muscle, and hypothalamus (Hypo) from Hnrnpa1 fl/fl or Hnrnpa1 ako mice (n = 6 biologically independent mice). C: Representative Western blot analysis of HNRNPA1 expression in iWAT, eWAT, and BAT from Hnrnpa1 fl/fl or Hnrnpa1 ako mice (n = 3 biologically independent mice). D: Representative Western blot analysis of HNRNPA1 expression in hypothalamus, liver, and muscle (n = 3 biologically independent samples per group). E: Glucose tolerance test and area under the curve (AUC) of Hnrnpa1 fl/fl or Hnrnpa1 ako mice (n = 5 biologically independent mice). F: Insulin tolerance test and AUC of Hnrnpa1 fl/fl or Hnrnpa1 ako mice (n = 5 biologically independent mice). G: Pyruvate tolerance test and AUC of Hnrnpa1 fl/fl or Hnrnpa1 ako mice (n = 5 biologically independent mice). Data are mean ± SEM. P values were determined by unpaired two-tailed Student t test (B) or two-way ANOVA with Šidák multiple comparisons test (E, F, and G). *P < 0.05, ***P < 0.001.
Figure 3
Figure 3
Hnrnpa1 ako mice show metabolic impairments when maintained on an HFD. Male Hnrnpa1 fl/fl and age-matched Hnrnpa1 ako littermates were fed an HFD for 20 weeks, and HFD feeding started at 8 weeks of age. A and B: Body weight and food intake (n = 7 biologically independent mice). C: Body composition, including fat mass, lean mass, and fluid (n = 7 biologically independent mice). D: Glucose tolerance test and area under the curve (AUC) (n = 7 biologically independent mice). E: Insulin tolerance test and AUC (n = 7 biologically independent mice). F: Representative Western blot analysis of AKT phosphorylation in murine iWAT, eWAT, liver, and muscle after insulin administration (1 unit/kg) or PBS in vivo. G: Representative Western blot analysis of hormone-sensitive lipase (HSL) phosphorylation in murine iWAT after insulin administration (1 unit/kg) or PBS in vivo. H: Serum free fatty acid (FFA) levels of mice after insulin administration (0.5 units/kg) or PBS in vivo. I: Pyruvate tolerance test and AUC. J: RT-qPCR analysis of gluconeogenesis gene expression in liver (n = 7 biologically independent mice). K: Representative pictures of livers from Hnrnpa1 fl/fl and Hnrnpa1 ako mice. L: Representative images of H-E–stained liver tissues (n = 4 per group; scale bar = 100 μm). M: Hepatic triglyceride (TG) levels (n = 7 for each group). Data are mean ± SEM. P values were determined by unpaired two-tailed Student t test (AC, J, and M) or two-way ANOVA with Šidák multiple comparisons test (D, E, H, and I). *P < 0.05, **P < 0.01. ATGL, adipose triglyceride lipase.
Figure 4
Figure 4
HNRNPA1 deficiency exacerbates adipose inflammation. A and B: RT-qPCR analysis indicating mRNA abundance of proinflammatory and anti-inflammatory genes in iWAT and eWAT under NCD feeding (n = 4 biologically independent mice per group). Male Hnrnpa1 fl/fl and age-matched Hnrnpa1 ako littermates then were fed an HFD for 20 weeks, and HFD feeding started at 8 weeks of age. C and D: RT-qPCR analysis indicating mRNA abundance of proinflammatory and anti-inflammatory genes in iWAT and eWAT (n = 6 biologically independent mice). E: Immunohistochemical (IHC) staining of F4/80 in iWAT and eWAT from Hnrnpa1 fl/fl and Hnrnpa1 ako mice (n = 3 biologically independent sample; scale bars = 100 μm). F and G: Representative images of immunofluorescence staining of iWAT and eWAT from 20-week HFD-fed Hnrnpa1 fl/fl and Hnrnpa1 ako mice (n = 3 biologically independent samples; scale bars = 50 μm). H: Serum inflammatory factor level analysis, including IL-1α, IL-1β, IL-3, IL-4, IL-5, IL-6, IL-9, IL-10, IL-12p40, IL-13, IFN-γ, CCL2, TNF-α, MIP-1α, MIP-1β, and granulocyte colony-stimulating factor (G-CSF). P values were determined by unpaired two-tailed Student t test (AD, H). *P < 0.05, **P < 0.01, ***P < 0.001.
Figure 5
Figure 5
HNRNPA1 knockdown leads to adipocyte dysfunction. Primary iWAT preadipocytes were isolated from Hnrnpa1 fl/fl mice and differentiated into white adipocytes. On differentiation day 3, vector adenovirus and Cre AdV were respectively infected with cultured adipocytes isolated from Hnrnpa1 fl/fl mice to the knockout Hnrnpa1 allele. A: Western blot analysis of the knockdown efficiency of HNRNPA1. B: RT-qPCR analysis of mRNA levels of Hnrnpa1, genes involved in adipogenesis (Adipoq, Fabp4), lipolysis (Lipe, Pnpla2), and glucose metabolism (Slc2a1, Slc2a4) in primary white adipocytes infected with control or Cre AdV. C: Western blot analysis of AKT phosphorylation in primary adipocytes after insulin (10 nmol/L) or PBS treatment. D: Representative images (n = 4 biologically samples per group) of membrane localization of GLUT4 in primary adipocytes after treatment with 100 nmol/L insulin or PBS for 24 h (scale bar = 20 μm). E: 2-Deoxy-glucose uptake in control and Hnrnpa1 knockdown primary adipocytes with or without insulin treatment (100 nmol/L, 30 min) (n = 6 biologically independent sample per group). F: Adipocyte supernatant glycerin levels of control and Hnrnpa1 knockdown primary adipocytes. G: Free fatty acid (FFA) levels of adipocyte supernatant from control and Hnrnpa1 knockdown primary adipocytes. Data are mean ± SEM. P values were determined by unpaired two-tailed Student t test (B, EG). **P < 0.01, ***P < 0.001.
Figure 6
Figure 6
HNRNPA1 regulates the mRNA stability of CCL2. Male Hnrnpa1 fl/fl and age-matched Hnrnpa1 ako mice were fed an HFD for 20 weeks, and HFD feeding started at 8 weeks of age. A: Principal component (PC) analysis based on RNA-seq data from iWAT of Hnrnpa1 fl/fl and Hnrnpa1 ako mice (n = 3 replicates per condition). B: Pathway analysis of RNA-seq data from iWAT. C: Upregulated and downregulated genes in iWAT of Hnrnpa1 fl/fl and Hnrnpa1 ako mice. Data are represented in a volcano plot with fold changes (log2FC) and adjusted P values (−log10). D: RT-qPCR analysis of inflammatory chemokine genes expression (Ccl2, Ccl3, Ccl8, Ccl9, Cxcl10, and Cxcl13) in primary white adipocytes isolated from Hnrnpa1 fl/fl mice infected with control or Cre AdV. E: RT-qPCR analysis of Ccl2 expression of 3T3-L1 cells infected with lentiviral vector or two different shRNA target clones (Hnrnpa1 sh1, Hnrnpa1 sh2). F and G: RIP assay assessing HNRNPA1 binding with Ccl2 in 3T3-L1 adipocytes (n = 3). H: mRNA level of Ccl2 in control or HNRNPA1 knockdown 3T3-L1 adipocytes upon transcriptional inhibition with actinomycin D at the indicated times (n = 4). P values were determined by unpaired two-tailed Student t test (D, E, and G) or multiple t tests (H). *P < 0.05, **P < 0.01, ***P < 0.001. IB, immunoblotting; IP, immunoprecipitation; Not Sig, not significant.
Figure 7
Figure 7
CCL2-CCR2 antagonist improves metabolic disorder of Hnrnpa1 ako mice under HFD feeding. Male Hnrnpa1 fl/fl and age-matched Hnrnpa1 ako mice were fed an HFD for 16 weeks, and HFD feeding started at 8 weeks of age. A: Overview of INCB344 injection (2 weeks) in mice fed an HFD at the start of the experiment. B: Immunohistochemical staining of F4/80 in iWAT and eWAT from Hnrnpa1 fl/fl and Hnrnpa1 ako mice, with or without 2 weeks of INCB3344 injection (n = 3 biologically independent samples per group; scale bars = 100 μm). C and D: Representative images of immunofluorescence staining of iWAT and eWAT of Hnrnpa1 fl/fl and Hnrnpa1 ako mice, with or without 2 weeks of INCB3344 injection (n = 3 biologically independent samples; scale bars = 50 μm). E: Glucose tolerance test and area under the curve (AUC) (n = 7 biologically independent mice per group). F: Insulin tolerance test and AUC (n = 7 biologically independent mice per group). Data are mean ± SEM. P values were determined by two-way ANOVA with Šidák multiple comparisons test (E and F). *P < 0.05, comparing Hnrnpa1 ako with vehicle; #P < 0.05, comparing Hnrnpa1 fl/fl with vehicle. DIO, diet-induced obesity.
Figure 8
Figure 8
Human adipose tissue HNRNPA1 expression is correlated with obesity and metabolic traits. AC: The relationship between HNRNPA1 expression and BMI, fat percentage, and subcutaneous fat area (SFA) in SAT. D: The relationship between HNRNPA1 and LEP expression. E: The relationship between baseline HNRNPA1 expression and TWL% in individuals 1 year after metabolic surgery. F: Model of how adipocyte HNRNPA1 regulates CCL2 expression and thus influences adipose tissue inflammation and metabolic balance. Spearman correlation analysis is shown by r values and two-tailed P values. FPKM, fragments per kilobase of transcript per million mapped reads.

Similar articles

Cited by

References

    1. Blüher M. Obesity: global epidemiology and pathogenesis. Nat Rev Endocrinol 2019;15:288–298 - PubMed
    1. Chavakis T, Alexaki VI, Ferrante AW Jr. Macrophage function in adipose tissue homeostasis and metabolic inflammation. Nat Immunol 2023;24:757–766 - PubMed
    1. Sakers A, De Siqueira MK, Seale P, Villanueva CJ.. Adipose-tissue plasticity in health and disease. Cell 2022;185:419–446 - PMC - PubMed
    1. Scheja L, Heeren J.. The endocrine function of adipose tissues in health and cardiometabolic disease. Nat Rev Endocrinol 2019;15:507–524 - PubMed
    1. Fasshauer M, Blüher M.. Adipokines in health and disease. Trends Pharmacol Sci 2015;36:461–470 - PubMed