

Partial limitation of cellular functions and compensatory modulation of unfolded protein response pathways caused by double-knockout of ATF6α and ATF6β
- PMID: 38320450
- PMCID: PMC10939067
- DOI: 10.1016/j.cstres.2023.11.002
Partial limitation of cellular functions and compensatory modulation of unfolded protein response pathways caused by double-knockout of ATF6α and ATF6β
Abstract
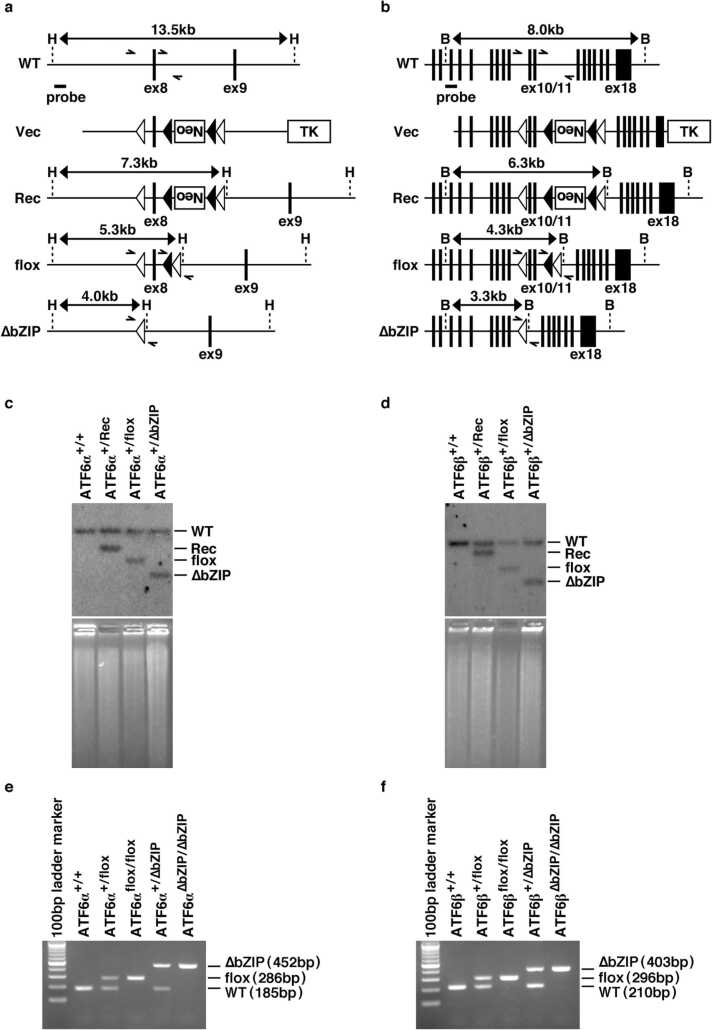
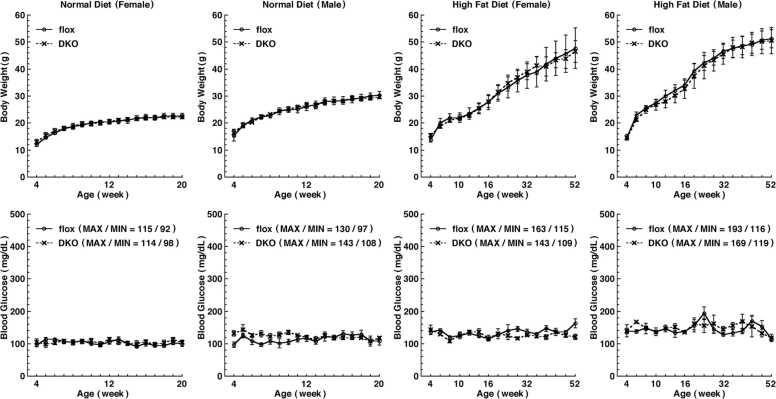
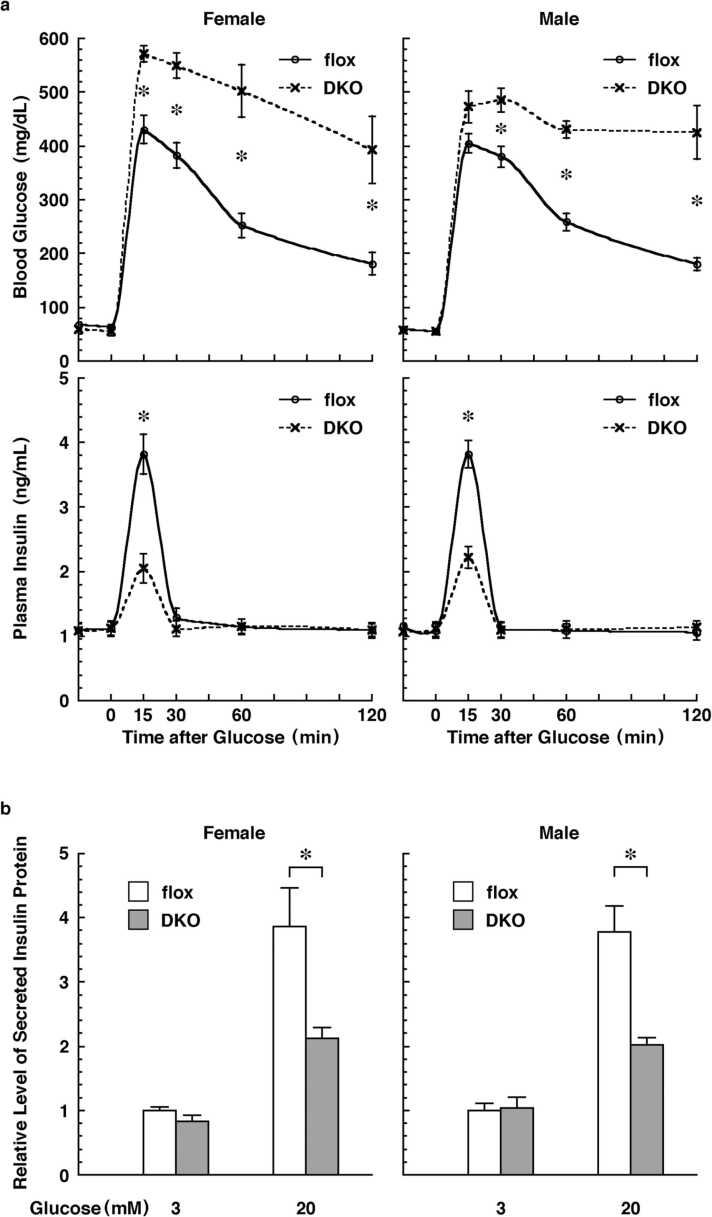
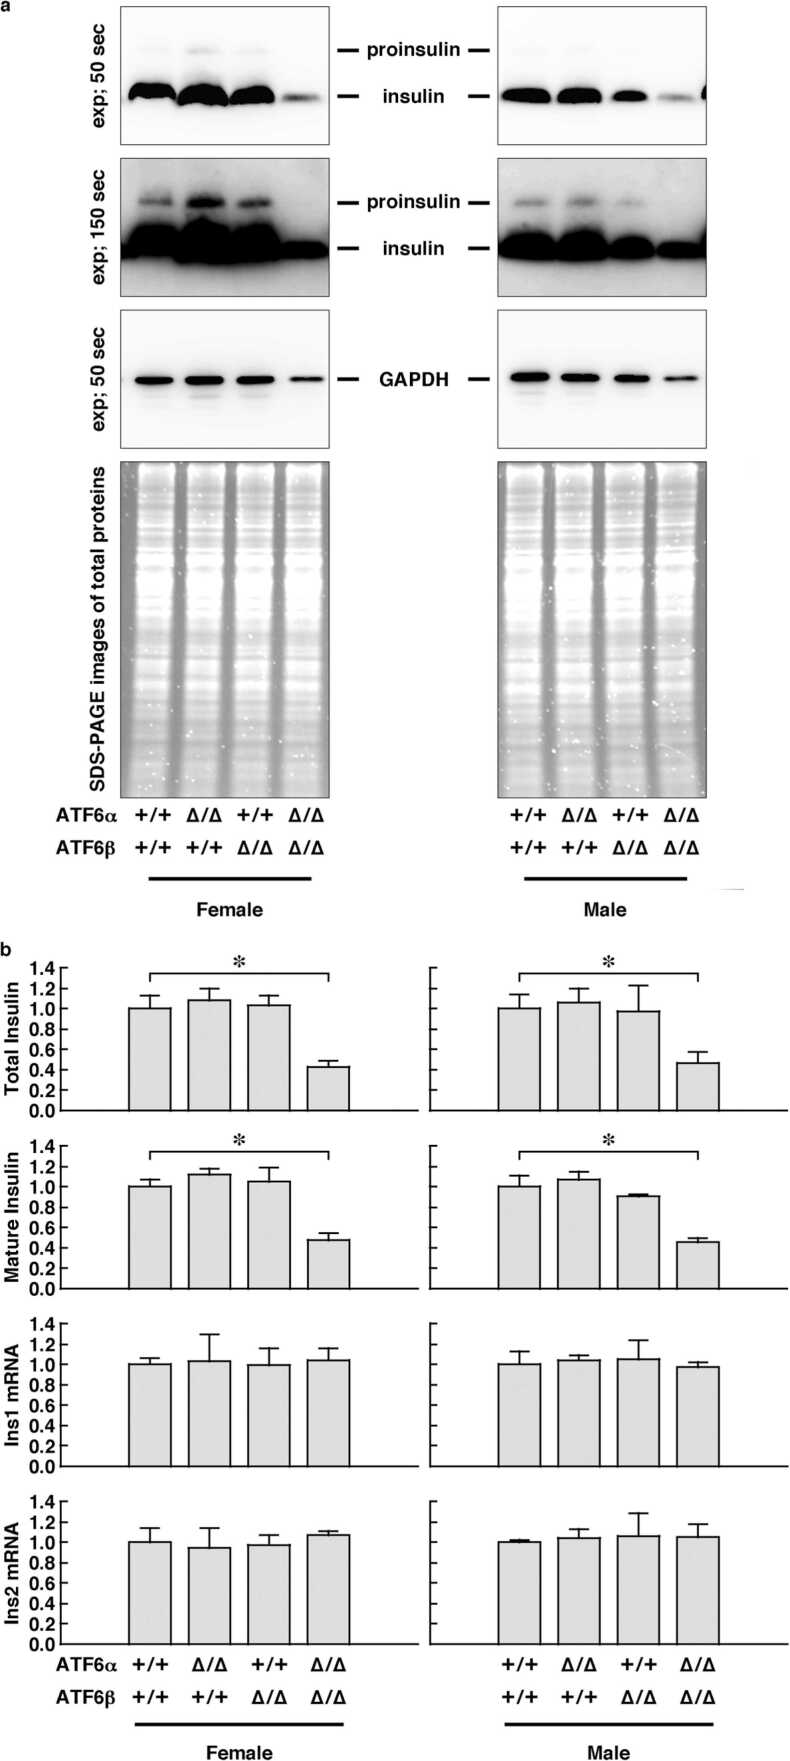
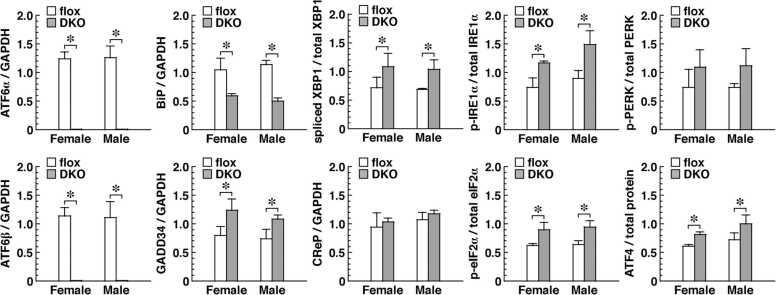
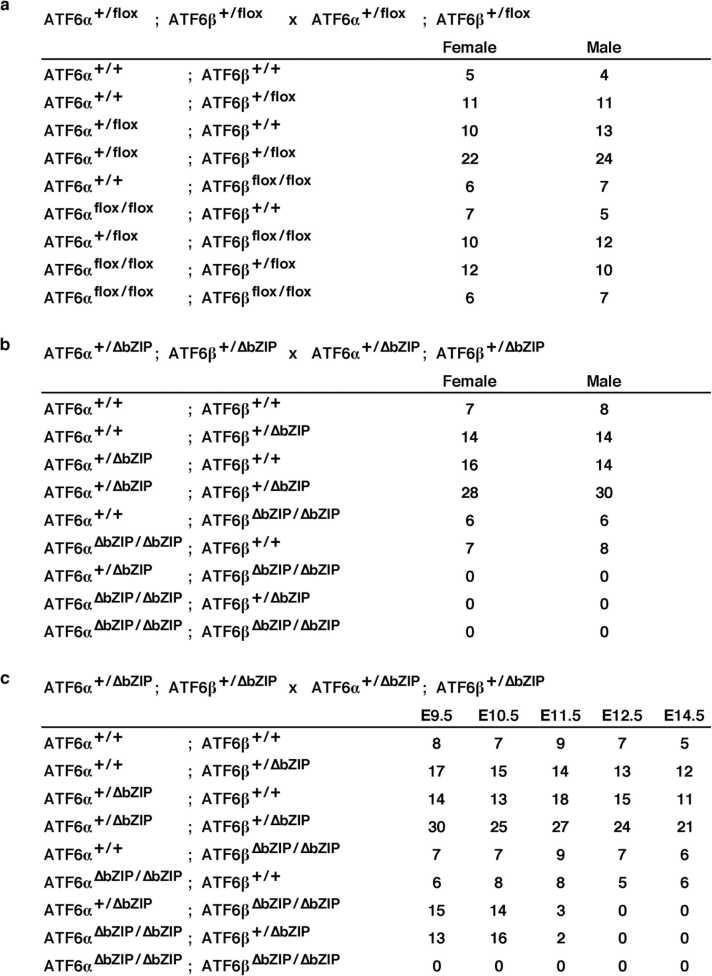
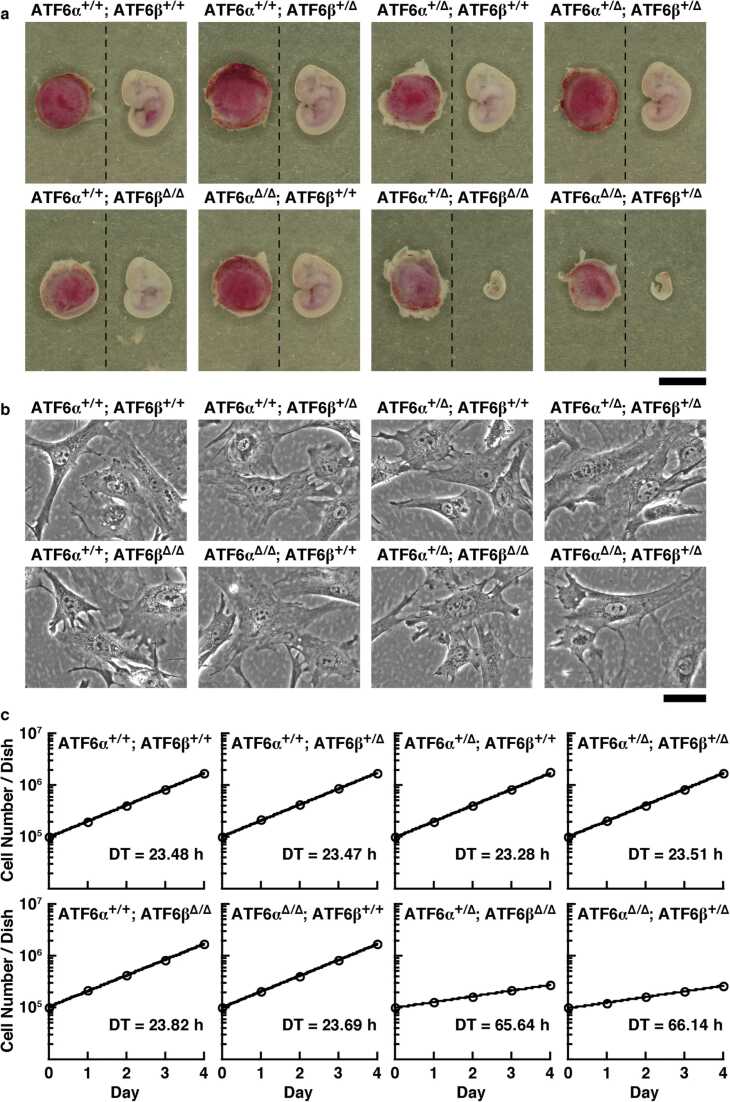
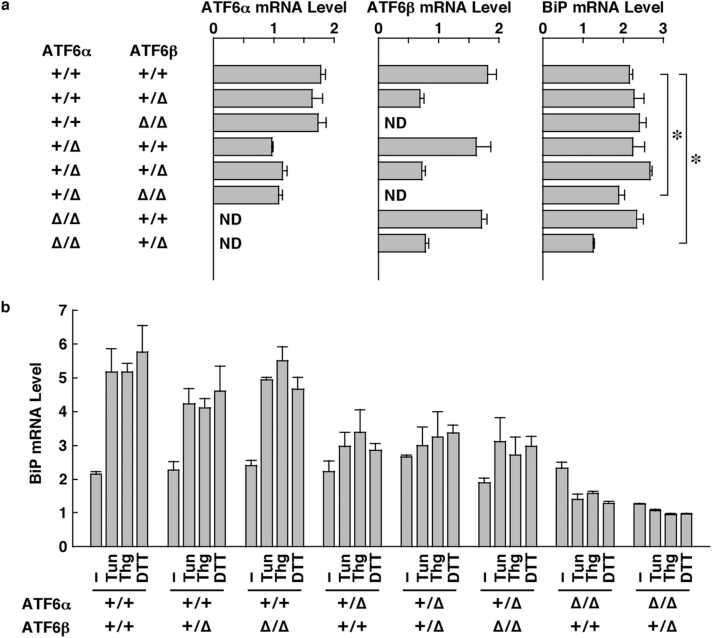
Mammalian cells have three types of endoplasmic reticulum (ER) stress-sensing molecules: ATF6, IRE1, and PERK. Among these, ATF6 is unique in that it is processed in an ER-stress-specific manner and functions as a transcription factor for the activation of anti-ER stress genes (such as BiP). ATF6 is known to have two homologues, ATF6α and ATF6β, and a greater understanding of their functions has been achieved through analyses using cultured cells. Physiological functions are also gradually being investigated in mice lacking ATF6α or ATF6β. However, little is known about the effects on mouse organisms of the deletion of both the ATF6α and ATF6β genes, since such double-knockout (DKO) mice suffer embryonic lethality at an early developmental stage. In this study, we generated and analyzed ATF6 DKO mice in which embryonic lethality was evaded by using Cre/loxP technology. Pancreatic β cell-specific ATF6 DKO mice were born normally and lived without dysregulation of blood-glucose levels but had a reduced tolerance to glucose. Islets isolated from ATF6 DKO mice also showed low production and secretion of insulin and mild enhancement of IRE1 and PERK activity. We further examined the developmental abnormalities of systemic ATF6 DKO mice. The phenotypes of ATF6α-/-; ATF6β-/- mice were similar to those previously reported, but ATF6α+/-; ATF6β-/- and ATF6α-/-; ATF6β+/- mice showed embryonic lethality at middle developmental stages, unlike those reported. Analysis of embryonic fibroblasts derived from these mice revealed that ATF6α and ATF6β have a gene-dose-dependent functional redundancy and display distinct differences in their ability to induce BiP expression. (250 words).
Keywords: BiP; ER stress; Insulin; Pancreatic β cell.
Copyright © 2023 The Authors. Published by Elsevier Inc. All rights reserved.
Conflict of interest statement
Declaration of Competing Interest The authors declare the following financial interests/personal relationships which may be considered as potential competing interests: Takao Iwawaki reports financial support was provided by JSPS. Kenji Kohno reports financial support was provided by JSPS. Takao Iwawaki reports financial support was provided by The Uehara Memorial Foundation. Takao Iwawaki reports financial support was provided by Toray Science Foundation. Kenji Kohno reports financial support was provided by The Takeda Science Foundation. If there are other authors, they declare that they have no known competing financial interests or personal relationships that could have appeared to influence the work reported in this paper.
Figures
Similar articles
-
Loss of ATF6α in a human carcinoma cell line is compensated not by its paralogue ATF6β but by sustained activation of the IRE1 and PERK arms for tumor growth in nude mice.Mol Biol Cell. 2023 Mar 1;34(3):ar20. doi: 10.1091/mbc.E22-07-0292. Epub 2023 Jan 25. Mol Biol Cell. 2023. PMID: 36696173 Free PMC article.
-
Transcriptional induction of mammalian ER quality control proteins is mediated by single or combined action of ATF6alpha and XBP1.Dev Cell. 2007 Sep;13(3):365-76. doi: 10.1016/j.devcel.2007.07.018. Dev Cell. 2007. PMID: 17765680
-
Overlapping and differential functions of ATF6α versus ATF6β in the mouse heart.Sci Rep. 2019 Feb 14;9(1):2059. doi: 10.1038/s41598-019-39515-5. Sci Rep. 2019. PMID: 30765833 Free PMC article.
-
Sledgehammer to Scalpel: Broad Challenges to the Heart and Other Tissues Yield Specific Cellular Responses via Transcriptional Regulation of the ER-Stress Master Regulator ATF6α.Int J Mol Sci. 2020 Feb 8;21(3):1134. doi: 10.3390/ijms21031134. Int J Mol Sci. 2020. PMID: 32046286 Free PMC article. Review.
-
Molecular signal networks and regulating mechanisms of the unfolded protein response.J Zhejiang Univ Sci B. 2017 Jan.;18(1):1-14. doi: 10.1631/jzus.B1600043. J Zhejiang Univ Sci B. 2017. PMID: 28070992 Free PMC article. Review.
References
-
- Alberts B., Heald R., Johnson A., Morgan D., Raff M., Roberts K., Walter P. Molecular Biology of the Cell. 7th ed., Norton; New York: 2022.
MeSH terms
Substances
LinkOut - more resources
Full Text Sources
Molecular Biology Databases
