. 2024 Apr:70:103062.
doi: 10.1016/j.redox.2024.103062. Epub 2024 Jan 26.

VDR regulates mitochondrial function as a protective mechanism against renal tubular cell injury in diabetic rats

Affiliations

VDR regulates mitochondrial function as a protective mechanism against renal tubular cell injury in diabetic rats

Hong Chen et al. Redox Biol. 2024 Apr.

Abstract

Purpose: To investigate the regulatory effect and mechanism of Vitamin D receptor (VDR) on mitochondrial function in renal tubular epithelial cell under diabetic status.

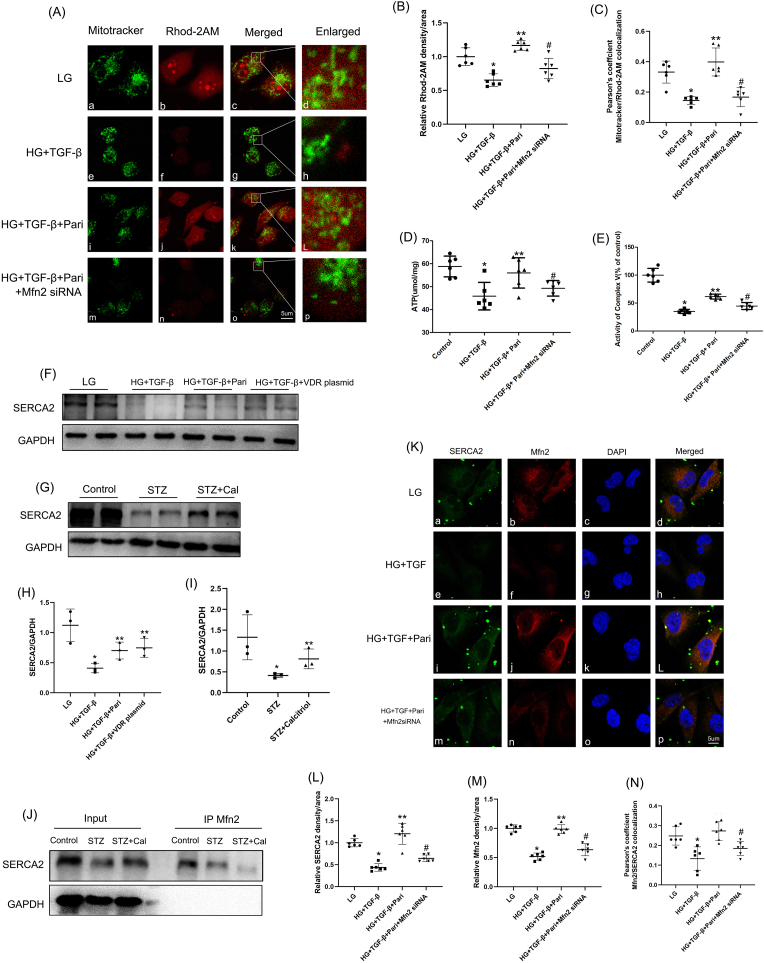
Methods: The diabetic rats induced by streptozotocin (STZ) and HK-2 cells under high glocose(HG)/transforming growth factor beta (TGF-β) stimulation were used in this study. Calcitriol was administered for 24 weeks. Renal tubulointerstitial injury and some parameters of mitochondrial function including mitophagy, mitochondrial fission, mitochondrial ROS, mitochondrial membrane potential (MMP), mitochondrial ATP, Complex V activity and mitochondria-associated ER membranes (MAMs) integrity were examined. Additionally, paricalcitol, 3-MA (an autophagy inhibitor), VDR over-expression plasmid, VDR siRNA and Mfn2 siRNA were applied in vitro.

Results: The expression of VDR, Pink1, Parkin, Fundc1, LC3II, Atg5, Mfn2, Mfn1 in renal tubular cell of diabetic rats were decreased significantly. Calcitriol treatment reduced the levels of urinary albumin, serum creatinine and attenuated renal tubulointerstitial fibrosis in STZ induced diabetic rats. In addition, VDR agonist relieved mitophagy dysfunction, MAMs integrity, and inhibited mitochondrial fission, mitochondrial ROS. Co-immunoprecipitation analysis demonstrated that VDR interacted directly with Mfn2. Mitochondrial function including mitophagy, mitochondrial membrane potential (MMP), mitochondrial Ca2+, mitochondrial ATP and Complex V activity were decreased dramatically in HK-2 cells under HG/TGF-β ambience. In vitro pretreatment of HK-2 cells with autophagy inhibitor 3-MA, VDR siRNA or Mfn2 siRNA negated the activating effects of paricalcitol on mitochondrial function. Pricalcitol and VDR over-expression plasmid activated Mfn2 and then partially restored the MAMs integrity. Additionally, VDR restored mitophagy was partially associated with MAMs integrity through Fundc1.

Conclusion: Activated VDR could contribute to restore mitophagy through Mfn2-MAMs-Fundc1 pathway in renal tubular cell. VDR could recover mitochondrial ATP, complex V activity and MAMs integrity, inhibit mitochondrial fission and mitochondrial ROS. It indicating that VDR agonists ameliorate renal tubulointerstitial fibrosis in diabetic rats partially via regulation of mitochondrial function.

Keywords: DN; MAMs; Mitochondrial; Renal tubular cell; VDR.


Conflict of interest statement

Declaration of competing interest The authors report no conflicts of interest. The authors are responsible for the content and writing of the paper.

Figures

Fig. 1
Fig. 1
Calcitriol treatment relieved biochemical parameters and renal pathological injury in diabetic rats. A–C: Blood glucose, Body weight, Kidney weight/body weight ratio levels of different groups rats. D-G. Serum Alb, BUN, Scr and serum calcium ion levels of three groups rats. H. 24 h urine volume levels of three groups rats. I.24 h urinary albumin content of three groups rats. J.Serum levels of 25(OH)D3 in rats. K. Glomerular injury scores. L. Renal tubulo-interstitial injury scores. The values were reported as the mean ± SD (n), n = 6, *P<0.05 vs. control group, **P<0.05 vs. STZ group. M. HE staining (a–c) and PAS staining (d–f) of renal sections (magnification × 400, scale bar: 50um). N. Masson staining of renal tissue, the arrows indicated examples of damaged tubules (magnification × 400, scale bar: 50um). O. IF staining of Col-1 in rats renal tissue (magnification × 400, scale bar: 50um). P. Semiquantification analysis of IF staining for Col1. Values were presented as the mean ± SD (n), n = 6, *P<0.05 vs. control group, **P<0.05 vs. STZ group. Q. Western blot detection of FN (upper panel) and Col1 (lower panel) expression in renal tissue. R–S. Quantitative analysis of the Western blot results, GAPDH was used as the internal control. FN to GAPDH (R), Col1 to GAPDH (S). The values were reported as the mean ± SD (n), n = 3, *P < 0.05 vs. control group, **P<0.05 vs. STZ group.
Fig. 2
Fig. 2
Calcitriol treatment relieved mitophagy dysfunction in vivo. A. IHC staining for LC3 (upper panel) and PINK1 (lower panel) (magnification ×400, scale bar: 50um). B.Western blot analysis of PINK1 (upper panel), Parkin, Atg5, Fundc1 (middle panels) and LC3II (bottom panel) expression in various groups of renal tissue. C-D. Quantitative analysis for the IHC staining for LC3II (C) and PINK1 (D). Values were presented as the mean ± SD (n), n = 6, *P < 0.05 vs. control group, **P<0.05 vs. STZ group. E-I. Quantitative analysis of the Western blot results, PINK1 to GAPDH (E), Parkin to GAPDH (F), Atg5 to GAPDH (G), Fundc1 to GAPDH (H), LC3II to GAPDH (I). *P < 0.05 vs. control group, **P<0.05 vs. STZ group. The values were reported as the mean ± SD (n), n = 3. (For interpretation of the references to color in this figure legend, the reader is referred to the Web version of this article.)
Fig. 3
Fig. 3
Renal VDR and mitochondrial fission or fusion factors expression in diabetic rats. A. IHC staining for VDR (upper panel) and Mfn2 (lower panel) (magnification ×400, scale bar: 50um). B–C. Quantitative analysis for the IHC staining of VDR (B) and Mfn2 (C). *P < 0.05 vs. control group, **P<0.05 vs. STZ group. The values were reported as the mean ± SD (n), n = 6. D. Western blot analysis of Mfn2 (upper panel), Mfn1,Drp1, VDR (middle panels) and Fis1 (bottom panel) expression. E-I. Densitometric quantitative analysis of the Western blotting results, Mfn2 to GAPDH (E), Mfn1 to GAPDH (F), Drp1 to GAPDH (G), VDR to GAPDH (H), Fis1 to GAPDH (I). *P < 0.05 vs. control group, **P<0.05 vs. STZ group, values were presented as the mean ± SD (n), n = 3. N. CO-IP analysis of VDR interacting with Mfn2 (J), Mfn1(K), Drp1(L), Fis1(M) or VDR (N) in renal tissue of various groups rat.
Fig. 4
Fig. 4
Effects of VDR agonist and VDR plasmid on FN, Col1, Drp1, Mfn1, Mfn2, Fis1 protein expression in vitro. A.HK-2 cells morphology in different concentrations of TGF-β and HG (magnification × 400). B.CCK-8 assay to detect the proliferation and viability of HK-2 cells under HG/TGF-β stimulation. C.Western blot analysis of VDR protein expression in the HK-2 cells. D. Quantitative analysis of Western blot results, *P<0.05 vs. control groups, values were presented as the mean ± SD (n), n = 3. E. Western blot analysis of Mfn2 (upper panel), Mfn1(middle panel), and Fis1 (bottom panel) protein expression in HK-2 cells. F. Western blot analysis of FN (upper panel), Col-1, Drp1 (middle panel), and VDR (bottom panel) protein expression in HK-2 cells of various groups. G-M. Quantitative analysis of the Western blot results: FN to GAPDH (G), Col1 to GAPDH (H), Drp1 to GAPDH (I), VDR to GAPDH (J), Mfn2 to GAPDH (K), Mfn1 to GAPDH (L) and Fis1 to GAPDH (M). *P < 0.05 vs. LG group, **P<0.05 vs. HG + TGF-β group, values were presented as the mean ± SD (n), n = 3. N. Confocal microscopy detection of VDR (right panel, green), mitochondria (middle panel, red), and nucleus (DAPI, blue) in HK-2 cells (magnification × 630, scale bar: 5 μm). O. Quantitative analysis of VDR fluorescence density. *P < 0.05 vs. LG group, **P<0.05 vs. HG + TGF-β group. P. Pearson's co-localization analysis between VDR and Mitotracker, *P < 0.05 vs. LG group, **P<0.05 vs. HG + TGF-β group, the values were reported as the mean ± SD (n), n = 6. (For interpretation of the references to color in this figure legend, the reader is referred to the Web version of this article.)
Fig. 5
Fig. 5
VDR restored mitophagy in HK-2 cells under HG/TGF-β stimulation. Western blot analysis of mitochondria proteins (left panels) and cytoplasm proteins (right panels) including PINK1 (upper panel), Parkin, Atg5, Fundc1 (middle panels) and LC3II (bottom panel). B. Confocal microscopy detection of LC3II expression and mitochondrial morphology in HK-2 cells. C-L. Quantitative analysis of the Western blot results, Pink1 to CoxIV (C), Parkin to CoxIV (D), Atg5 to CoxIV (E), Fundc1 to CoxIV (F), LC3II to CoxIV (G), Pink1 to GAPDH (H), Parkin to GAPDH (I), Atg5 to GAPDH (J), Fundc1 to GAPDH (K), LC3II to GAPDH (L), *P < 0.05 vs. LG group, **P<0.05 vs. HG + TGF-β group, #P<0.05 vs. HG + TGF-β+Pari group, values were presented as the mean ± SD (n), n = 3. M. Quantitative analysis of LC3II fluorescence optical density. N.Pearson's co-localization analysis between VDR and Mitotracker, *P < 0.05 vs. LG group, **P<0.05 vs. HG + TGF-β group, #P<0.05 vs. HG + TGF-β+ Pari group, values were presented as the mean ± SD (n), n = 6. (For interpretation of the references to color in this figure legend, the reader is referred to the Web version of this article.)
Fig. 6
Fig. 6
VDR activated mitophagy was beneficial for ameliorating fibrosis and mitochondrial function. A.Western blot analysis of FN, Col1, Mfn2, Pink1, Atg5 and Fundc1protein expression in the HK-2 cells. B-G. Quantitative analysis of Western blot results, FN to GAPDH (B), Col1 to GAPDH (C), Mfn2 to GAPDH (D), Pink1 to GAPDH (E), Atg5 to GAPDH (F) and Fundc1 to GAPDH (G), *P < 0.05 vs. LG group, **P<0.05 vs. HG + TGF-β group, #P<0.05 vs. HG + TGF-β+Pari + VDR plasmid group, values were presented as the mean ± SD (n), n = 3. H. Western blot analysis of Parkin, VDR, and LC3 II expression. I–K. Quantitative analysis of Western blot results: Parkin to GAPDH (I), VDR to GAPDH (J), LC3II to GAPDH (K), *P < 0.05 vs. LG group, **P<0.05 vs. HG + TGF-β group, #P<0.05 vs. HG + TGF-β+Pari + VDR plasmid group, values were presented as the mean ± SD (n), n = 3. L. MitoSOX Red and JC-1 staining (magnification × 630, scale bar: 5 μm). M. Semi-quantitative analysis of MitoSox Red fluorescence optical density. N. Semi-quantitative analysis of MMP. *P < 0.05 vs. LG group, **P<0.05 vs. HG + TGF-β group, #P<0.05 vs. HG + TGF-β+Pari + VDR plasmid group, values were presented as the mean ± SD (n), n = 6. (For interpretation of the references to color in this figure legend, the reader is referred to the Web version of this article.)
Fig. 7
Fig. 7
VDR restored mitophagy was partially associated with MAMs integrity. A.Western blot analysis of Mfn2 and VDR expression in HK-2 cells. B–C. Quantitative analysis of Western blot results, Mfn2 to GAPDH (B), VDR to GAPDH (C). D-E.Western blot analysis of mitochondria protein (left panels) and cytoplasm protein (right panels) including PINK1, Parkin, Fundc1 and LC3II in HK-2 cells. F-M. Quantitative analysis of the Western blot results, Pink1 to CoxIV (F), Parkin to CoxIV (G), Fundc1 to CoxIV (H), LC3II to CoxIV (I), Pink1 to GAPDH (J), Parkin to GAPDH (K), Fundc1 to GAPDH (L), LC3II to GAPDH (M). *P < 0.05 vs. LG group, **P<0.05 vs. HG + TGF-β group, #P<0.05 vs. HG + TGF-β+Pari group, values were presented as the mean ± SD (n), n = 3. N. Confocal microscopy analysis of Fundc1 and Mfn2 expression in HK-2 cells. O–P. Quantitative analysis of Fundc1 and Mfn2 fluorescence optical density. Q. Pearson’ s co-localization analysis for Fundc1 and Mfn2. *P < 0.05 vs. LG group, **P<0.05 vs. HG + TGF-β group, #P<0.05 vs. HG + TGF-β+Pari group, values were presented as the mean ± SD (n), n = 6. R. TEM analysis of mitochondrial morphological changes in renal tubular cells of STZ rats. The red dots and black dots represented MAMs structure. Calcitriol treatment group exhibited conspicuous mitochondrial autophagosome (k, marked with red arrow, d, h, L. diagrammatic figures based on parallel TEM figures). S. TEM analysis for HK-2 cells of various group. The red dots and black dots represented MAMs structure (c, g, k, o, d, h, L, p), mitochondrial autophagosome was marked with red arrow (j) (d, h, L, p. diagrammatic figures based on parallel TEM figures. T. IF double staining using ER Blue (blue) and MitoTracker (red) in HK-2 cells. U.Bar graphs represented ER-mitochondrial contact sites in renal tissue, *P < 0.05 vs. control group, **P < 0.05 vs. STZ group, values were presented as the mean ± SD (n), n = 6. V.Bar graphs represented ER-mitochondrial contact sites in HK-2 cells. W. Pearson’ s co-localization analysis between mitochondria and ER,*P < 0.05 vs. LG group, **P<0.05 vs. HG + TGF-β group, #P<0.05 vs. HG + TGF-β+Pari group, values were presented as the mean ± SD (n), n = 6. (For interpretation of the references to color in this figure legend, the reader is referred to the Web version of this article.)
Fig. 8
Fig. 8
Effects of VDR agonist on the levels of mitochondrial Ca2+, mitochondria ATP, Complex V activity and SERCA protein expression. A. Confocal microscopy detection of mitochondrial Ca2+ levels in HK-2 cells (magnification × 630, scale bar: 5 μm). B. Quantifiaction analysis of Rhod-2AM fluorescence optical density. C. Pearson's co-localization analysis between Mitotracker Green and Rhod-2 AM. D.Quantitative analysis of mitochondria ATP levels in various groups. E.Quantitative analysis of mitochondria Complex V activity levels in HK-2 cells. *P < 0.05 vs. LG group, **P<0.05 vs. HG + TGF-β group, #P<0.05 vs. HG + TGF-β+ Pari group, the values were reported as the mean ± SD (n), n = 6. F. Western blot analysis of SERCA2 protein expression in HK-2 cells. G. Western blot analysis of SERCA2 protein expression in renal tissue. H. Quantitative analysis of Western blot results in vitro. *P < 0.05 vs. LG group, **P<0.05 vs. HG + TGF-β group, n = 3. I. Quantitative analysis of Western blot results in vivo, *P < 0.05 vs. control group, **P<0.05 vs. STZ group, the values were reported as the mean ± SD (n), n = 3. J. CO-IP analysis of Mfn2 interacting with SERCA2. K. Confocal microscopy analysis of SERCA2 and Mfn2 expression in HK-2 cells (magnification × 630, scale bar: 5 μm). L-M. Quantifiaction analysis of SERCA2 and Mfn2 fluorescence optical density. N. Pearson’ s co-localization analysis between SERCA2 and Mfn2, *P < 0.05 vs. LG group, **P<0.05 vs. HG + TGF-β group, #P<0.05 vs. HG + TGF-β+Pari group, the values were reported as the mean ± SD (n), n = 6. (For interpretation of the references to color in this figure legend, the reader is referred to the Web version of this article.)
Fig. 9
Fig. 9
A regulatory effects summary of VDR on mitochondrial function in renal tubular cell under diabetic condition. HG stimulation significantly inhibited the expression of VDR, Mfn2, SERCA2 and mitophagy related factors (e.g. PINK1, Atg5, LC3II), but increased the expression of mitochondrial fission related factors (e.g. Drp1, Fis1). Down-regulated Mfn2 and SERCA2 could abolish the MAMs integrity and further inhibited mitophagy. Activated VDR could contribute to restore mitophagy via up-regulating of the expression of PINK1-Parkin, inhibit mitochondrial fission via down-regulating of the expression of Drp1, and restore MAMs integrity via modulation of the expression of Mfn2, SERCA2. While VDR-Mfn2-MAMs-Fundc1 pathway also could activate mitophagy. It indicated that regulation of VDR on mitochondrial function could present a new therapeutic strategy for diabetic renal tubulointerstitial injury. (For interpretation of the references to color in this figure legend, the reader is referred to the Web version of this article.)

Similar articles

Cited by

References

    1. Shaw J.E., Sicree R.A., Zimmet P.Z. Global estimates of the prevalence of diabetes for 2010 and 2030. Diabetes Res. Clin. Pract. 2010;87:4–14. - PubMed
    1. Gilbert R.E. Proximal tubulopathy: Prime mover and key therapeutic target in diabetic kidney disease. Diabetes. 2017;66:791–800. - PubMed
    1. Zeni L., Norden A.G.W., Cancarini G., Unwin R.J. A more tubulocentric view of diabetic kidney disease. J. Nephrol. 2017;30:701–717. - PMC - PubMed
    1. Forbes J.M., Thorburn D.R. Mitochondrial dysfunction in diabetic kidney disease. Nat. Rev. Nephrol. 2018;14:291–312. - PubMed
    1. Yang S., Li A., Wang J., Liu J., Han Y., Zhang W., Li Y.C., Zhang H. Vitamin D receptor: a novel therapeutic target for kidney diseases. Curr. Med. Chem. 2018;25:3256–3271. - PMC - PubMed

MeSH terms