. 2024 Feb 5;59(3):415-430.e8.
doi: 10.1016/j.devcel.2023.12.010.

Direct reprogramming of non-limb fibroblasts to cells with properties of limb progenitors

Affiliations

Direct reprogramming of non-limb fibroblasts to cells with properties of limb progenitors

Yuji Atsuta et al. Dev Cell. .

Abstract

The early limb bud consists of mesenchymal limb progenitors derived from the lateral plate mesoderm (LPM). The LPM also gives rise to the mesodermal components of the flank and neck. However, the cells at these other levels cannot produce the variety of cell types found in the limb. Taking advantage of a direct reprogramming approach, we find a set of factors (Prdm16, Zbtb16, and Lin28a) normally expressed in the early limb bud and capable of imparting limb progenitor-like properties to mouse non-limb fibroblasts. The reprogrammed cells show similar gene expression profiles and can differentiate into similar cell types as endogenous limb progenitors. The further addition of Lin41 potentiates the proliferation of the reprogrammed cells. These results suggest that these same four factors may play pivotal roles in the specification of endogenous limb progenitors.

Keywords: Lin28a; Lin41; Pdrm16; Zbtb16; lateral plate mesoderm; limb bud; limb culture; limb progenitors; reprogramming.


Conflict of interest statement

Declaration of interests The authors declare no competing interests.

Figures

Figure 1
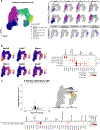
Figure 1. Overexpression of the factors that are present specifically in the limb bud induces expression of LPC genes in NonLF
(A) Schematics of HH15 and HH19 chicken embryos. Regions of embryos that were used for transcriptomic analyses are labeled. (B) Differential expression analyses (MA-plot) of core gene set. Limb expression (average of forelimb [FL] and hindlimb [HL]) over neck or flank expression. Labeled points indicate genes with greater than two-fold overexpression in limb tissue. (C) Lin28a mRNA expression levels in FL, flank and HL of E9.5 mouse embryos were measured by qPCR (n = 6 each). (D) Optimization of culture conditions for FL progenitors from Prx1-CreGFP mouse embryos (Prx1-GFP+ LPC) by using hyaluronan (HA)-based hydrogels. The cultured LPC were stained with antibodies for GFP (green), Lhx2 (magenta) and Sall4 (white). Serum media was DMEM containing 10% FBS, and CFRSY media contained Chir99021, Fgf8, Retinoic acid, SB431542 and Y-27632. (E) Increasing ratio of cell number. Cell numbers in Day0 samples of each condition were counted immediately after seeding, and were considered as ratio 1 (n = 6 wells each). (F) Percentages for Prx1-GFP/Lhx2/Sall4-triple positive cells in cultures. (G) Diagrams illustrating procedures of the reprogramming experiment. Retrovirus particles carrying each factor of 18 candidates were pooled and used to infect Prx1-GFP-negative NonLF at Day0. After infection, the media was replaced with CFRY (Day2–4), subsequently with CFRSY (Day4–14). The infected NonLF were seeded in HA-gels at Day4. (H) The cells infected with no virus or 18 viruses were visualized by DAPI (blue). Dashed lines indicate outer edge of the hydrogel. Induced Prx1-GFP signals were seen in cell clusters (arrowheads). (I) Magnified images of the cell clusters. Sall4 proteins were observed in Prx1-GFP positive cells. (J) Relative expression levels of LPC-specific genes were quantified by qPCR (n = 4 for NonLF, n = 3 for +18 factors). The numbers in plots show P values obtained using one-way ANOVA (F) or a two tailed T-test (J). Error bars represent SD. Scale bars, 100 μm in (D, I), 1 mm in (H).
Figure 2
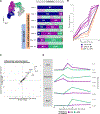
Figure 2. Identification of a minimal set of the reprogramming factors essential for imparting LPC-like properties on NonLF
(A) Efficiency of Prx1-GFP induction was estimated as a GFP score by measuring GFP positive area per DAPI area. In 18–1 factor assay, each factor was withdrawn from the pools one by one (n = 4 gels each). GFP score for the 18 factor-group was 10.57. The measured DAPI- or Prx1-GFP-positive area was pseudocolored in red. (B, C) GFP scores of Lin28a+1 factor assay. Combination of Lin28a with Prdm16, Zbtb16 or both (+PZL) yielded the highest GFP score and induced Lhx2 (magenta) and Sall4 (white) as well as Prx1-GFP (green) (n = 3 each). (D, E) qPCR for LPC markers using controls (No virus), cells reprogrammed by PZL, and forelimb progenitors from E9.5 Prx1-GFP embryos (n = 3 each in D, n = 4 each in E). GFP-positive reprogrammed cells and LPC were FAC-sorted beforehand. The numbers in plots show P values obtained using one-way ANOVA (B, E). Error bars represent SD. Scale bars, 100 μm in (C), 1mm in (A).
Figure 3
Figure 3. Single-cell RNA-seq analyses reveal global transcriptomic similarity between the rLPC and endogenous LPC
(A) Left panel: UMAP plot of single-cell transcriptome profiles from NonLF in different conditions, primary LPC from different stages, LPC cultured for 8 days in 3-D limb culture condition, NonLF infected with empty control virus (Empty) or PZL (Prdm16+Ztbt16+Lin28a), sampled at different time points (Day=days after transgene expression, refer to Figure 5A). Each dot represents a single cell, colored according to graph-based clustering (leiden, resolution=0.2). The six clusters from graph-based clustering are annotated as NonLF Standard Culture (2-D), NonLF Limb Culture (2-D), NonLF Limb Culture (3-D), rLPC/LPC Limb Culture (3-D), LPC from E9-E9.5 (LPC [E9]), LPC from E10.0-E10.5 (LPC [E10]) based on the composition of source samples. Right panel: With the same embedding coordinates as the left panel, infected cells from same source are highlighted. The right bottom panel show reference source cell distribution as density plot in UMAP embedding. For convenience, the rLPC/LPC Limb Culture (3-D) cluster smoothened boundary is overlaid with dashed contours. Complete individual sample descriptions can be found in Table S1. (B) Left panel: Select gene expression levels of cells embedded in UMAP space. Levels in natural-log transformed, normalized by the total UMI counts per cell, maximal expression. Right panel: Dot plot of select genes by clusters. Circle size: fraction of cells expressing the gene for a cluster, color intensity: mean expression. Cluster names correspond to (A), with abbreviation for space. (C) Top left panel: Volcano plot comparing rLPC to LPC cultured for 8 days in 3-D limb culture condition, within the rLPC/LPC (Limb culture, 3-D) cluster. P-values were derived by pseudobulk aggregation by independent samples that were grown in 3-D culture condition, using Benjamini-Hochberg adjustment (rLPC: n=5, LPC: n=3). Red dotted two lines are threshold of adjusted p-value=0.01. All genes over 10 log-fold change, likely due to zero counts in one contrast, are put into infinity for better visualization. Top right panel: Cells highlighted for the differentially expressed gene analysis in top left. Bottom panel: Dot plot of patterning genes in the rLPC/LPC (Limb culture, 3-D) cluster.
Figure 4
Figure 4. Optimal transport analysis delineates transitions of reprogramming of the rLPC from NonLF
(A) Alluvial plot inferred by Waddington Optimal Transport (WOT) analysis. The width of each alluvial segment between time points represents the probability of transition of the group of cells from the earlier to later timepoint. The width incorporates the estimated growth rate of the destination cell cluster. Wider width than the initial starting point represents expansion (proliferation), narrower width contraction (cell death or stasis). All alluviums are colored by the final (Day 14) fate. Left inset: UMAP plot with cells used for the WOT analysis with the same cluster annotation as Figure 3A. The six states were abbreviated as NonLF Standard Culture (2-D)=N1, NonLF Limb Culture (2-D)=N2, NonLF Limb Culture (3-D)=N3, rLPC/LPC Limb Culture (3-D)=rLPC, LPC (E9)=E09, LPC (E10)=E10. (B) The divergence distances between fate trajectories constructed in (A), with the distance normalized to one at Day 14. Each line represents a pairwise comparison between trajectories defined by an independent reprogramming experiment, and colored based on the fate category (rLPC, the successful reprogramming fate trajectory or N3, the unsuccessful fate trajectory). (C) Differentially expressed genes between the inferred trajectory of successful reprogramming (rLPC) and unsuccessful reprogramming (N3) at 3 and 4 days after lentiviral infection. X and Y-axis represent the ratio between the fraction of cells that have the gene detected for a particular trajectory. Only genes that reached adjusted p-value cut-off of 0.01 for both days are plotted. Highlighted genes are genes that are found predominantly to one trajectory (Detected fraction ratio above 4). Select genes above ratio 4 at Day 3 as well as Day 4 are labelled for reference. (D) Changes of mean expression levels of select differentially expressed genes at early stages weighted by the probability of the final fate inferred by WOT. Each dots represent trajectories defined by an independent reprogramming experiment, with the line the average value. Expression level natural-log transformed, normalized by the total UMI counts per cell.
Figure 5
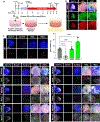
Figure 5. Addition of Lin41 to PZL stimulates proliferation of the rLPC
(A) Schematics illustrating the modified reprogramming experiment. GFP/tdTomato-negative NonLF from Prx1-GFP/tdTomato reporter mice were infected with tetO-lentiviruses carrying PZL and Lin41. Lentivirus carrying no transgene was used as Control. Doxycycline was administered during the culture. The cells overexpressing PZL or PZLL were seeded on Matrigel, and Prx1-GFP/tdTomato signals were examined at Day14. (B) GFP and tdTomato expression were investigated in a cross section of an E9.5 Prx1-GFP/tdTomato embryo, PZL- and PZLL-rLPC. (C) The number of pH3 signals was counted in E9.5 FL, Control, PZL- and PZLL-rLPC (n = 6 each). (D-I) LPC markers were detected in the rLPC. E9.5 mouse FL and NonLF were used as positive and negative control, respectively. In the MERGE panels for E9.5 FL and NonLF, DAPI and signals for a target protein were merged. For Control, +PZL and +PZLL groups, DAPI, Prx1-GFP/tdTomato and signals for the target were merged. Lhx2 (D), Sall4 (E), Nmyc (F), Tfap2c (G), Msx1/2 (H) and Meis1/2 (I) were induced in both PZL and PZLL-rLPC. The numbers in a plot show P values obtained using one-way ANOVA (C). Error bars represent SD. Scale bars, 100 μm in (B-E).
Figure 6
Figure 6. The rLPC exhibit differentiation potency in vitro
(A, B) Micromass cultures to test in vitro chondrogenesis capacity of the rLPC. Sox9 or Alcian blue positive clusters emerged from the reprogrammed cells. The number of Alcian blue positive clusters in NonLF and the reprogrammed cell groups were counted (n = 6 wells each). (C) qPCR analyses for Sox9, Agc1, Scx and Osr2 (n = 6 each). FL cells from E9.5 Prx1-GFP embryos were micromass-cultured as well and used as positive controls. (D) Hoxd13 gene expression levels were measured by qPCR. Samples were treated with or without Shh ligand (2 ng/μL) for 24 hrs (n = 3 for each group). The numbers in plots show P values obtained using a two tailed T-test (B-D). Error bars represent SD. Scale bars, 1 mm in (A, B).
Figure 7
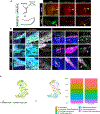
Figure 7. The rLPC exhibit differentiation potency in vivo
(A) E9.5 CAG-GFP mouse LPC, NonLF expressing mCherry and FAC-sorted tdTomato PZLL-rLPC were transplanted into HH20 chick FL buds. The grafted GFP-LPC and tdTomato-rLPC were seen in the HH32 limbs (yellow arrowheads), while mCherry-NonLF were not detectable (a black arrowhead). (B) The harvested HH32 limbs were sectioned and stained with Sox9, Collagen II (Col2) and Col1 antibodies. A fraction of the grafted LPC (n = 7 limbs) and tdTomato-rLPC marked by yellow arrowheads (n = 3 limbs) were positive for each marker. (C) Left panel: UMAP plot of single-cell transcriptomes of grafted cells, colored by source (rLPC or fresh LPC, left), or by cell type based on graph-based cluster annotation (leiden, resolution=0.4). Right panel: Composition of the grafted cells by source and cell type. Scale bars, 100 μm in (B), 1 mm in (A).

References

    1. Gros J, and Tabin CJ (2014). Vertebrate limb bud formation is initiated by localized epithelial-to-mesenchymal transition. Science 343, 1253–1256. 10.1126/science.1248228. - DOI - PMC - PubMed
    1. Takeuchi JK, Koshiba-Takeuchi K, Suzuki T, Kamimura M, Ogura K, and Ogura T (2003). Tbx5 and Tbx4 trigger limb initiation through activation of the Wnt/Fgf signaling cascade. Development 130, 2729–2739. 10.1242/dev.00474. - DOI - PubMed
    1. Cohn MJ, Izpisúa-Belmonte JC, Abud H, Heath JK, and Tickle C (1995). Fibroblast growth factors induce additional limb development from the flank of chick embryos. Cell 80, 739–746. 10.1016/0092-8674(95)90352-6. - DOI - PubMed
    1. Ohuchi H, Nakagawa T, Yamauchi M, Ohata T, Yoshioka H, Kuwana T, Mima T, Mikawa T, Nohno T, and Noji S (1995). An additional limb can be induced from the flank of the chick embryo by FGF4. Biochem. Biophys. Res. Commun 209, 809–816. 10.1006/bbrc.1995.1572. - DOI - PubMed
    1. Vogel A, Rodriguez C, Izpisúa-Belmonte JC (1996). Involvement of FGF-8 in initiation, outgrowth and patterning of the vertebrate limb. Development 122, 1737–1750. 10.1242/dev.122.6.1737. - DOI - PubMed

Publication types