. 2024 Feb 15;187(4):931-944.e12.
doi: 10.1016/j.cell.2024.01.024. Epub 2024 Feb 5.

A synthetic differentiation circuit in Escherichia coli for suppressing mutant takeover

Affiliations

A synthetic differentiation circuit in Escherichia coli for suppressing mutant takeover

David S Glass et al. Cell. .

Abstract

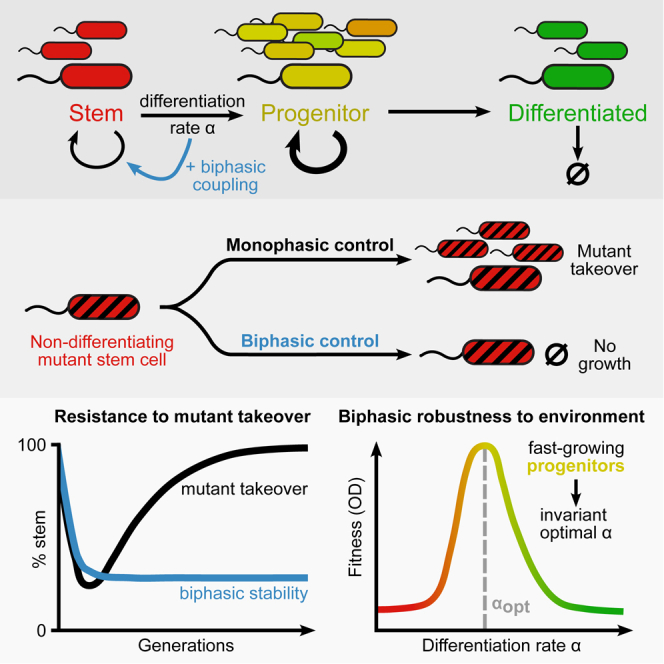
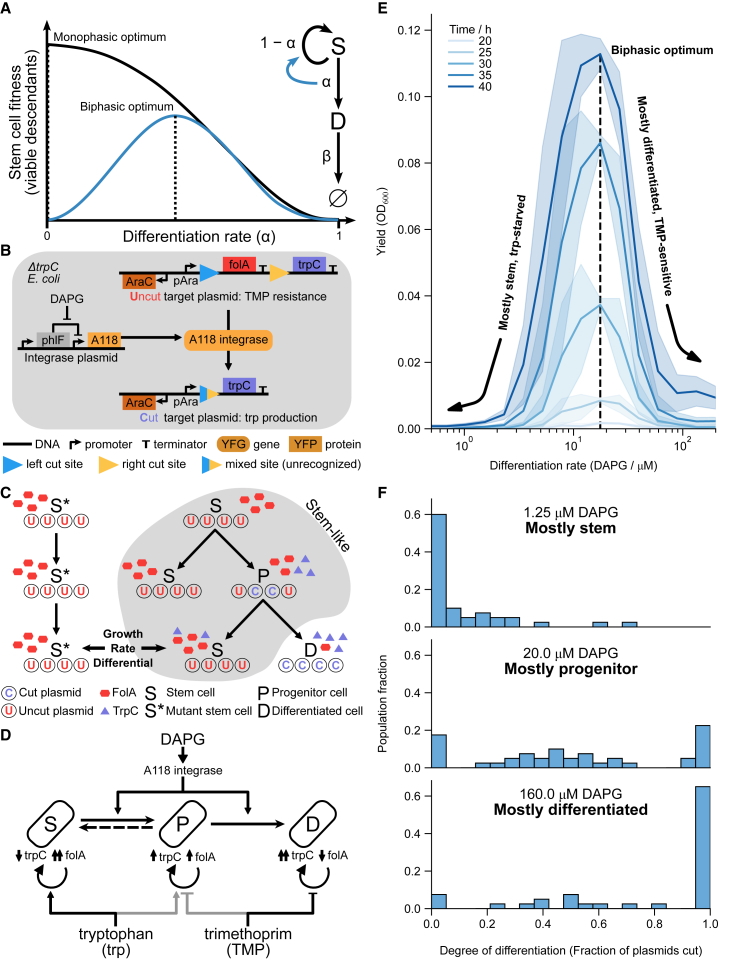
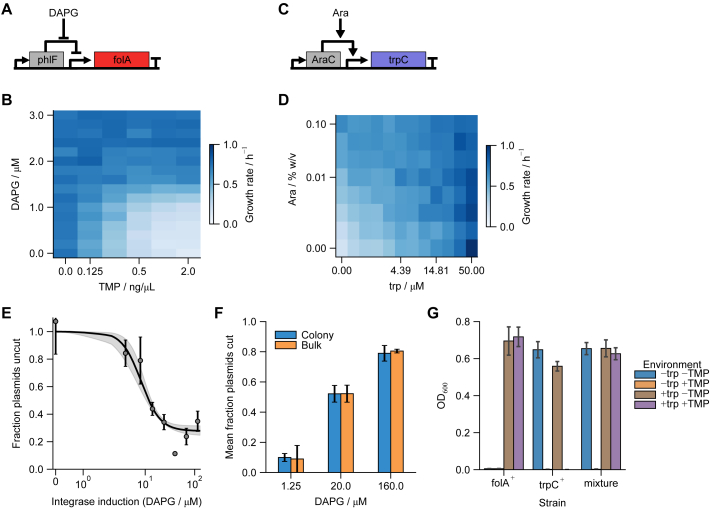
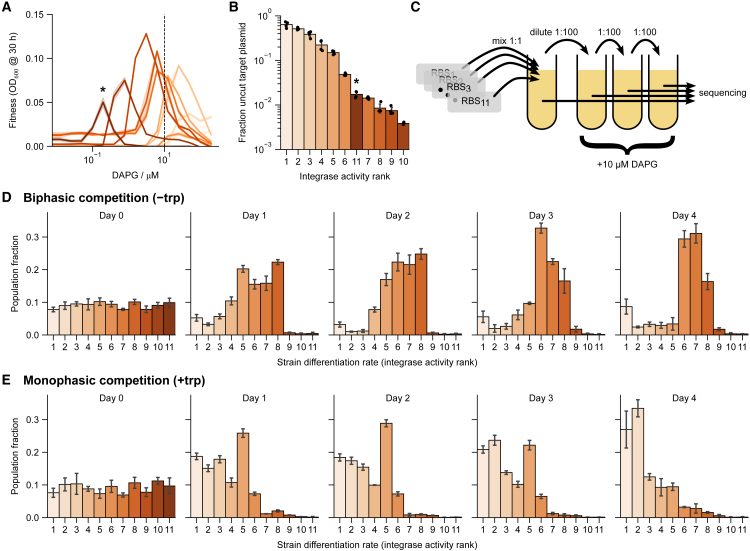
Differentiation is crucial for multicellularity. However, it is inherently susceptible to mutant cells that fail to differentiate. These mutants outcompete normal cells by excessive self-renewal. It remains unclear what mechanisms can resist such mutant expansion. Here, we demonstrate a solution by engineering a synthetic differentiation circuit in Escherichia coli that selects against these mutants via a biphasic fitness strategy. The circuit provides tunable production of synthetic analogs of stem, progenitor, and differentiated cells. It resists mutations by coupling differentiation to the production of an essential enzyme, thereby disadvantaging non-differentiating mutants. The circuit selected for and maintained a positive differentiation rate in long-term evolution. Surprisingly, this rate remained constant across vast changes in growth conditions. We found that transit-amplifying cells (fast-growing progenitors) underlie this environmental robustness. Our results provide insight into the stability of differentiation and demonstrate a powerful method for engineering evolutionarily stable multicellular consortia.

Keywords: differentiation; fitness landscape engineering; multicellular consortia; progenitors; robustness; stem cell niche; stem cells; synthetic biology; synthetic development; synthetic multicellularity; transit-amplifying cells.


Conflict of interest statement

Declaration of interests The authors declare no competing interests.

Figures

None
Graphical abstract
Figure 1
Figure 1
Synthetic differentiating E. coli with biphasic control yields a fitness curve with a non-zero optimal differentiation rate (A) Schematic of biphasic and monophasic differentiating circuits. Stem cells (S) differentiate at a rate α into differentiated cells (D) or self-renew at rate 1α. Because D dies at a rate β, while S does not, differentiation is inherently disadvantageous. In the monophasic case, zero differentiation (α=0) yields the maximum fitness. In the biphasic case, wherein stem cells reap a benefit from differentiation, a non-zero differentiation rate α>0 yields optimum fitness. (B) Molecular detail of the biphasic differentiation circuit. Integrase, expressed in all cells, irreversibly cuts a target plasmid, removing trimethoprim resistance gene folA and simultaneously inducing the expression of the essential tryptophan-producing eznyme trpC. (C) Population-level design of the differentiation circuit. Due to random replication and segregation of plasmids, progenitors can give rise to genetically “pure” stem cell descendants, which nonetheless inherit tryptophan and trpC in their cytoplasm. Such recently differentiated stem cells have a fitness advantage over non-differentiating, “mutant” stem cells S, which have no tryptophan. (D) The circuit design has three primary experimental knobs controlled by external factors DAPG, trp, and TMP. DAPG induces the integrase expression that differentiates S to P to D. Some reversibility of P to S (dashed arrow) is possible due to random plasmid segregation (see [C]). S, P, and D growth can be tuned differentially by external trp and TMP due to their differing expression of trpC and folA. (E) The engineered strain shows a biphasic fitness curve as a function of differentiation rate, as induced via DAPG, in low-trp (1.56 μM) high-TMP (25 ng/μL) media. Shaded areas are standard deviations across three replicates on separate days. (F) Measurement of fraction of cut plasmids per cell at 48 h (see STAR Methods) supports the picture in (C), with progenitor states having the highest fitness. Concentrations of trp and TMP as in (E). See also Figure S1.
Figure S1
Figure S1
Monotonically increasing the integrase activity controls antagonistic effects of trpC and folA to give cell-autonomous biphasic differentiation, related to Figure 1 (A–D) Direct control of folA (A and B) and trpC (C and D) circuits and corresponding 2D input functions based on the induction of the two genes and exogenous levels of their environmental-pressure counterparts. The scale parameters KA and KW for simulation are approximately equal to the concentration that gives half-maximal growth rate at zero induction. Cultures were grown in M9 + 0.4% glucose. Values are means of 4 same-day repeats. Strains are MG1655 pDSG488 (A and B) and DSG1 pDSG467 (C and D). (E) Fraction of uncut plasmids decreases with increased induction by DAPG in low-trp (0.25 μM), high-TMP (10 ng/μL) culture (measured after 48 h growth). Curve is a fit of the data (assuming the point at 40 μM DAPG as an outlier) to the Hill function fraction=k0+(1k0)KnKn+DAPGn with k0=0.28±0.04, K=8.25±1.24, and n=2.24±0.61. Points are mean ± standard error across 4–6 replicates. Band represents the standard error on the fit. (F) The average across individual colonies of fraction cut plasmids (Figure 1F) matches the fraction cut plasmids measured in a sample of the culture pre-plating. Values are mean ± SEM across 40 colonies for the colony data and over two technical replicates (the two data points correspond to the edges of the error bars) for the bulk. (G) Cross-feeding is not significant. Strains expressing either folA or trpC under arabinose induction (MG1655 ΔtrpC pDSG546 or pDSG550) were grown in M9 + 0.4% glucose + 0.4% arabinose + 300 mM cAMP with the specified environment (± 200 μM trp ± 100 ng/μL TMP). Strains grew to a consistent final OD in permissive environments only. Co-culture of 1:1 mixtures of the strains failed to grow in the environment requiring both gene products (−trp +TMP). Bars ± caps are mean ± standard deviation across 4 replicate cultures.
Figure 2
Figure 2
Competition of biphasic strains with different differentiation rates selects for an intermediate differentiation rate (A) Eleven individual strains with different integrase RBSes of varying strengths each have their own biphasic fitness curve as a function of DAPG in low-trp (0.25 μM), high-TMP (10 ng/μL) media. Shifted peaks reflect optimization for different externally supplied DAPG. Shaded bands are standard deviations over 3 technical (same-day) repeats. Hue is consistent in subsequent panels to simplify comparison. (B) The differentiation rate of all strains at a single DAPG concentration (dashed line in A, 10 μM) was quantified and ranked based on the fraction of uncut plasmids in +trp media, reflecting integrase activity. Strain 11 (starred) appears out of place in this quantification due to extremely high integrase expression that resulted in a growth defect (Figures S2D and S2E; STAR Methods). (C) Competition was run by mixing equal concentrations of strains, diluting once per day, and sequencing the RBS region. (D) Competing the 11 strains in −trp +TMP media shows selection for the strains with intermediate-level differentiation rate at 10 μM integrase induction. (E) Repeating the competition in +trp +TMP media shows selection for low integrase induction. Error bars are standard deviations across 4 independent histories. See also Figure S2. Growth conditions in (B), (D), and (E) are in high TMP (500 ng/μL). In (B) and (E), this was supplemented with 385 μM trp. In (D), initial Day 0 culture was supplemented with 0.25 μM trp (see STAR Methods).
Figure S2
Figure S2
Selection and ordering of competition strains, related to Figure 2 and STAR Methods (A) A total of 596 colonies of a randomized 6-nt RBS library were grown in −trp (0.25 μM) +TMP (10 ng/μL) conditions with 20 μM DAPG induction. Delayed logistic functions were fit to each strain to provide an estimated RBS rank (∼ 1/[lag × growth rate]). (B) Data from (A) for twelve chosen strains that gave a range of estimated RBSes. (C) The twelve chosen strains were grown in a range of DAPG concentrations to confirm shifted fitness peak location. The integrase plasmid of each one of these twelve was sequenced; one of the twelve (pDSG592) was determined to be a mixture of two strains and was removed from further experiments. This yielded the 11 strains used in the competition assays. (D) Integrase activity (fraction of cut plasmids at 10 μM DAPG, from Figure 2B) plotted versus the optimal DAPG concentration providing maximum yield (from Figure 2A). This shows the starred strain as a clear outlier. (E) Western blot of the integrase in all 11 strains at 10-μM DAPG. Although there is plenty of degradation in this western (top band in strain samples is at expected 55 kDa length), it is clear that the starred strain has by far the highest expression level. All samples were taken from mid-exponential-phase cultures with OD between 0.8 and 1.2 except the pDSG593 strain, with OD around 0.6 (implying an even higher level of expression than that was apparent in the blot). LD, Bio-Helix BLUEeye ladder. The myc-tagged parent strain (pDSG589), which has the same RBS as the BDEC strain, was included for comparison. (F) The ranked population fraction of each competed strain in biphasic conditions (Figure 2E) after competition highly correlates with how close the optimal DAPG concentration of the strain (Figure 2C) is to the concentration (10 μM) used in the competition assay. Distance is calculated as |log(DAPGmax/10μM)|. Population fraction rank is defined as the lowest rank for the highest population fraction. (G and H) Figures 2D and 2E plotted versus integrase activity (∼1/fraction of cut plasmids from Figure 2B) rather than rank, with strain 11 arbitrarily given integrase activity of 1,000.
Figure S3
Figure S3
Circuit behavior when placing target on bacterial artificial chromosome (BAC), related to Figure 3 (A–C) Heatmaps of (A) maximum yield, (B) nonmonotonicity, and (C) optimal differentiation rate as in Figures 3C–3E when the target plasmid is replaced with a bacterial artificial chromosome (∼1 copy/cell). Note that there is no growth in low-trp, high-TMP conditions. There is a sharp transition to no growth at sub-saturating trp levels and non-zero TMP, suggesting that cells never gain the benefit of both trp production from trpC and resistance generated by folA. This supports the idea that intermediate states are needed to generate progenitor cells that express both trpC and folA. Grayed areas reflect the fact that in the indicated conditions, no peak could be discerned, precluding the calculation of an optimal differentiation rate. Data are averages over 3 replicates on separate days.
Figure 3
Figure 3
Biphasic differentiation is robust to environmental conditions (A) Fitness curves with approximately saturating levels of trp and/or TMP show expected monotonically increasing, monotonically decreasing, biphasic, and flat trends (−trp = 1.56 μM, +trp = 25 μM, −TMP = 0 ng/μL, +TMP = 6.25 ng/μL). (B) Fitness curves were quantified by the peak fitness and corresponding optimal differentiation rate, as well as a measure of nonmonotonicity of the fitness curve (colors consistent with C–H). (C–E) Heatmaps show graded responses of yield and nonmonotonicity, but nearly constant optimal differentiation rate except in the complete absence of TMP. Concentrations of trp and TMP in (A) are marked by circles in (C), with line styles corresponding to the curves in (A). (F–H) An interchangeable-cell-type logistic growth model (STAR Methods) qualitatively reproduces the response of these three metrics. Color bars in (F)–(H) as in (C)–(E), respectively. (I) Model median and interquartile range of optimal differentiation rate (xopt) across all trp/TMP environments as a function of model parameters. Dashed lines reference the parameter values used in (F)–(H). Values in (A) and (C)–(E) are averages of repeats on 3 separate days. Bands in (A) are standard deviations over those repeats. See also Figures S3 and S4.
Figure S4
Figure S4
Predictions of fitness curves based on single-cell growth rates and extended data on parameter sweeps, related to Figure 3 (A) Growth rate μ for any given cell as a function of the fraction of cut plasmids x is directly calculated from Equation 5, which depends on the environmental trp (W) and TMP (A) concentrations, but not on DAPG (D). (B) Population distribution of cells with the number of cut plasmids x after 40 h is simulated from the model Equation 2 for a given DAPG level (here D=2.5). (C) Overall fitness is determined by summing the population frequency distribution (i.e., sum over distributions such as in (B) at 40 h. The fitness curve is calculated by repeating these calculations over a range of DAPG values. Fitness curves such as this are quantified in the main text by their maximum fitness, optimal differentiation rate, and nonmonotonicity. Simulations for (A)–(C) run for W=0, A=5, kc=0.1, kuc=10, kA0=1.25, and kW0=0.05, with other parameters as in Table S1. (D) Data on parameter sweeps for all three metrics in Figure 3. Each metric is normalized to its maximum value across all simulations, and then the median and interquartile range (IQR) are calculated. High values of kc, kuc, n, and alpha give low range (shaded bands) of optimal DAPG, while the maximum yield and nonmonotonicity are not low (which would indicate a non-growing culture or flat fitness curve, respectively). The same is true for low growth-rate “leakage” kW0 and kA0.
Figure S5
Figure S5
Fitness curves of version 2.0 strain with and without trp, related to Figure 5 Fitness curves show that the approximately optimal DAPG for the biphasic case (−trp = 0.25 μM) at ∼20-μM DAPG has barely any effect on the fitness of the monophasic (+trp = 385 μM) case. To provide a fitness challenge appropriate to the monophasic case, we used 50 μM DAPG in the dynamic range of its fitness curve. Curves measured at 50 ng/μL TMP as in Figure 5. Data are mean ± standard deviation across 3 same-day repeats.
Figure 4
Figure 4
Biphasic differentiation is maintained in long-term evolution but lost under strong selective pressure due to decoupling of the biphasic control (A) Schematic of the evolution experiment. The experiment was repeated in four independent histories (indicated by differing line styles in [B]–[D]) at 10 ng/μL TMP, supplemented in initial (Transfer 0) growth with 0.25 μM trp (see STAR Methods). Note that the difference in growth conditions compared with Figure 1 is minor (see Figure 3C). (B) Fraction of uncut plasmids (approximate number of stem cells) in an evolved culture does not change significantly over 4 weeks (∼160 generations) at moderate integrase induction (8 μM DAPG), appearing to reach a reproducible steady-state differentiation fraction. (C) Under high integrase induction (20 μM DAPG), the fraction of uncut plasmids approaches 1 within ∼1.5 weeks (∼45 generations) in 2 out of 4 histories, indicating a non-differentiating mutant with selective advantage. (D) Sequencing of evolved cultures from (C) indicates mutants increasing in abundance over the ∼1.5 weeks of the high-induction experiment in 3 out of 4 independent replicates. (E) Sequencing shows that the mutant simultaneously expresses both trpC (purple) and folA (red) via errant integrase action, which inverted (flipped) the folA and pAra promoters, while breaking the production of AraC (also present on the chromosome). Bands in (B) and (C) are standard deviations of two technical repeats. Error bars in (D) are bootstrapped from sequence counts (STAR Methods). Line styles in (B)–(D) refer to independent histories.
Figure 5
Figure 5
Flip-proof BDEC version 2.0 strain is resistant to mutant takeover (A) Schematic design as in Figure 1B of the version 2.0 circuit, showing replacement of the bidirectional promoter, which drove expression of both AraC and the target genes (trpC, folA) using a constitutive unidirectional promoter. (B) Fraction of uncut plasmids in evolution experiment as in Figure 4 in both biphasic (−trp +50 ng/μL TMP +20 μM DAPG) and monophasic (+385 μM trp +50 ng/μL TMP +50 μM DAPG) growth conditions (see also Figure S5). The initial (Transfer 0) biphasic growth was supplemented with 0.25 μM trp (see STAR Methods). (C) Sequencing of the cultures at transfer 13 showed that the monophasic cultures lost the entire integrase cassette. The same loss was found rarely in biphasic cultures, indicating that the mutation existed but was selected for only in monophasic conditions. (D) Distribution of the degree of differentiation of cells in the biphasic case at several time points shows that the cultures settled into a stable distribution that lasted for the entirety of the experiment. Error bands in (B) and error bars in (C) are standard deviations over 4 independent histories. See also Figure S5.

Similar articles

Cited by

References

    1. Packer J.S., Zhu Q., Huynh C., Sivaramakrishnan P., Preston E., Dueck H., Stefanik D., Tan K., Trapnell C., Kim J., et al. A lineage-resolved molecular atlas of C. elegans embryogenesis at single-cell resolution. Science. 2019;365:eaax1971. - PMC - PubMed
    1. Lander A.D., Gokoffski K.K., Wan F.Y.M., Nie Q., Calof A.L. Cell Lineages and the Logic of Proliferative Control. PLoS Biol. 2009;7:e15. - PMC - PubMed
    1. Buzi G., Lander A.D., Khammash M. Cell lineage branching as a strategy for proliferative control. BMC Biol. 2015;13:13. - PMC - PubMed
    1. Dao D.N., Kessin R.H., Ennis H.L. Developmental cheating and the evolutionary biology of Dictyostelium and Myxococcus. Microbiology (Reading) 2000;146:1505–1512. - PubMed
    1. Schulze J., Schierenberg E. Evolution of embryonic development in nematodes. EvoDevo. 2011;2:18. - PMC - PubMed

LinkOut - more resources