. 2024 Mar 25;34(6):1206-1221.e6.
doi: 10.1016/j.cub.2024.01.036. Epub 2024 Feb 5.

A revised conceptual framework for mouse vomeronasal pumping and stimulus sampling

Affiliations

A revised conceptual framework for mouse vomeronasal pumping and stimulus sampling

Christoph Hamacher et al. Curr Biol. .

Abstract

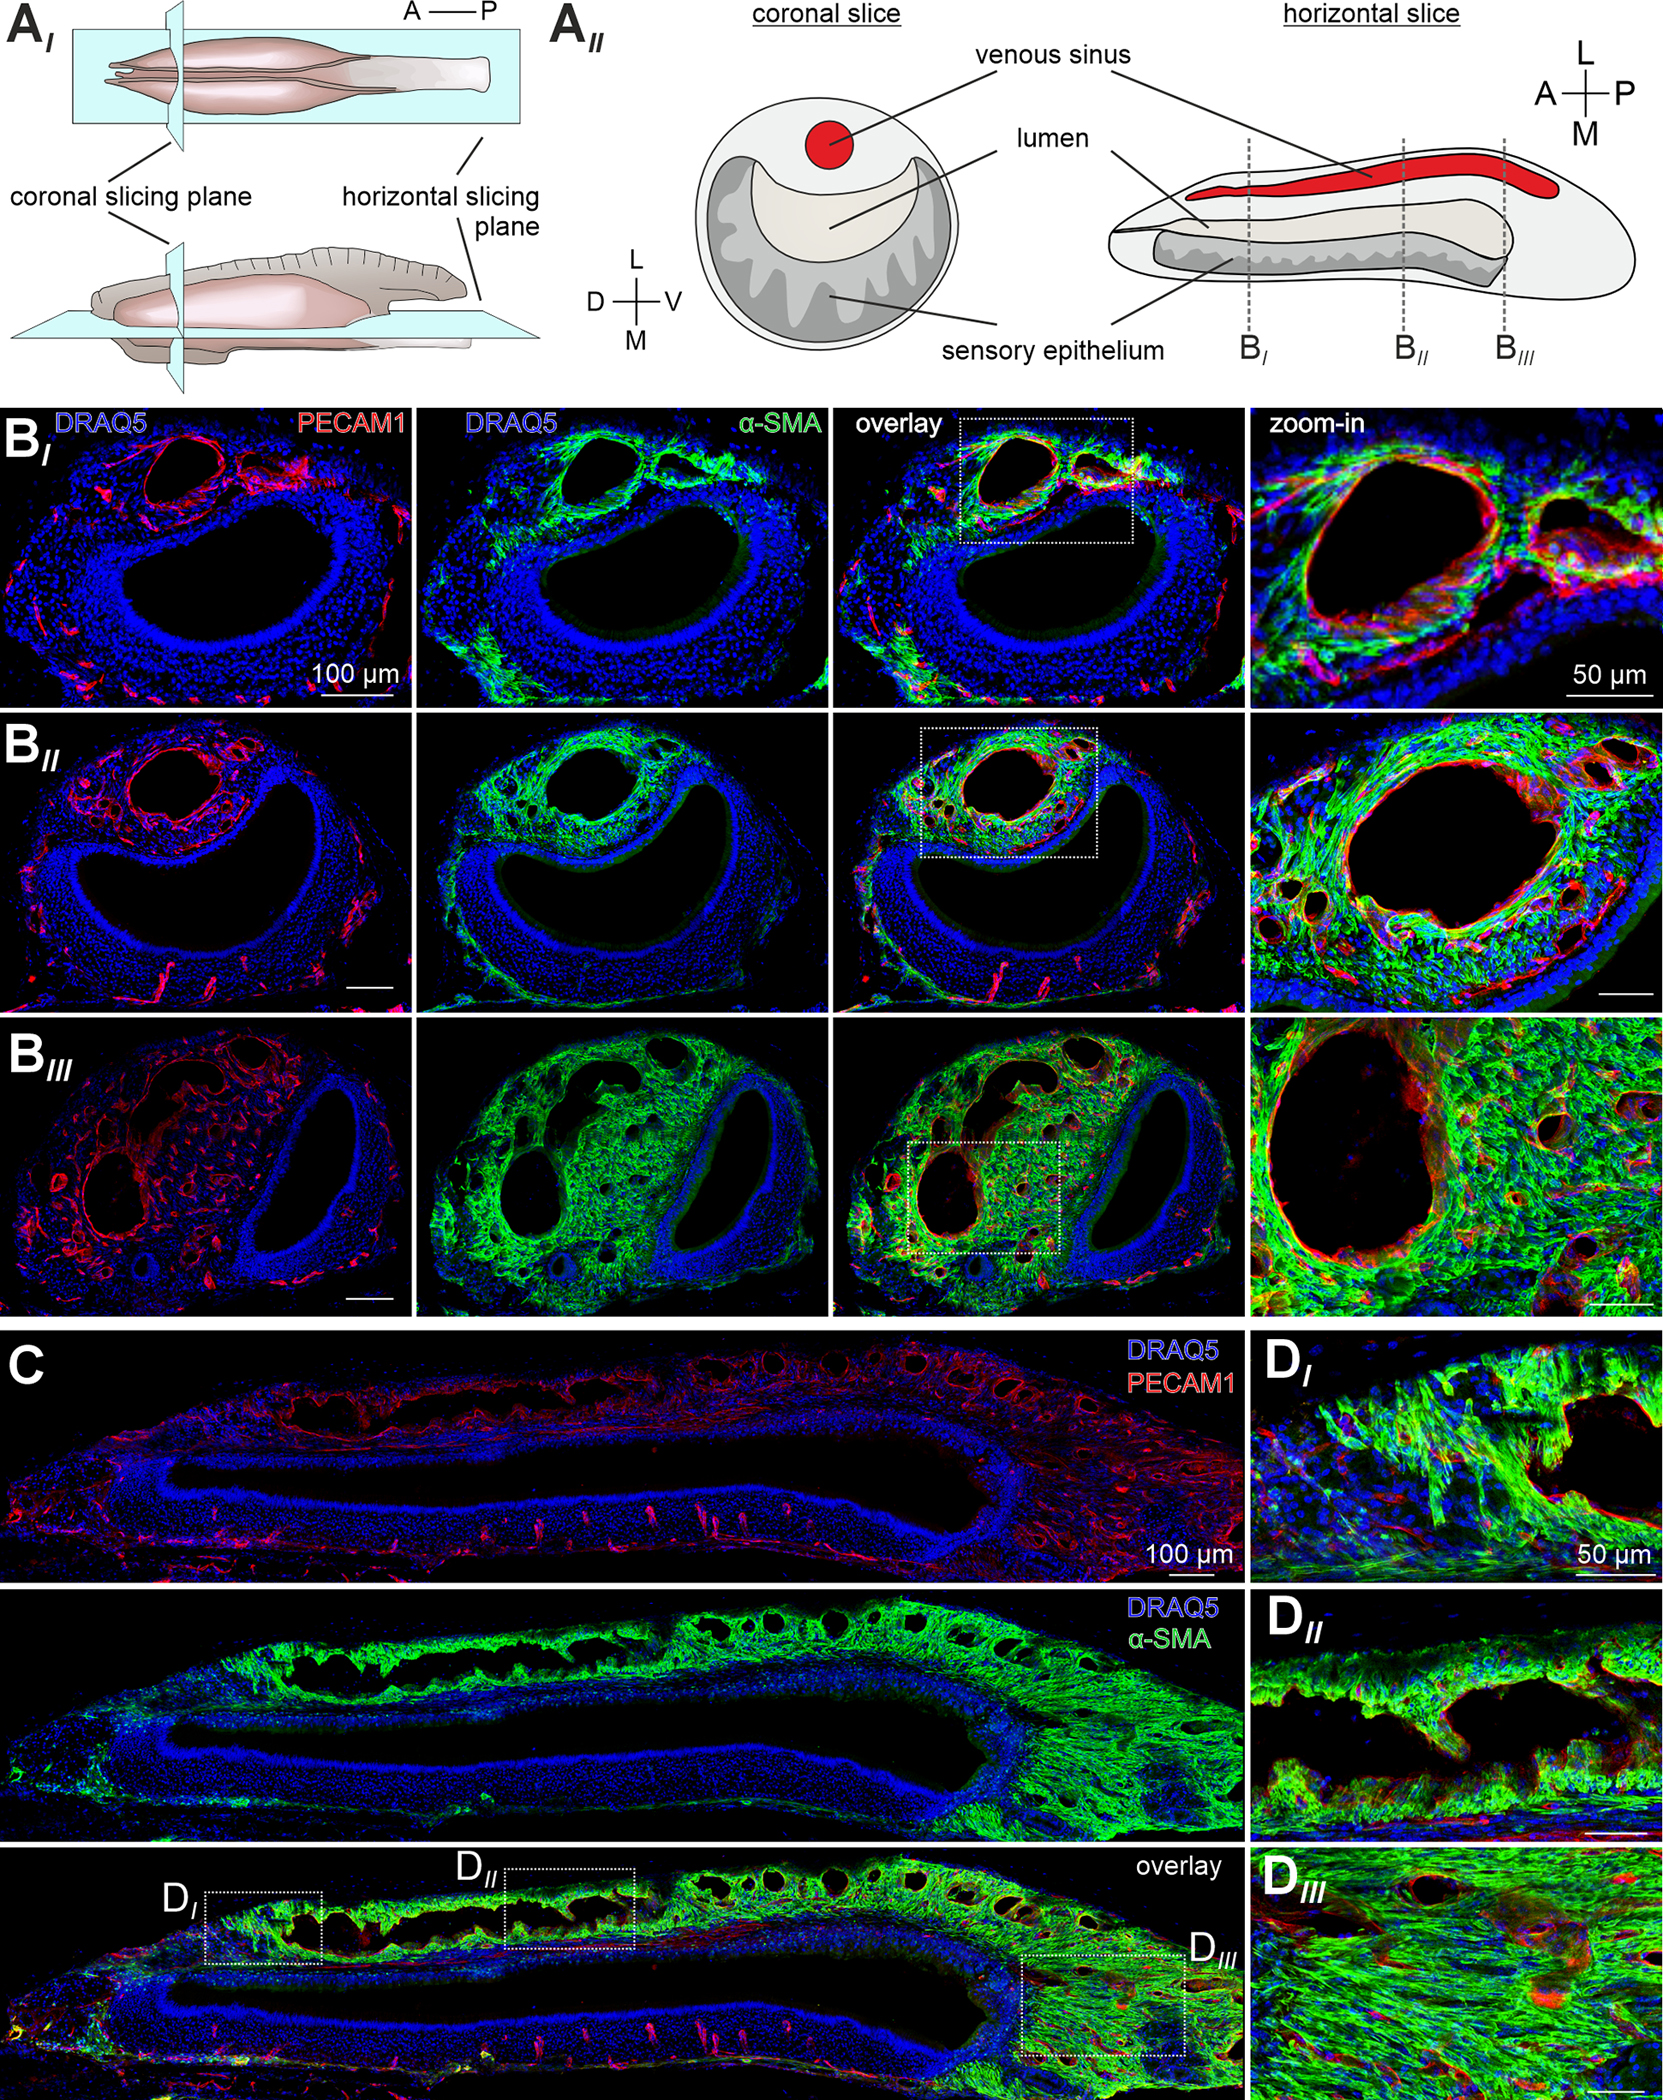
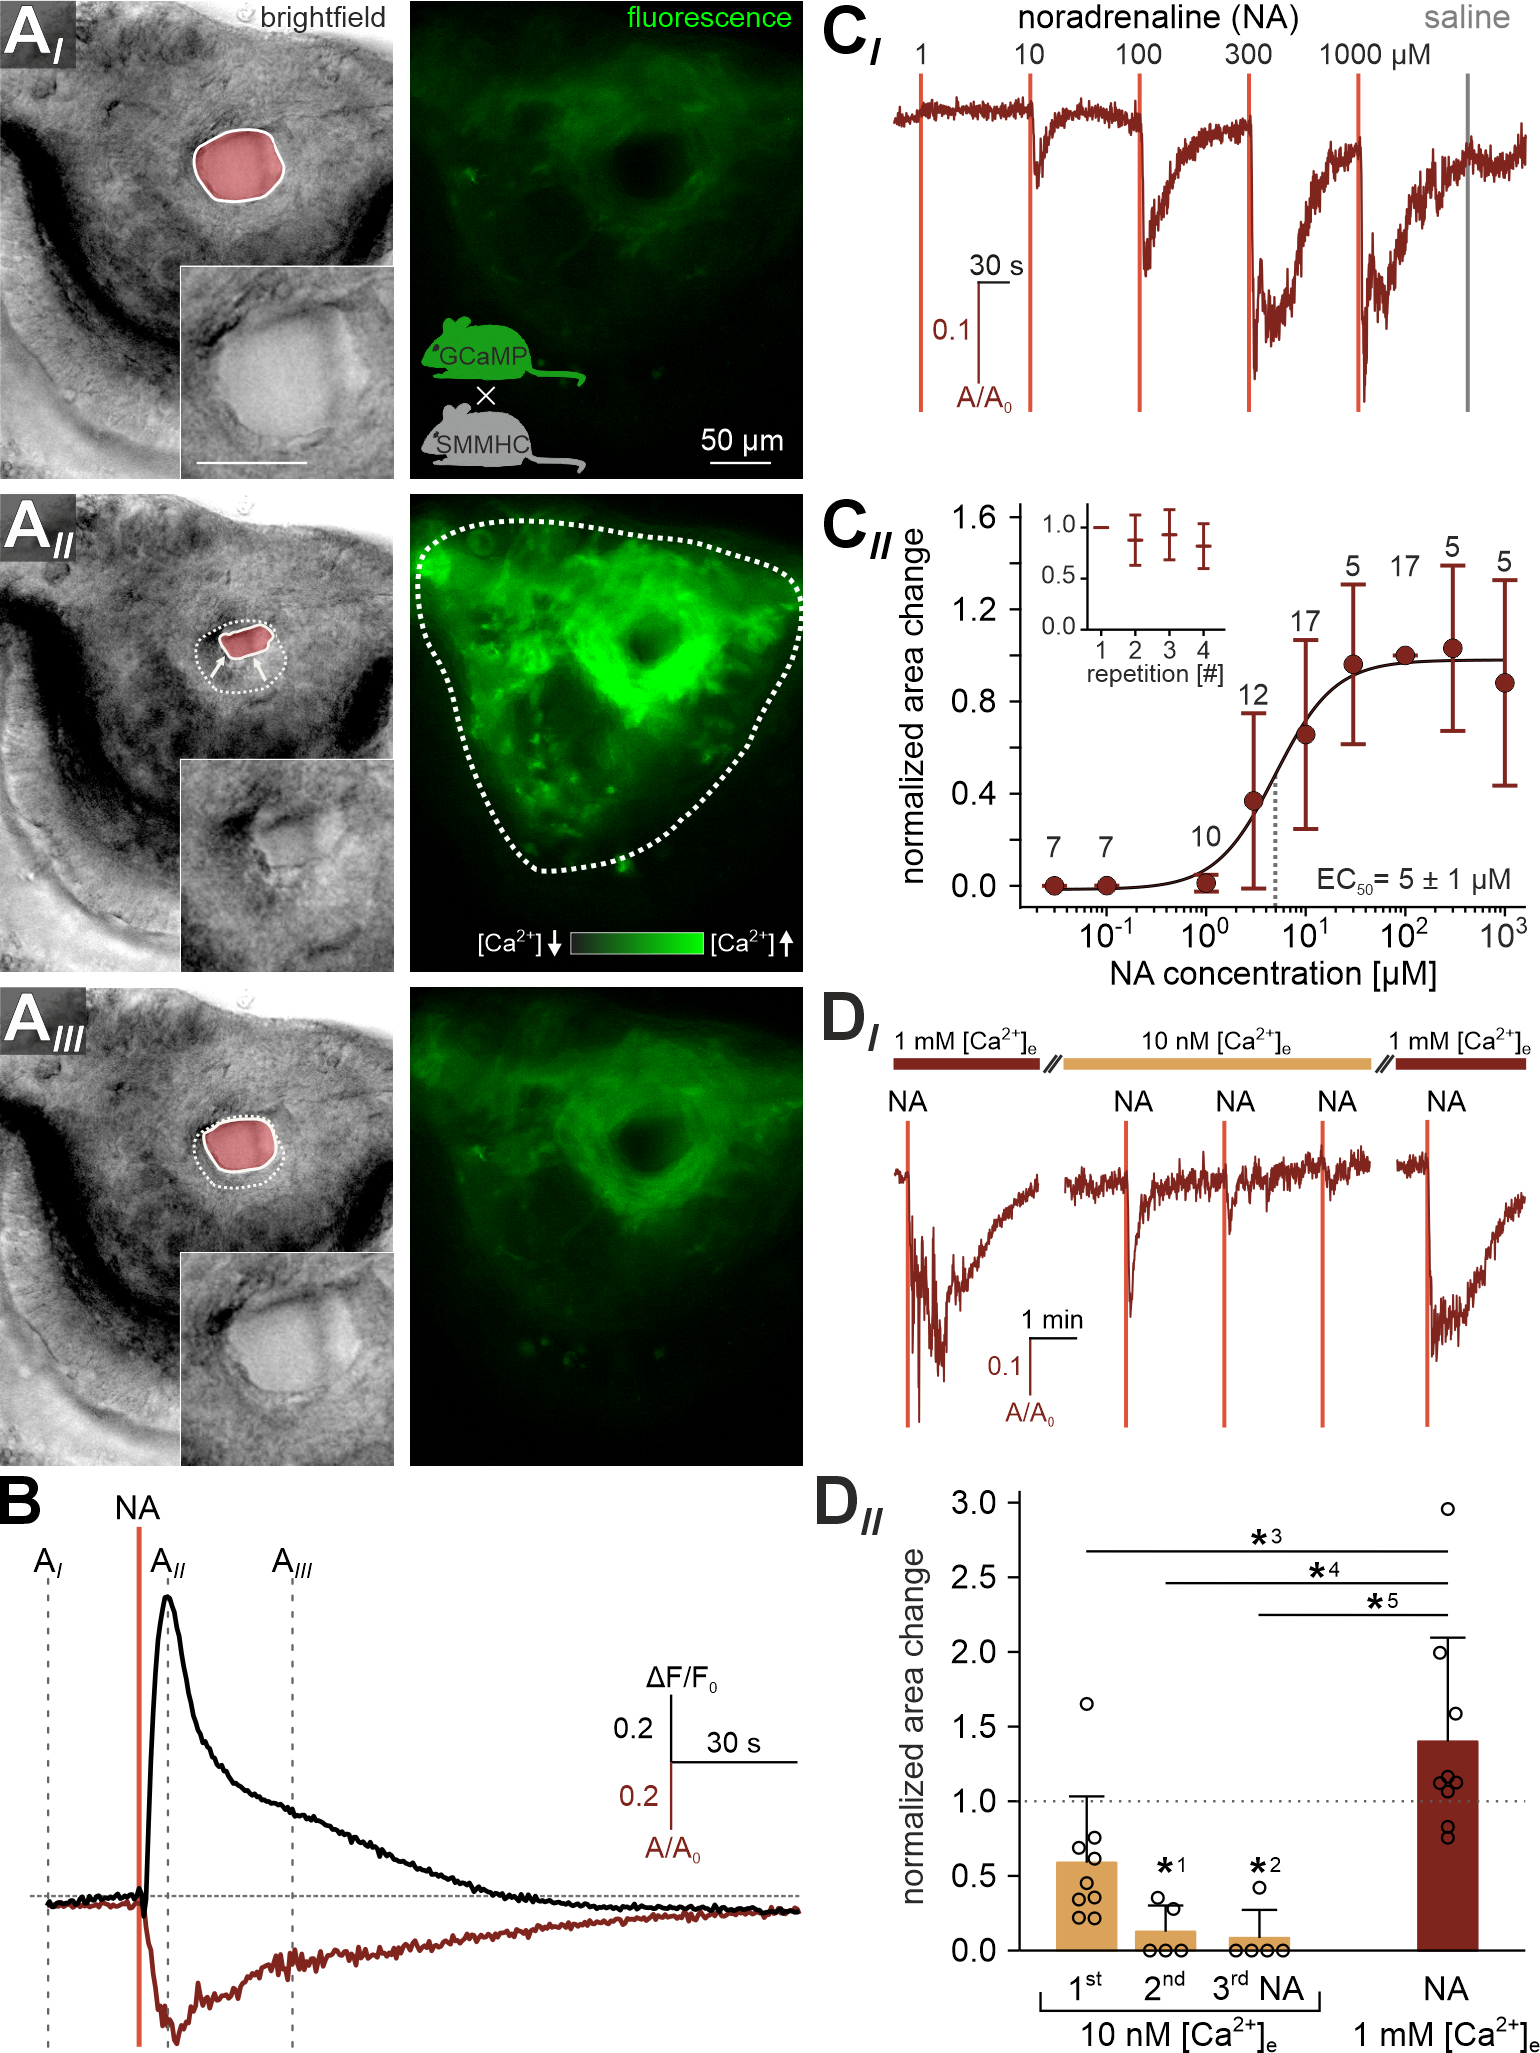
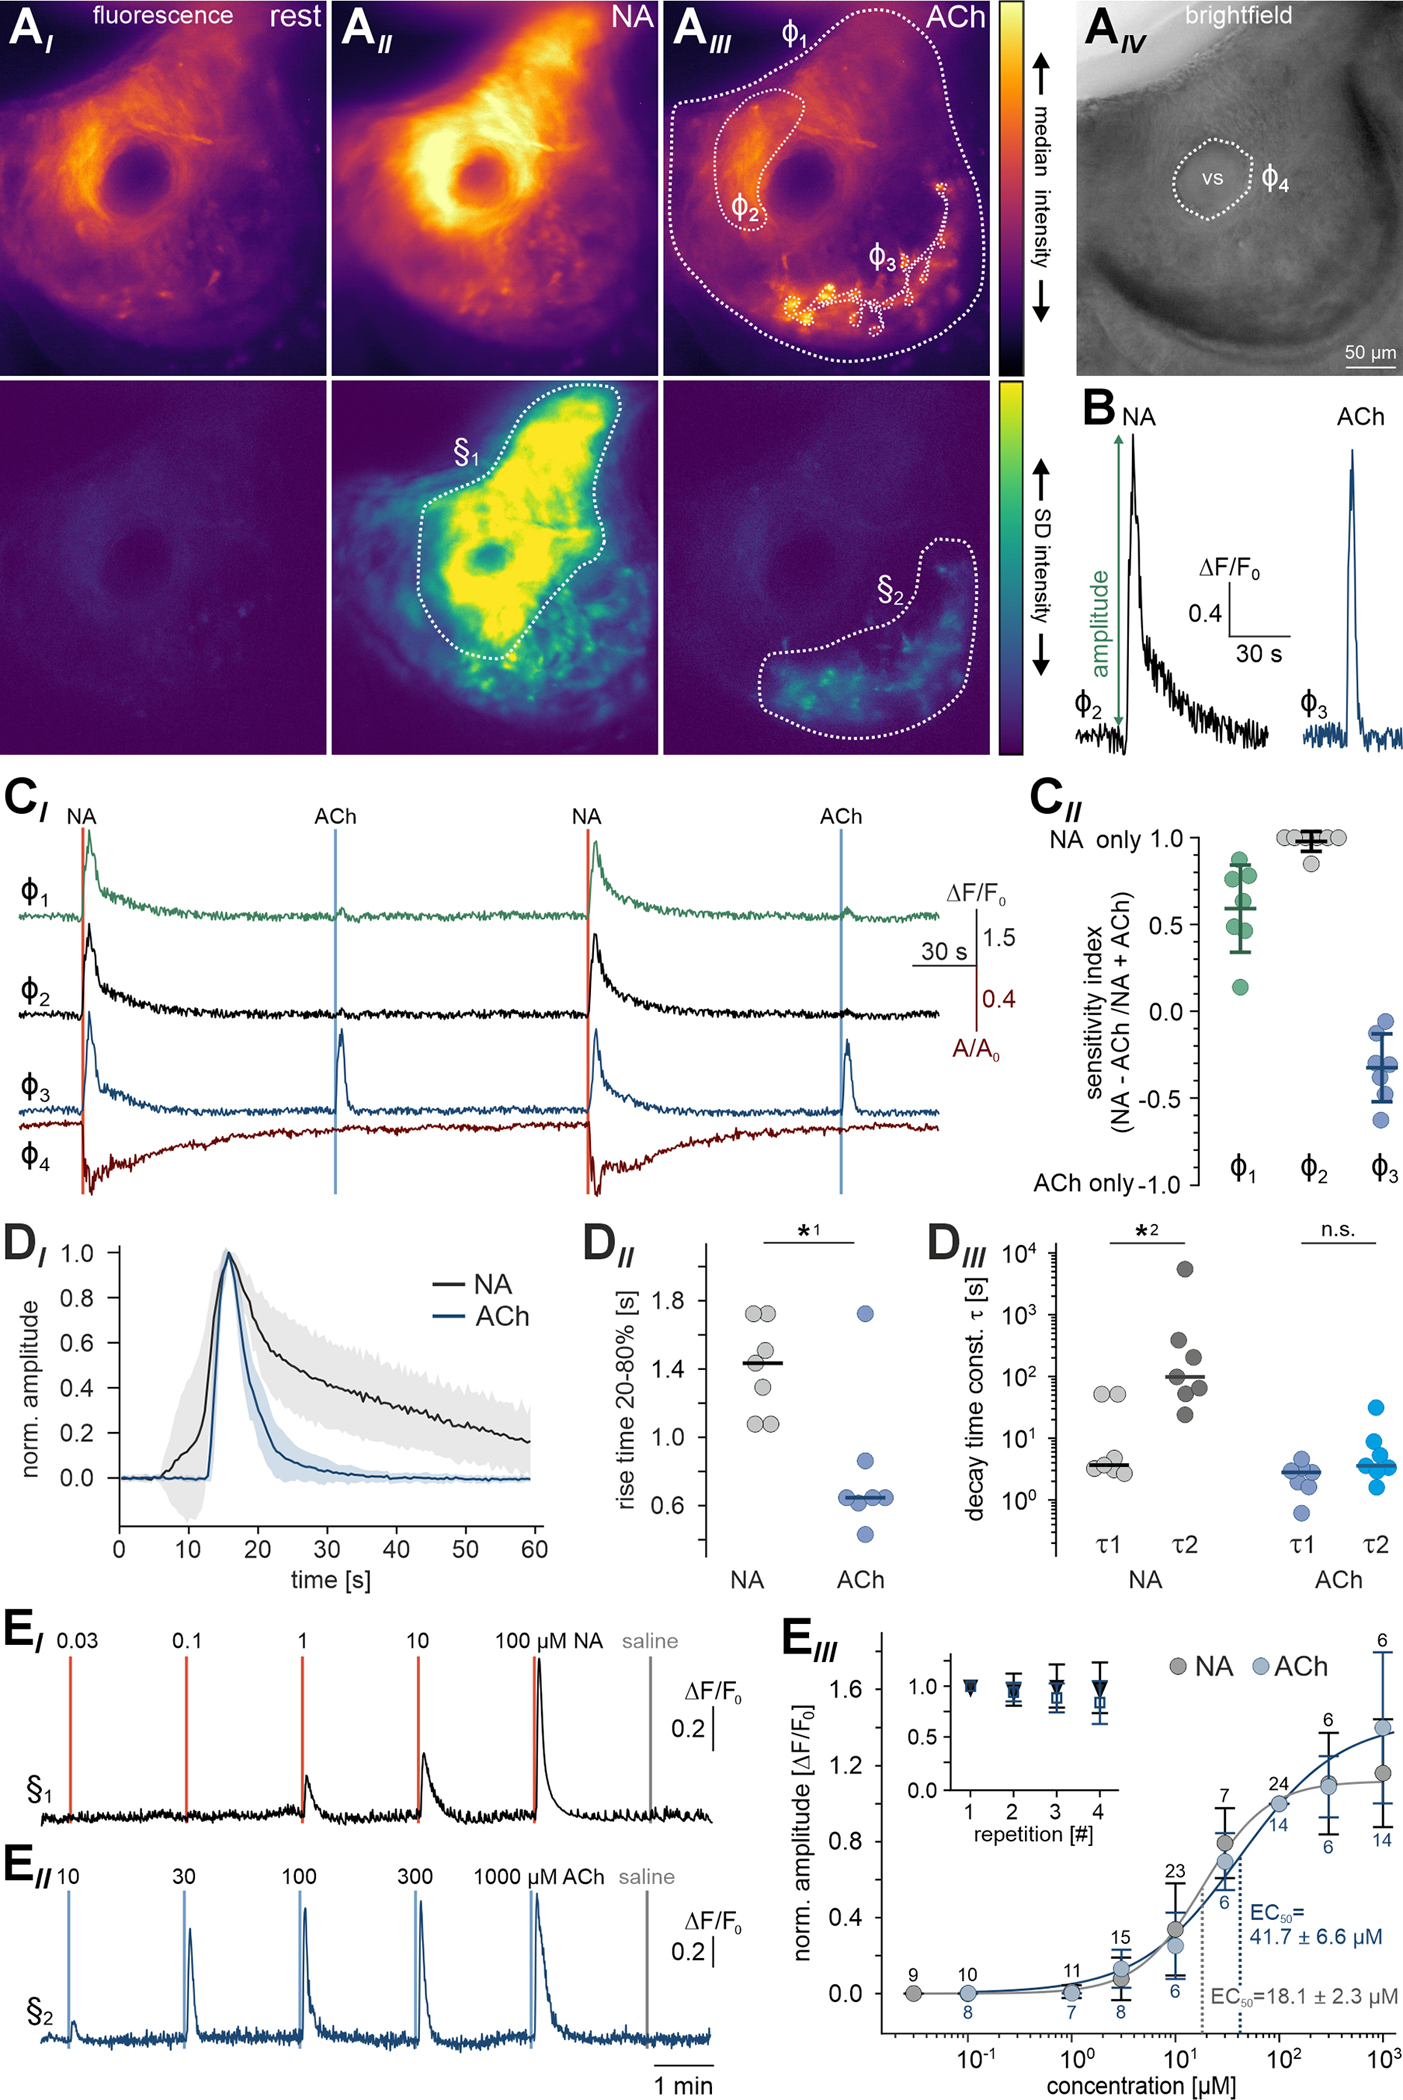
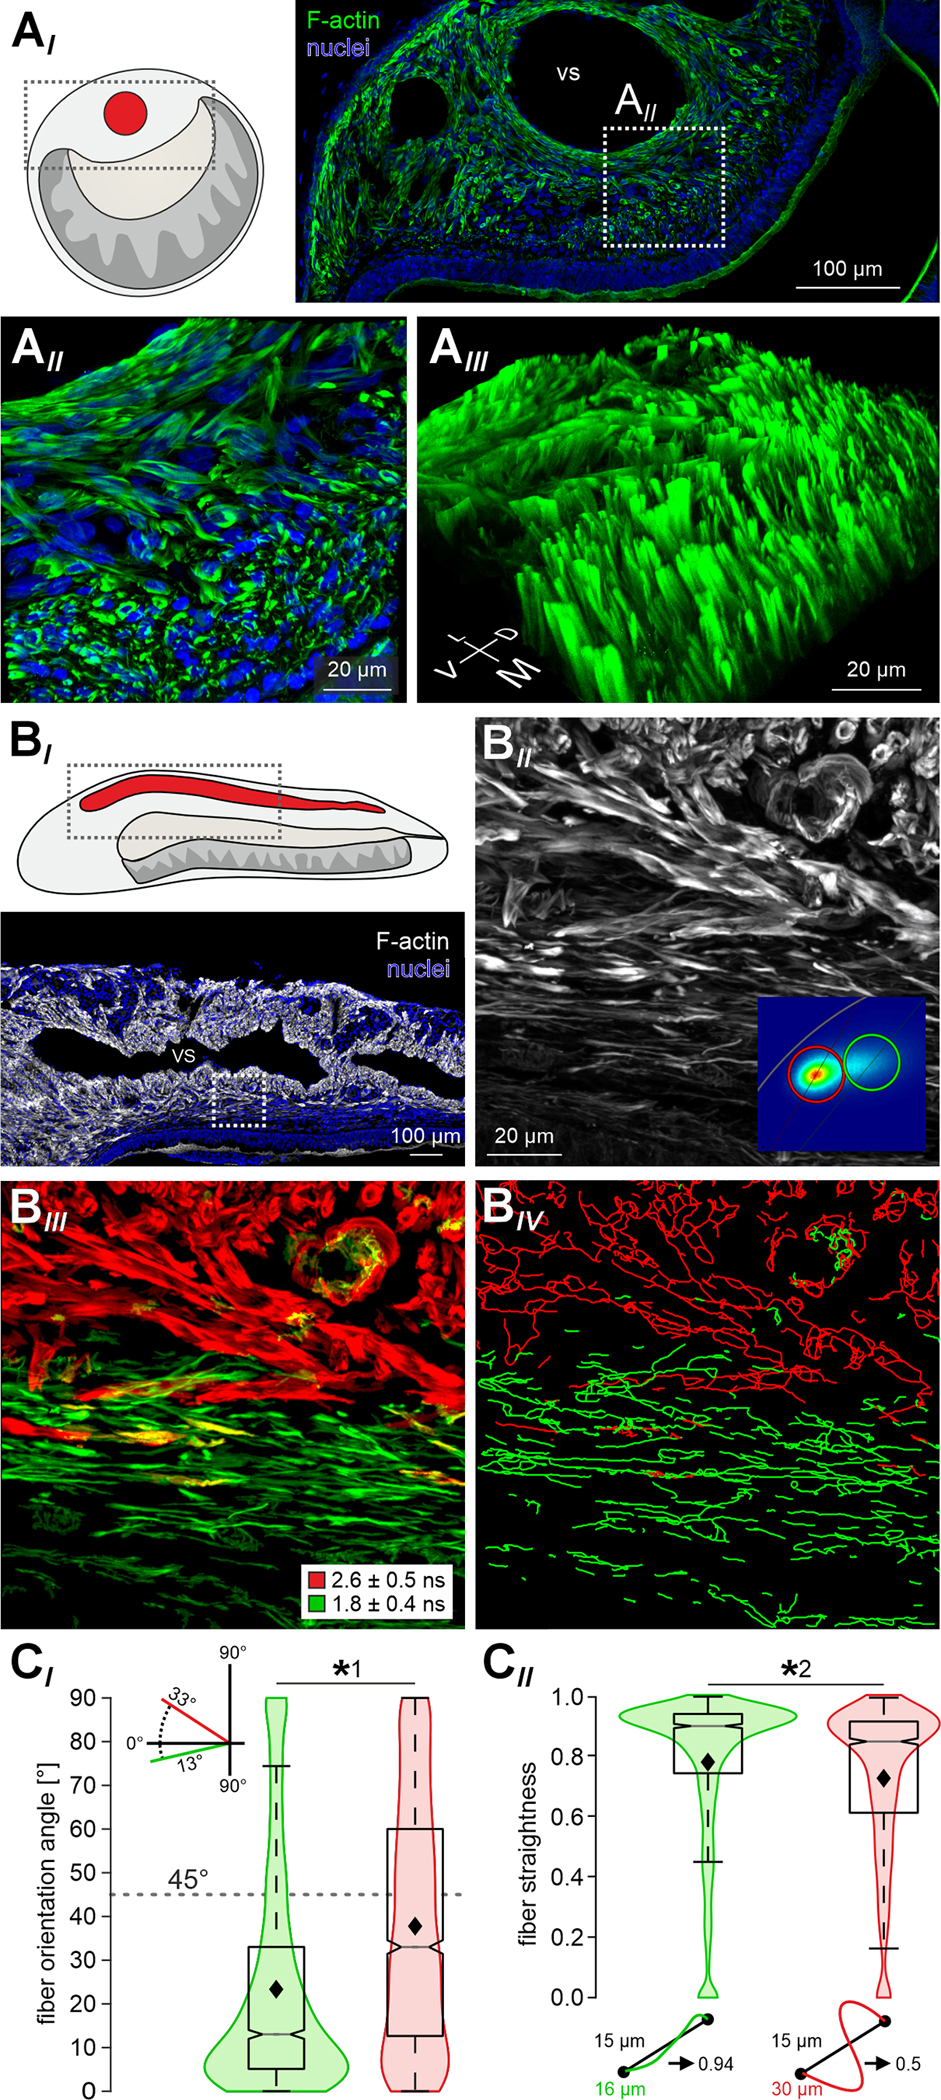
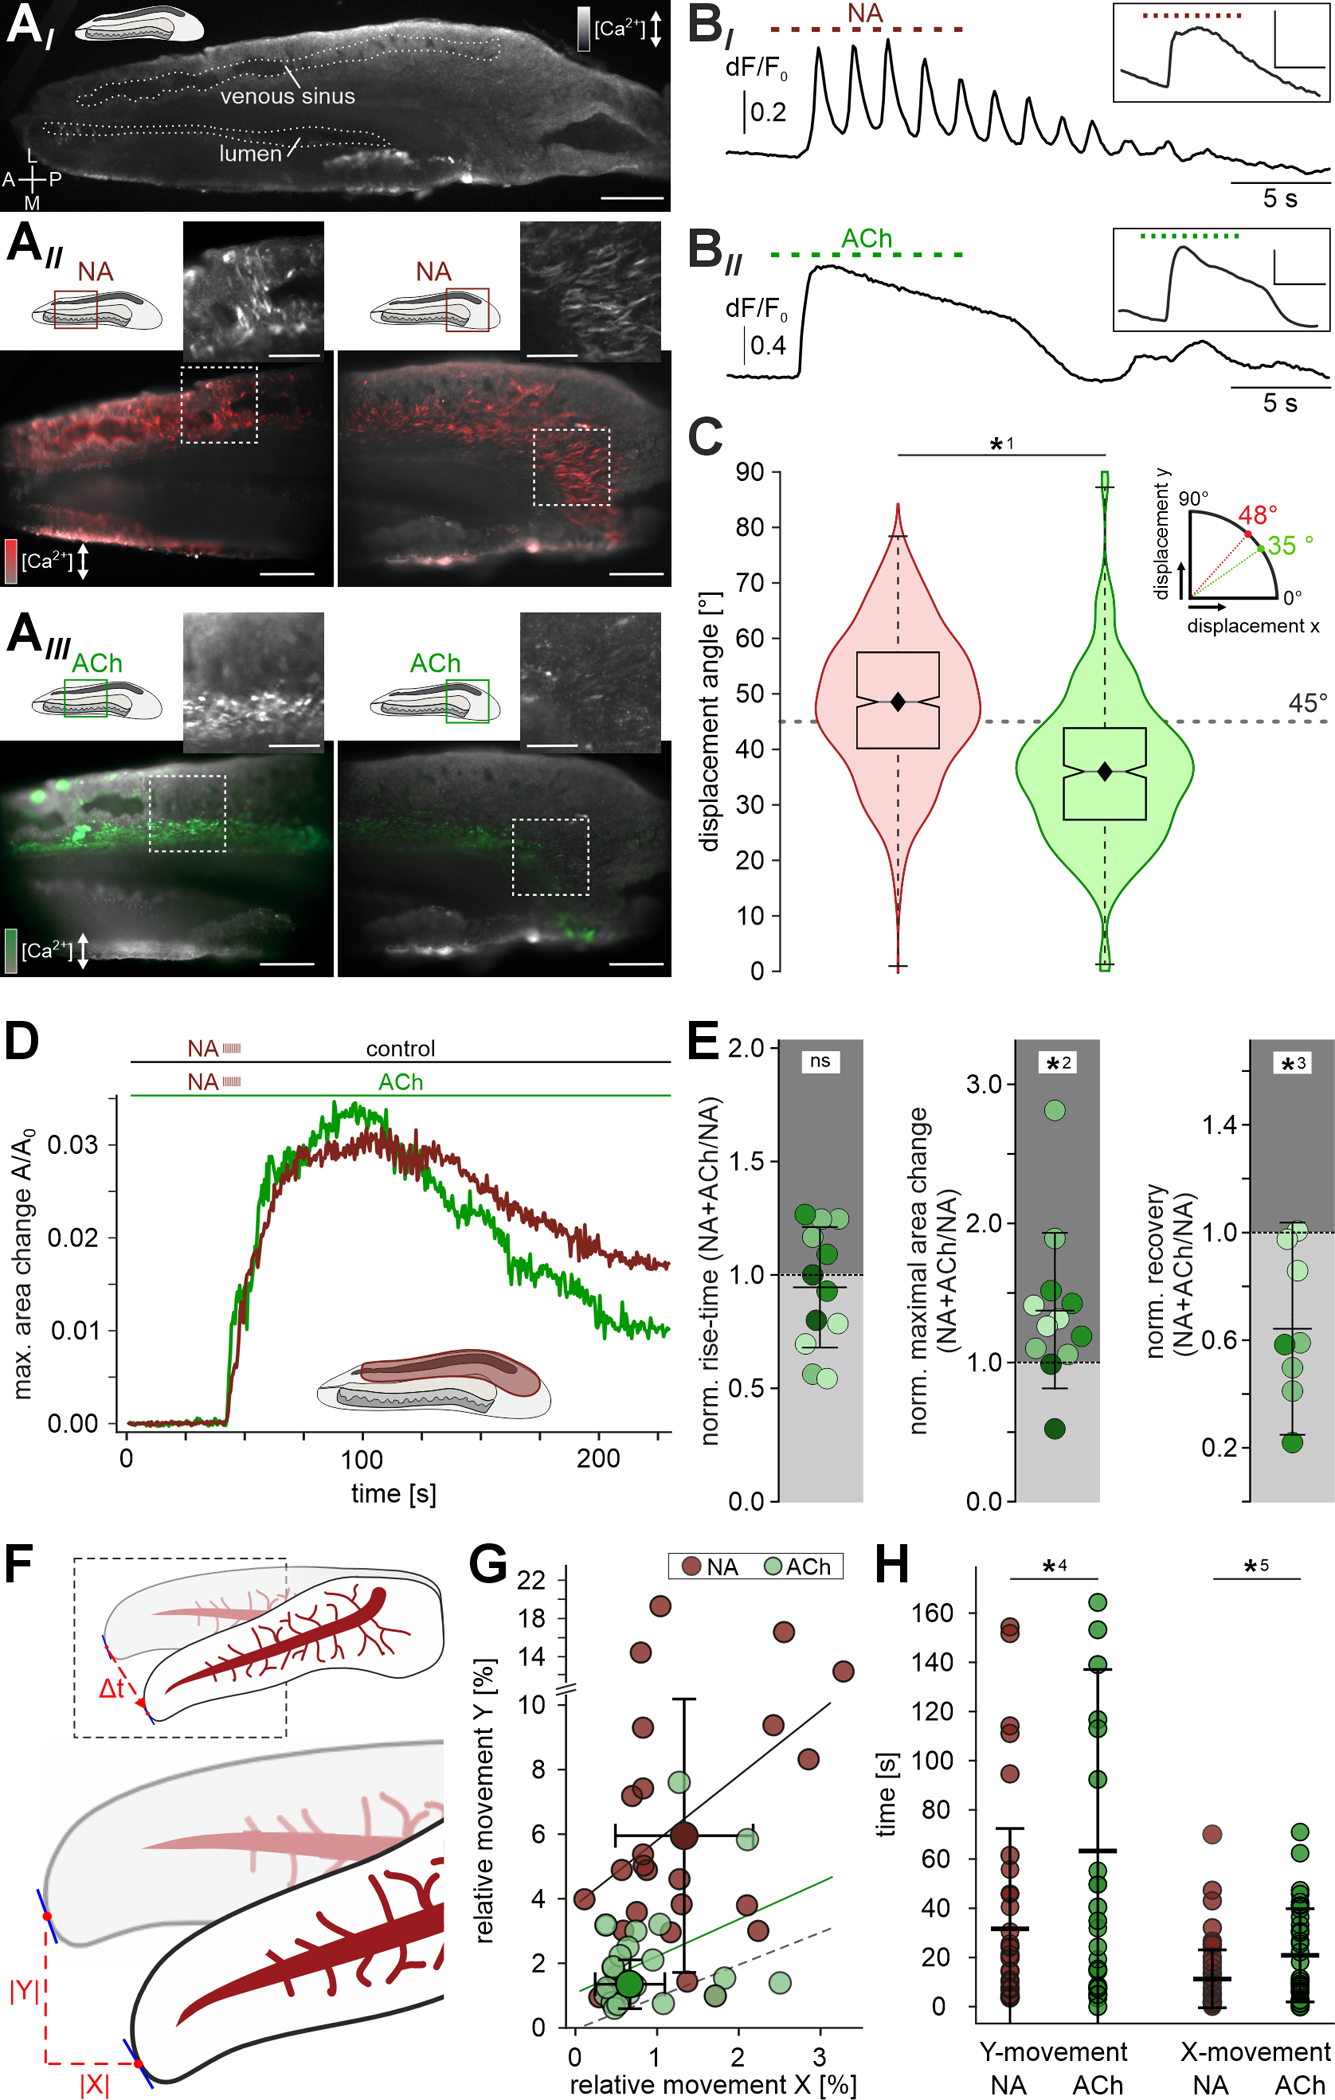
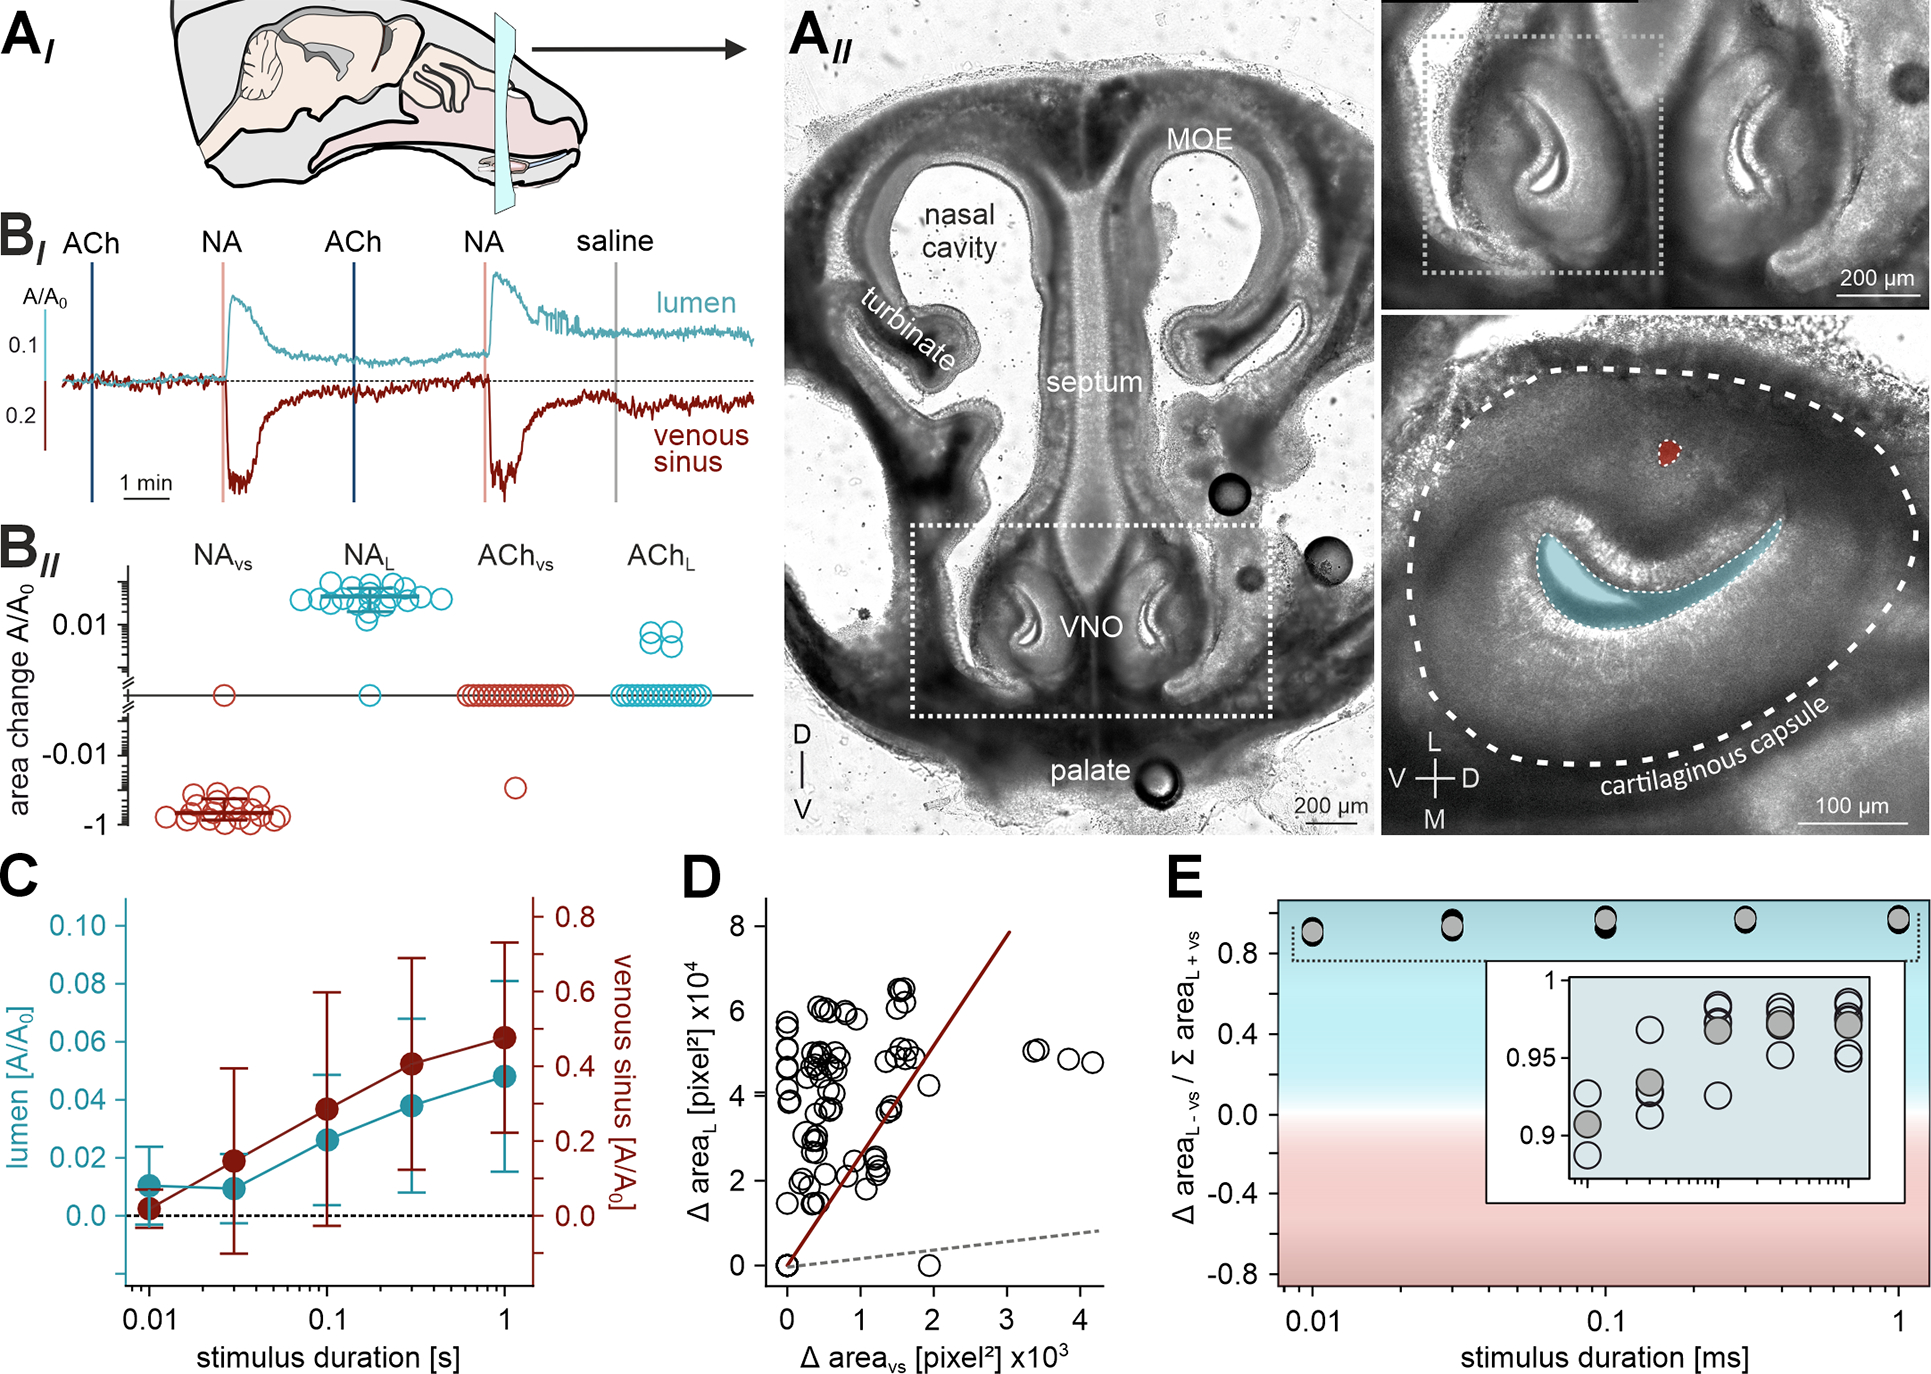
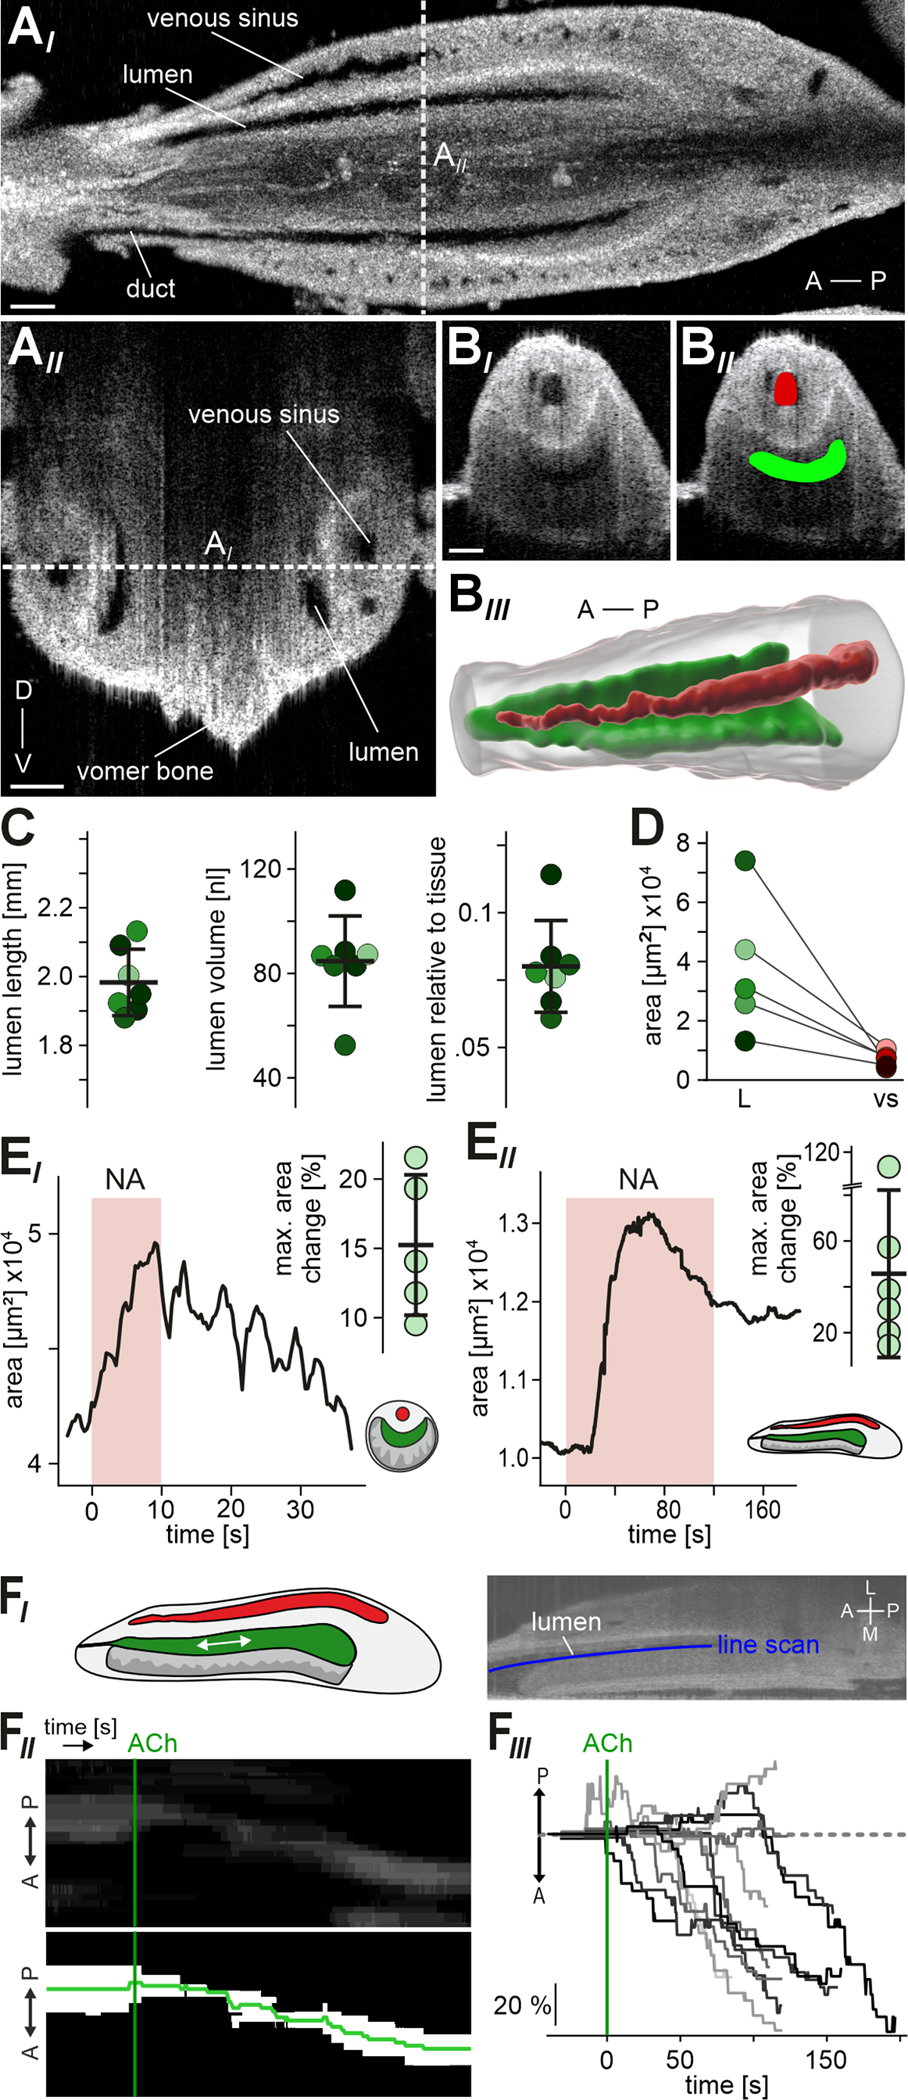
The physiological performance of any sensory organ is determined by its anatomy and physical properties. Consequently, complex sensory structures with elaborate features have evolved to optimize stimulus detection. Understanding these structures and their physical nature forms the basis for mechanistic insights into sensory function. Despite its crucial role as a sensor for pheromones and other behaviorally instructive chemical cues, the vomeronasal organ (VNO) remains a poorly characterized mammalian sensory structure. Fundamental principles of its physico-mechanical function, including basic aspects of stimulus sampling, remain poorly explored. Here, we revisit the classical vasomotor pump hypothesis of vomeronasal stimulus uptake. Using advanced anatomical, histological, and physiological methods, we demonstrate that large parts of the lateral mouse VNO are composed of smooth muscle. Vomeronasal smooth muscle tissue comprises two subsets of fibers with distinct topography, structure, excitation-contraction coupling, and, ultimately, contractile properties. Specifically, contractions of a large population of noradrenaline-sensitive cells mediate both transverse and longitudinal lumen expansion, whereas cholinergic stimulation targets an adluminal group of smooth muscle fibers. The latter run parallel to the VNO's rostro-caudal axis and are ideally situated to mediate antagonistic longitudinal constriction of the lumen. This newly discovered arrangement implies a novel mode of function. Single-cell transcriptomics and pharmacological profiling reveal the receptor subtypes involved. Finally, 2D/3D tomography provides non-invasive insight into the intact VNO's anatomy and mechanics, enables measurement of luminal fluid volume, and allows an assessment of relative volume change upon noradrenergic stimulation. Together, we propose a revised conceptual framework for mouse vomeronasal pumping and, thus, stimulus sampling.


Conflict of interest statement

Declaration of interests The authors declare no competing interests.

Figures

Figure 1 |
Figure 1 |. The mouse lateral VNO is predominantly composed of smooth muscle.
(A) Schematics illustrating the mouse VNO, histological section planes (AI), and corresponding coronal and horizontal slices (AII). (B-D) Co-immunostaining against markers for vascular endothelial cells (platelet endothelial cell adhesion molecule-1 (PECAM1); red) and SMCs (α-smooth muscle actin (α-SMA); green). Nuclear staining with DRAQ5 (blue). Representative coronal (B) and horizontal (C&D) cryosections (30 μm) depict a dense smooth muscle network throughout the lateral and posterior VNO. Anterior (BI), intermediate (BII), and posterior (BIII) coronal section planes as indicated in (AII). White dashed rectangles (B&C) delimit the zoomed-in areas in (B; left) and (DI-III). Note that, only in the anterior VNO, SMC localization is somewhat restricted to the perivascular envelope, whereas prominent α-SMA staining is observed throughout the intermediate and posterior cavernous tissue, largely independent of endothelial position. A, anterior; D, dorsal; L, lateral; M, medial; P, posterior; V, ventral. See also Figures S1 and S2.
Figure 2 |
Figure 2 |. Noradrenaline activates the lateral smooth muscle pump via external Ca2+ influx.
(A) Quasi-simultaneous imaging of lateral cavernous tissue contractions (left; reflected light microscopy) and [Ca2+]-dependent fluorescence (right; ΔF/F0; black-green 256 pseudocolor map) in acute coronal VNO slices. Focus adjusted to provide sharp images of the venous sinus. Representative individual frames (AI-III) correspond to the time points indicated in (B), i.e. before, during, and ~30 s after noradrenaline (NA) exposure (100 μM; 0.5 s). Left images: Solid white lines and pink shades outline the area occupied by the venous sinus (also shown at higher magnification without analysis mask in insets). Dashed white lines in (AII-III; left) depict the original sinus area prior to stimulation (AI) for comparison. Right images: Cre-dependent GCaMP6f expression in smooth muscle tissue of SMMHC-CreERT2 x Ai95D mice after tamoxifen injection (breeding scheme in (AI)) reveals robust and widespread [Ca2+] transients and concomitant contractions (left) in response to NA. (B) Relative fluorescence intensity (ΔF/F0, black trace corresponding to region outlined in (AII; right)) and relative change in sinus area size (A/A0, red trace; A0 is the average area size calculated from the recording’s initial 30 frames) over time. NA stimulation as indicated (vertical solid line). Dashed vertical lines mark the time points shown in (A). Note the strongly correlated waveforms of both signals. (C) Cavernous tissue contractions are dose-dependent. (CI) Representative original trace depicts sinus area change upon brief (0.5 s) stimulations with increasing NA concentrations (1–1000 μM; 2 min inter-stimulus interval (ISI)). Data calculated as in (B). Vertical solid lines indicate stimulation onset. Note that valve switching (saline control) triggers no mechanical artifacts. (CII) Data quantification. Dose-response curve (fitted by the Hill equation) illustrates average peak signals. Data (mean ± SD) are normalized to responses to 100 μM NA (numbers of experiments (n) are indicated above data points). Half-maximal contractions are triggered by 4.95 ± 1.04 μM NA (EC50). Inset depicts normalized peak contraction strength upon repetitive stimulation (100 μM; 0.5 s; 2 min ISI) with only minor response adaptation. (D) Influx of external Ca2+ powers force generation. (DI) Representative original trace depicts sinus area change upon NA stimulations (100 μM; 0.5 s; vertical lines) before, during, and after reducing the extracellular Ca2+ concentration ([Ca2+]e) to 10 nM (5 or 10 min preincubation). Reducing [Ca2+]e strongly diminishes responses to NA. Contractions regain their original strength upon wash-in of standard extracellular medium ([Ca2+]e = 1 mM). (DII) Quantification of data exemplified in (DI). Bar chart (mean ± SD) with individual data points illustrating peak contraction amplitudes normalized to the initial control stimulation. Asterisks denotes statistical significance (*1p = 4.4e−4, *2p = 1.9e−4, *3p = 2e−3, *4p = 1.8e−5, *5p = 7.5e−6; one-way ANOVA with post-hoc Tukey HSD test). See also Video S1.
Figure 3 |
Figure 3 |. NA and ACh stimulate topographically distinct groups of SMCs.
(A) Neurotransmitters recruit distinct SMC subpopulations. Pseudocolor fluorescence (AI-III) and brightfield (AIV) micrographs of lateral cavernous tissue in acute coronal VNO slices from SMMHC-CreERT2 x Ai95D mice. Images depict median GCaMP6f fluorescence intensity (top) as well as its standard deviation (bottom) calculated over several (11 – 56) frames during control conditions (AI), NA exposure (AII; 100 μM; 0.5 s), and ACh stimulation (AIII; 100 μM; 0.5 s). Note that, while NA induces widespread SMC Ca2+ signals, ACh-sensitive SMCs are confined to the adluminal region and show a characteristic ramified pattern. Dashed white lines depict regions-of-interest (ROIs) defined for time-lapse [Ca2+] (φ1–3) and quasi-simultaneous contraction (φ4) measurements (see CI). (B) Representative Ca2+ signals induced by either NA (black trace; 500 μM; 0.5 s) or ACh (blue trace; 100 μM; 0.5 s). (C) Transmitter sensitivity mapping in the lateral VNO. (CI) Relative fluorescence intensity (ΔF/F0; traces correspond to ROIs φ1–3) and relative change in sinus area size (A/A0; red trace, ROI φ4; A0 calculated from frames 1–30) over time. NA and ACh stimulations as indicated (vertical solid lines). ROIs identify the total cavernous tissue (φ1; green), a lateral area with the strongest response to NA (φ2; dark gray), and the adluminal ACh-sensitive region (φ3; blue). (CII) Quantification of data exemplified in (CI). Dot plot (including mean ± SD) depicting ROI-specific sensitivity indices, which are calculated from peak response amplitudes (see (B)) according to (NA − ACh) / (Na + ACh). Region color code as in (CI). (D) NA and ACh elicit characteristic Ca2+ signals. (DI) Average Ca2+ signal waveforms (normalized and aligned to peak) recorded from cavernous tissue SMCs in response to ACh (blue; n = 14; adluminal area (e.g., φ3)) and NA (red; n = 14; lateral area (e.g., φ2)). Shading indicates SD. (DII) Dot plot showing Ca2+ signal rise times (20%-to-80% of peak) from experiments exemplified in (CI). Each data point represents the average of two signals triggered by NA (gray) or ACh (blue), respectively (n = 7 experiments). ACh-induced Ca2+ signals rise fast (0.86 s; median), whereas signals evoked by NA show slower rise times (1.45 s). Asterisk denotes statistical significance (*1p = 2.3e−3; Mann–Whitney U test). (DIII) Dot plot showing Ca2+ signal decay time constants (fitted with double-exponential equations) from experiments exemplified in (CI). Data points are averages of NA (gray) or ACh (blue) signals, respectively (n = 7 experiments). NA-evoked Ca2+ signals display decelerated biexponential decay kinetics (τ1 = 3.7 s; τ2 = 98.2 s; median), whereas decay time constants for ACh responses are essentially identical (τ1 = 2.8 s; τ2 = 3.6 s), demonstrating a mono-exponential time course. Asterisk denotes statistical significance (*2p = 7e−3; Mann–Whitney U test). (E) Both stimuli operate dose-dependently within similar dynamic concentration ranges. (EI & EII) Representative original traces depict relative fluorescence intensity (ΔF/F0) over time upon brief (0.5 s) stimulations with increasing NA (EI) and ACh (EII) concentrations (2 min ISI). Vertical solid lines indicate stimulation onset. (EIII) Data quantification. Dose-response curves (fitted by the Hill equation) illustrate average peak signals. Data (mean ± SD) are normalized to responses to 100 μM NA and ACh, respectively (n and EC50 as indicated). Insets depict normalized peak Ca2+ signals upon repetitive stimulation (100 μM; 0.5 s; 2 min ISI) with only minor response adaptation. See also Figure S3.
Figure 4 |
Figure 4 |. Unique patterns of smooth muscle fiber orientation.
(A) Superresolution (STED) microscopy reveals divergent orientations of F-actin rich fibers in the mouse lateral VNO. (AI) STED micrograph of a coronal VNO cryosection (30 μm). Actin filaments (F-actin) are labeled with SPY555-actin (green), nuclei are stained with DRAQ5 (blue). White dashed rectangle delimits the zoomed-in area in (AII). At higher magnification (AII), the demarcation of two regions – adluminal and lateral – that differ by fiber orientation becomes apparent. (AIII) 3D z-stack reconstruction shows the parallel longitudinal arrangement of smooth muscle fibers along the adluminal zone. (BI) Horizontal cryosection depicting the lateral VNO. Actin filaments labeled with a selective fluorescent dye (SPY555-actin; gray scale). Nuclei stained with DRAQ5 (blue). Dashed white rectangle (bottom panel) delimits the area shown in (BII) at higher magnification. VS, venous sinus. (BII & BIII) Fluorescence intensity (gray scale (BII)) and fluorescence lifetime (red / green pseudocolor (BIII)) images of the F-actin labeled area outlined in (BI). Phasor representation of fluorescence lifetime distributions identifies two ‘hot spots’ in the phasor plot (inset in (BII); n = 8 sections from 6 animals). (BIII) Red or green pseudocoloring of SMCs according to the two populations’ average lifetimes (1.83 ± 0.38 ns (green); 2.62 ± 0.47 ns (red)) separates the adluminal from the more lateral zone of cavernous tissue. (BIV) Transformation of all fibered structures into 3D filaments (filament tracer tool in Imaris). (C) Quantitative analysis of data exemplified in (BIV). Over all experiments, filament tracing identified 1,837 ‘green’ and 2,209 ‘red’ fibers in representative areas (n = 8). In a cartesian coordinate system, each filament’s angle of orientation was determined (by drawing a start-to-end line (CII)) relative to the longitudinal VNO axis (0°). Fiber straightness was calculated as the trajectory-to-line length ratio (CII). Violin charts and merged box-and-whisker plots compare filament orientation angle (CI) as well as straightness (CII). Boxes represent the first-to-third quartiles. Whiskers represent the 10th and 90th percentiles, respectively. The central band represents the population median (P0.5) with its 95% confidence intervals depicted as notches. Diamonds show means. Adluminal (‘green’) fibers run largely parallel to the longitudinal axis (median = 13°; mean = 23.3° (CI)) and appear mostly straight (median = 0.9; mean = 0.78 (CII)). More lateral (‘red’) fibers display more heterogeneity regarding both orientation (median = 33°; mean = 37.7° (CI)) and straightness (median = 0.85; mean = 0.73 (CII)). Asterisks denotes statistical significance (*1p = 1.3e−68, *2p = 6.2e−28; Mann–Whitney U test). See also Figures S2 and S3.
Figure 5 |
Figure 5 |. NA and ACh trigger distinct VNO contraction patterns.
(A) Acute horizontal vibratome sections of the mouse VNO loaded with the Ca2+ reporter Cal-520/AM. Shown are a low magnification overview (AI) as well as micrographs depicting both the central (AII & III; left) and posterior (AII & III; right) regions (red and green rectangles in schematics). Overlay of pseudocolor fluorescence response signal (ΔF/F0; red for NA signals (AII; 100 μM), green for ACh responses (AIII; 100 μM)) and baseline fluorescence (F0) depicted in grayscale. Regions indicated by dashed white rectangles show raw peak responses (insets). Scale bars: 500 μm (AI), 200 μm (AII & III), 100 μm (insets). (B) Representative Ca2+ signals in individual SMCs induced by either NA ((BI); 100 μM) or ACh ((BII); 100 μM). Repetitive stimulation (10 s, 1 Hz, ISI: 0.5 s) as indicated by dashed horizontal lines. Insets depict average fluorescence signals collected from larger tissue areas (scale bars y: 0.2 ΔF/F0, x: 5 s). Note that a subpopulation of NA-sensitive SMCs follows stimulation at 1 Hz. (C) Quantification of individual SMC contraction / relaxation angles in the central cavernous tissue upon exposure to NA (red; n= 853) or ACh (green; n= 535), respectively. Boxes represent the first-to-third quartiles. Whiskers represent the 10th and 90th percentiles, respectively. The central band represents the population median (P0.5) with its 95% confidence intervals depicted as notches. Diamonds show means. Contractions of NA-sensitive (‘red’) cells show a more transverse angle (mean: 48°, median: 48°), whereas adluminal (‘green’) SMC contraction trajectories follow a more longitudinal path (mean: 36°, median: 35°). Asterisk denotes statistical significance (*1p = 5.1e−51; one-way ANOVA). (D & E) Presence of ACh affects NA-dependent contractility. (D) Original recordings of relative area changes (A/A0) in vomeronasal cavernous tissue (ROI indicated in schematic) over time. Contractions are triggered by repetitive NA stimulation (100 μM; 10 s, 1 Hz, 0.5 s ISI) as indicated by dashed vertical ticks. Horizontal slices were either kept in S2 (control; red trace) or incubated in ACh (100 μM; green trace). (E) Dot plots quantifying macroscopic contraction strength and kinetics in presence of ACh (normalized to control conditions; 12 ROIs, 4 slices). While NA-induced contraction speed is unaffected by ACh (pre)incubation (relative 10–90 % rise time; 0.94 ± 0.27 (mean ± SD)), both contraction amplitude (relative A/A0; 1.37 ± 0.56 (mean ± SD)) and relaxation (relative recovery; 0.65 ± 0.39 (mean ± SD)) are increased. Asterisks denote statistical significance (*2p = 1.4e−2, *3p = 1.0e−2; paired Student’s t-test). (F) Schematic illustrating our approach for frame-to-frame video tracking of macroscopic contractions in VNO whole-organ in decapsulated ex vivo preparations (also see Figure S6 and STAR Methods). Landmark pixel deflection vectors are tracked in vertical / transverse (y) and horizontal / longitudinal (x) directions. Values are then normalized to x/y dimensions occupied by the whole organ at rest. (G) Scatter plot quantifying relative pixel movement in response to either NA (gray; n = 25) or ACh (green; n = 22) exposure along the VNO transverse and longitudinal axis, respectively. Graph depicts average peak deflection (1.3 ± 0.9 (x) / 6.5 ± 4.9 (y) (NA); 0.8 ± 0.6 (x) / 2.1 ± 1.5 (y) (ACh); means ± SD) and regression lines (correlation coefficients r = 0.08 (p = 0.35; NA); r = 0.07 (p = 0.39; ACh)) in comparison to the dashed line of identity. (H) Dot plot quantifying the time to reach peak contraction in transverse (y; left) and longitudinal (x; right) directions upon either NA (gray; n = 25; x = 11.1 ± 12.2 s; y = 32.1 ± 40.3 s; means ± SD) or ACh (green; n = 22; x = 20.9 ± 19.0 s; y = 63.3 ± 73.8 s) stimulation. While values for a given neurotransmitter do not differ statistically in x- and y-direction, NA-triggered deflections reach peak strength significantly faster than ACh-mediated contractions. Asterisks denote statistical significance (*4p = 1.2e−2, *5p = 2.5e−3; one-way ANOVA). See also Figures S4 - S6 as well as Videos S2 and S3.
Figure 6 |
Figure 6 |. NA-induced lateral smooth muscle contractions translate into lumen expansion.
(AI) Schematic view of a mouse head and coronal section plane. (AII) Transmitted light image of an acute coronal slice (250 μm thick) of the mouse rostral skull at postnatal day 6. The VNO is delimited by the dashed white boxes and shown at a higher magnification on the right. Bottom, right: The VNO cartilaginous capsule (dashed line), venous sinus (red), and lumen (blue) are indicated. D, dorsal; L, lateral; M, medial; MOE, main olfactory epithelium; V, ventral. (BI) Representative original traces illustrate relative area changes (A/A0) of the lumen (top; blue) and venous sinus (bottom; red) upon repeated alternating stimulation with ACh and NA (100 μM, 0.5 s each; vertical lines) as well as saline control. (BII) Quantification of data exemplified in (BI). Logarithmic dot plot (including mean ± SD for NA effects) summarizing peak constrictions / expansions from 10 acute slice experiments. (C) Stimulus duration - response curves depict relative area changes (A/A0; n = 8; mean ± SD) of lumen (blue) and venous sinus (red) as a function of NA exposure duration (100 μM, 10 ms - 1 s). (D) Scatter plot quantifying absolute changes in lumen versus sinus area upon NA stimulation. Regression line (red; correlation coefficient r = 0.37 (p < 0.001)) is shown in comparison to the dashed gray line of identity. Data points correspond to experimental paradigms exemplified in both (BI) and (C). (E) Area bias index compares the relative contributions of lumen versus sinus movements, plotted as a function of NA exposure duration (C). Index is calculated from absolute peak area changes according to (lumen − sinus) / (lumen + sinus). Note that lumen expansion substantially exceeds the decrease in sinus area. See also Video S4.
Figure 7 |
Figure 7 |. In the intact VNO, adrenergic stimulation triggers substantial expansion of luminal volume.
(A) OCT provides real-time non-invasive insights into VNO anatomy. (AI) Representative horizontal optical section of an intact mouse VNO recorded via 3D tomography within the skull immediately after euthanasia. Venous sinus, vomeronasal lumen and duct are indicated. Dashed white vertical line indicates the optical section plane shown in (AII). (AII) Coronal optical section. Dashed white horizontal line indicates the optical section plane shown in (AI). A, anterior; D, dorsal; P, posterior; V, ventral. (BI) Fast 2D tomography of a coronal optical section, with manually curated Labkit pixel classification masks ((BII); see STAR Methods) of venous sinus (red) and lumen (green) for physiological measurements of area constriction / expansion (E). (BIII) Representative 3D reconstruction of the VNO soft tissue (transparent gray) including lateral sinus (red) and vomeronasal lumen (green). (C) Anatomical features of the VNO lumen in adult mice. Dot plots show data from 7 encapsulated VNO hemispheres (6 animals; shading code corresponding to Figure S7A). Black horizontal bars depict means ± SD. Lumen length (1.98 ± 0.97 mm), volume (84.67 ± 17.34 nl), and proportion relative to total soft tissue (8 ± 1.7 %) are shown. (D) Comparison of vomeronasal lumen and sinus area in coronal optical sections within the skull immediately after euthanasia (n = 5). Note that a relatively small sinus does not predict a large lumen (and vice versa). (E) 2D optical section measurements of VNO lumen area change in response to NA. (EI) Representative original trace and quantification showing lumen area over time in transverse optical sections. Brief perfusion of the encapsulated intact organ with NA (1 mM; 10 s) triggered transient expansion. Dot plot (inset) showing relative changes in transverse lumen area from 5 encapsulated VNOs. We observed average lumen expansion upon NA stimulation by 15.24 ± 5.06 % (black horizontal bars; means ± SD). (EII) Representative trace (lumen area versus time) and quantification illustrating lumen expansion and some relaxation in horizontal optical sections upon prolonged exposure to NA (500 μM; 120 s). Dot plot (inset) showing relative changes in horizontal lumen area from 6 encapsulated VNOs (36.5 ± 35 %; means ± SD). (F) ACh triggers luminal content movement in anterior direction. (FI) Schematic and representative OCT image illustrating the experimental paradigm. Line scans (blue) along the lumen longitudinal axis are used to generate kymograph representations of optical inhomogeneities within the lumen. (FII) Original kymograph and corresponding binary image depict fluid movement in anterior direction over time. Start of ACh perfusion (1 mM) as indicated (green vertical line). (F) Family of average kymograph traces (as indicated in (FII)) shows relative longitudinal displacement over time. Traces are aligned to the start of ACh perfusion (green vertical line). See also Figure S7 as well as Videos S5 - S7.

Comment in

Similar articles

Cited by

References

    1. Baden T, Euler T, and Berens P (2020). Understanding the retinal basis of vision across species. Nat. Rev. Neurosci. 21, 5–20. 10.1038/s41583-019-0242-1. - DOI - PubMed
    1. Hudspeth AJ (2014). Integrating the active process of hair cells with cochlear function. Nat. Rev. Neurosci. 15. 10.1038/nrn3786. - DOI - PubMed
    1. Shepherd GM (2012). Neurogastronomy: How the Brain Creates Flavor and Why It Matters (Columbia University Press; ).
    1. Jacobson L, Trotier D, and Døving KB (1998). Anatomical description of a new organ in the nose of domesticated animals by Ludvig Jacobson (1813). Chem. Senses 23, 743–754. 10.1093/chemse/23.6.743. - DOI - PubMed
    1. Halpern M, and Martinez-Marcos A (2003). Structure and function of the vomeronasal system: an update. Prog. Neurobiol. 70, 245–318. 10.1016/S0301-0082(03)00103-5. - DOI - PubMed

Publication types

LinkOut - more resources