. 2024 Mar 7;111(3):445-455.
doi: 10.1016/j.ajhg.2024.01.006. Epub 2024 Feb 5.

Transcriptome-wide association study of the plasma proteome reveals cis and trans regulatory mechanisms underlying complex traits

Affiliations

Transcriptome-wide association study of the plasma proteome reveals cis and trans regulatory mechanisms underlying complex traits

Henry Wittich et al. Am J Hum Genet. .

Abstract

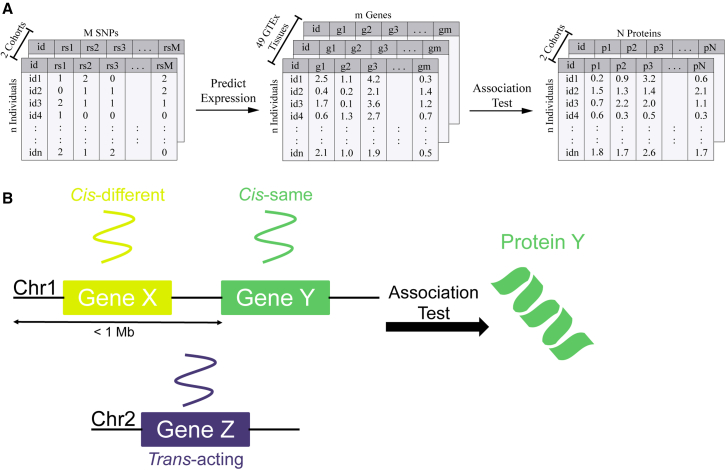
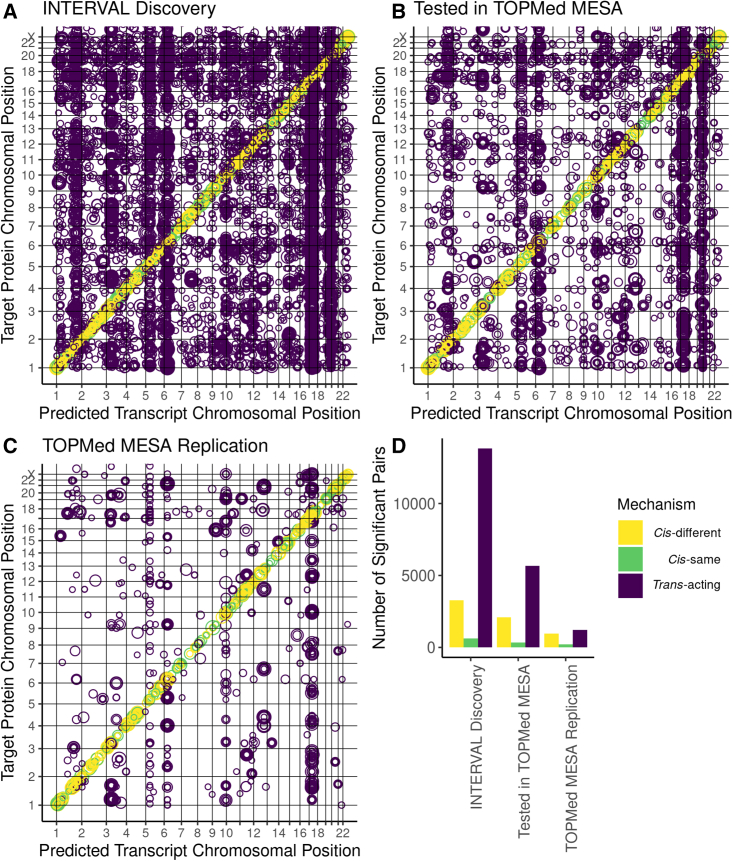
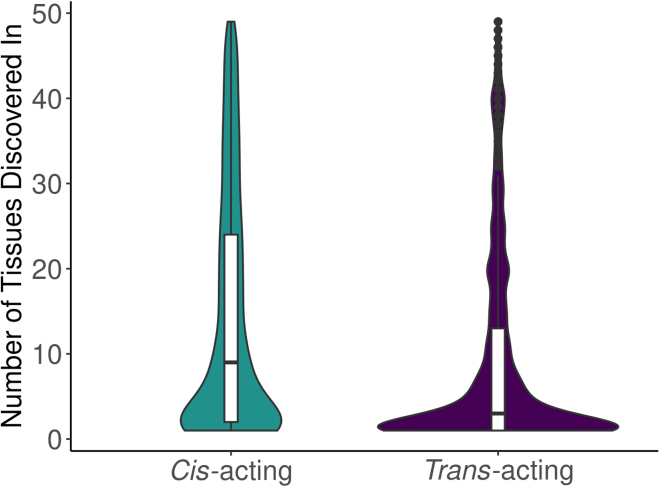
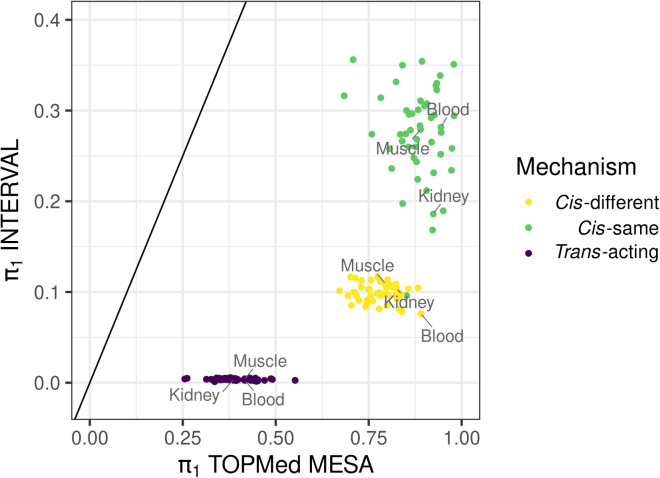
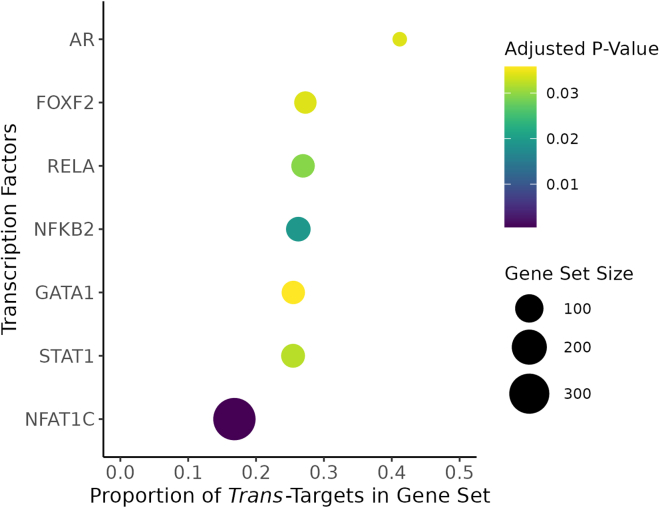
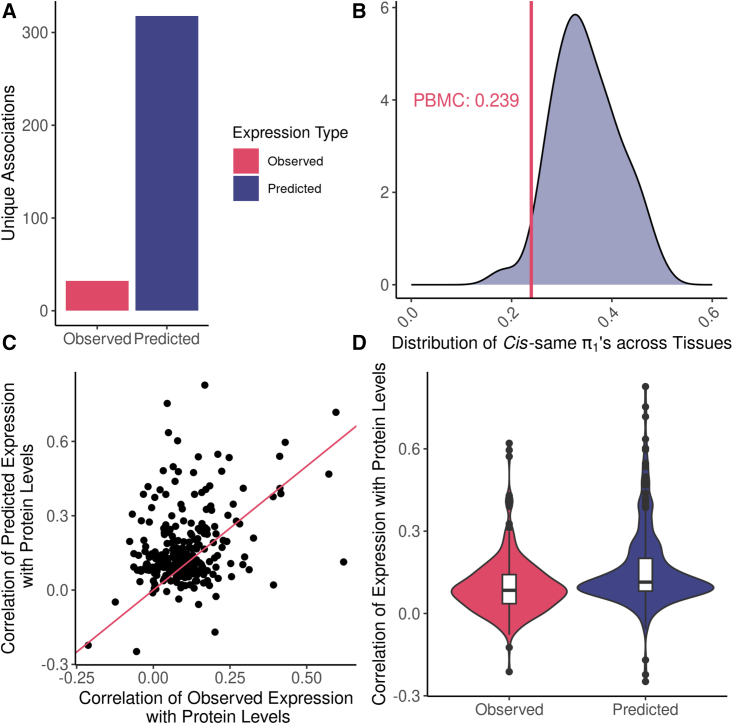
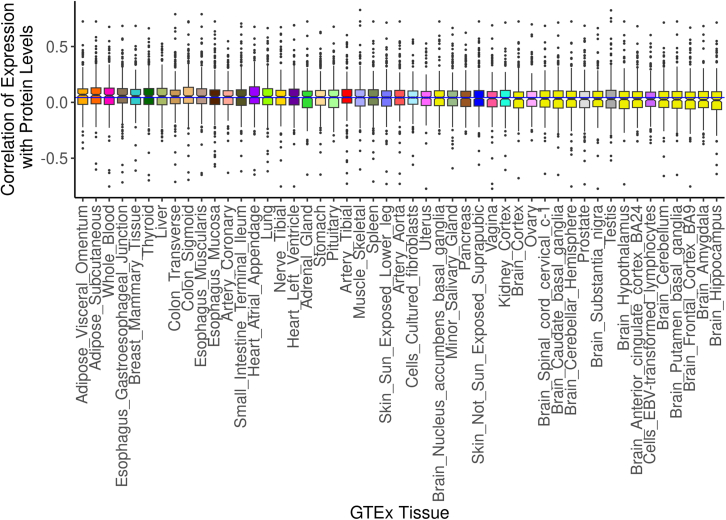
Regulation of transcription and translation are mechanisms through which genetic variants affect complex traits. Expression quantitative trait locus (eQTL) studies have been more successful at identifying cis-eQTL (within 1 Mb of the transcription start site) than trans-eQTL. Here, we tested the cis component of gene expression for association with observed plasma protein levels to identify cis- and trans-acting genes that regulate protein levels. We used transcriptome prediction models from 49 Genotype-Tissue Expression (GTEx) Project tissues to predict the cis component of gene expression and tested the predicted expression of every gene in every tissue for association with the observed abundance of 3,622 plasma proteins measured in 3,301 individuals from the INTERVAL study. We tested significant results for replication in 971 individuals from the Trans-omics for Precision Medicine (TOPMed) Multi-Ethnic Study of Atherosclerosis (MESA). We found 1,168 and 1,210 cis- and trans-acting associations that replicated in TOPMed (FDR < 0.05) with a median expected true positive rate (π1) across tissues of 0.806 and 0.390, respectively. The target proteins of trans-acting genes were enriched for transcription factor binding sites and autoimmune diseases in the GWAS catalog. Furthermore, we found a higher correlation between predicted expression and protein levels of the same underlying gene (R = 0.17) than observed expression (R = 0.10, p = 7.50 × 10⁻¹¹). This indicates the cis-acting genetically regulated (heritable) component of gene expression is more consistent across tissues than total observed expression (genetics + environment) and is useful in uncovering the function of SNPs associated with complex traits.

Keywords: TWAS; autoimmune diseases; cis-eQTL; gene expression; genetic prediction; heritability; plasma proteome; trans-eQTL; transcription factors.


Conflict of interest statement

Declaration of interests The authors declare no competing interests.

Figures

Figure 1
Figure 1
TWAS for protein levels (A) Overview of TWAS analysis. Genotype data from both the INTERVAL and TOPMed MESA cohorts were used to impute genetically regulated expression levels (GReX) in 49 different GTEx tissues. GReX was tested for association with measured plasma protein levels for all proteins tested in both studies. (B) Model for definition of cis-vs. trans-acting gene regulators of protein abundance. Here, the prediction model for expression of gene Y and protein Y have a cis-same relationship. The expression of gene X and the abundance of protein Y have a cis-different relationship because the genes that encode them are different, but their transcription start sites are within 1 Mb of each other. Finally, the expression of gene Z and the abundance of protein Y have a trans-acting relationship because the transcription start sites of the genes that encode them are greater than 1 Mb (in this case, the genes are on different chromosomes).
Figure 2
Figure 2
Overview of significant transcript-protein associations (A–C) Tile plot shows relative genomic position of significantly (FDR <0.05) associated transcript-protein pairs. Each circle represents a uniquely associated predicted transcript and target protein pair. Gridlines delineate chromosomes, and the position along the x axis corresponds to the genomic position of the gene that encodes the predicted transcript, while the position along the y axis corresponds to the genomic position of the gene that encodes the target protein. The size of each circle corresponds to the number of tissues (out of all 49) in which the transcript-protein pair was significantly associated. (A) Significantly (FDR <0.05) associated transcript-protein pairs discovered in INTERVAL. (B) Significantly (FDR <0.05) associated transcript-protein pairs discovered in INTERVAL that were also tested in TOPMed MESA. (C) Significantly (FDR <0.05) associated transcript-protein pairs discovered in INTERVAL that were also significant (FDR <0.05) in TOPMed MESA. (D) Bar plot of the number of significant (FDR <0.05) associations discovered in INTERVAL, discovered in INTERVAL and tested in TOPMed MESA, and discovered in INTERVAL and significantly (FDR <0.05) replicated in TOPMed MESA.
Figure 3
Figure 3
Sharing of cis- and trans-acting effects across tissues in INTERVAL Distributions of the number of tissues in which each significant transcript-protein pair was discovered (FDR <0.05), divided into cis- and trans-acting associations.
Figure 4
Figure 4
Expected true positive rates (π1) for transcript-protein pairs across tissues Discovery π1 values across tissues of transcript-protein pairs tested in INTERVAL are compared to replication π1 values in TOPMed MESA. Only significant (FDR <0.05) transcript-protein pairs in INTERVAL were tested in TOPMed MESA. Associations were divided into cis-same, cis-different, and trans-acting, and π1 was calculated in every GTEx tissue separately. Tissues with the most samples in GTEx (muscle-skeletal, n = 706, and whole blood, n = 670) and the least samples in GTEx (kidney-cortex, n = 73) are labeled. The diagonal line is the identity line (y intercept = 0, slope = 1).
Figure 5
Figure 5
Enrichment of TF binding sites of target proteins of trans-acting genes The target proteins of trans-acting genes were significantly enriched for binding motifs of the TFs listed on the y axis as annotated in the Molecular Signatures Database., The size of each bubble corresponds to the number of genes annotated in the database that we tested in our TWAS analysis and the x axis represents the proportion of those genes whose protein products were significantly associated with a trans-acting gene in INTERVAL. The color of each bubble represents the adjusted p value (Benjamini-Hochberg) of the enrichment test.
Figure 6
Figure 6
Cis-same associations using predicted expression vs. observed expression (A) Number of unique genes with a cis-same correlation between expression levels (divided by predicted and observed) and protein abundance. (B) Distribution of proportion of true positives (π1 values) from tests conducted in all predicted tissues. The vertical red line indicates the tissue with observed gene expression that had the highest π1; PBMC at 0.239. (C) Scatterplot comparing the maximum correlation of predicted and observed expression with protein abundance by gene. (D) Distribution of maximum Pearson correlation coefficients for correlating expression, predicted or observed, of significant cis-same genes with protein abundance.
Figure 7
Figure 7
Cis-same correlation of predicted expression and protein levels by tissue Distribution of Pearson correlation coefficients for correlating predicted expression of significant cis-same genes with protein abundance in every GTEx tissue. The horizontal blue line indicates the median correlation across all tissues.

Similar articles

Cited by

References

    1. Hormozdiari F., Gazal S., van de Geijn B., Finucane H.K., Ju C.J.-T., Loh P.-R., Schoech A., Reshef Y., Liu X., O’Connor L., et al. Leveraging molecular quantitative trait loci to understand the genetic architecture of diseases and complex traits. Nat. Genet. 2018;50:1041–1047. - PMC - PubMed
    1. Strunz T., Grassmann F., Gayán J., Nahkuri S., Souza-Costa D., Maugeais C., Fauser S., Nogoceke E., Weber B.H.F. A mega-analysis of expression quantitative trait loci (eQTL) provides insight into the regulatory architecture of gene expression variation in liver. Sci. Rep. 2018;8:5865. - PMC - PubMed
    1. Liu X., Finucane H.K., Gusev A., Bhatia G., Gazal S., O’Connor L., Bulik-Sullivan B., Wright F.A., Sullivan P.F., Neale B.M., Price A.L. Functional Architectures of Local and Distal Regulation of Gene Expression in Multiple Human Tissues. Am. J. Hum. Genet. 2017;100:605–616. - PMC - PubMed
    1. Võsa U., Claringbould A., Westra H.-J., Bonder M.J., Deelen P., Zeng B., Kirsten H., Saha A., Kreuzhuber R., Yazar S., et al. Large-scale cis- and trans-eQTL analyses identify thousands of genetic loci and polygenic scores that regulate blood gene expression. Nat. Genet. 2021;53:1300–1310. - PMC - PubMed
    1. Liu X., Li Y.I., Pritchard J.K. Trans Effects on Gene Expression Can Drive Omnigenic Inheritance. Cell. 2019;177:1022–1034.e6. - PMC - PubMed

Publication types

MeSH terms