. 2024 Feb 14;291(2016):20232568.
doi: 10.1098/rspb.2023.2568. Epub 2024 Feb 7.

Season of death, pathogen persistence and wildlife behaviour alter number of anthrax secondary infections from environmental reservoirs

Affiliations

Season of death, pathogen persistence and wildlife behaviour alter number of anthrax secondary infections from environmental reservoirs

Amélie C Dolfi et al. Proc Biol Sci. .

Abstract

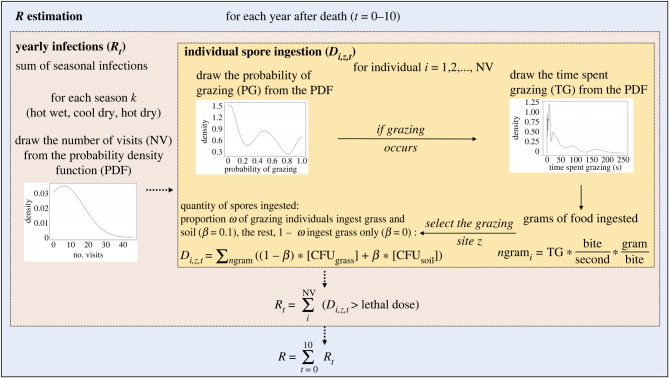
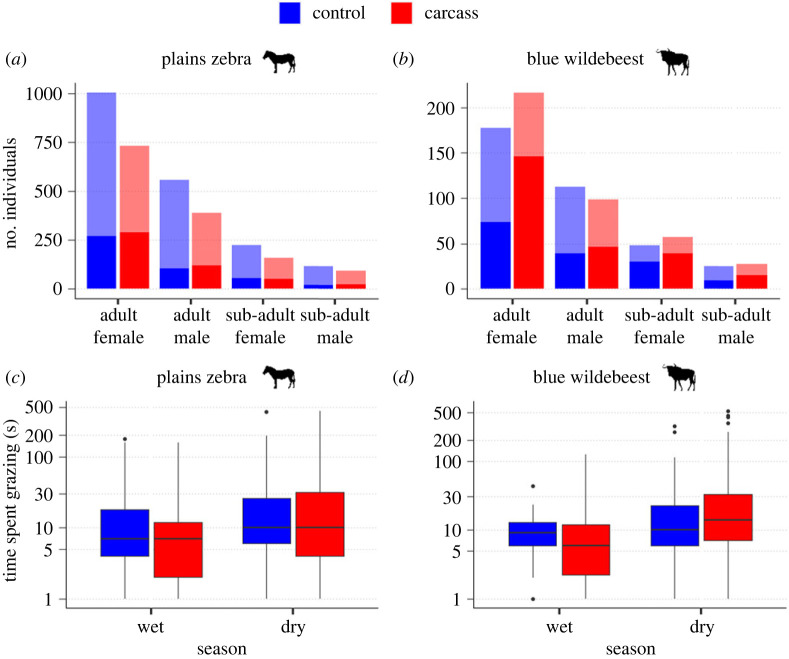
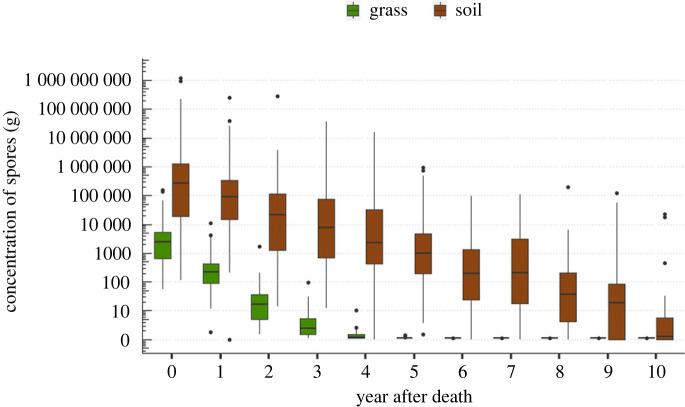
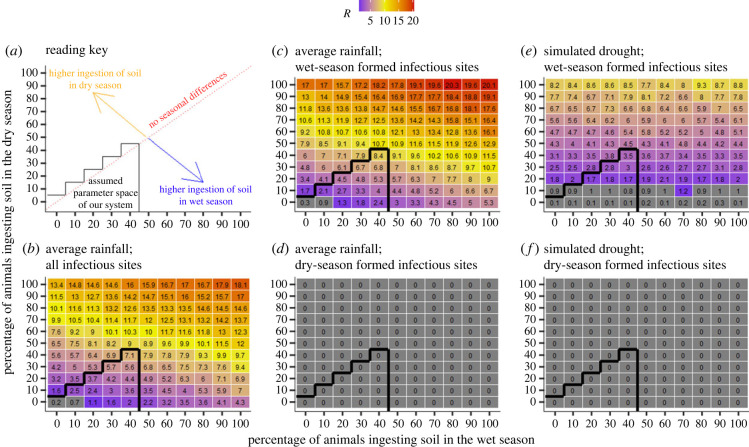
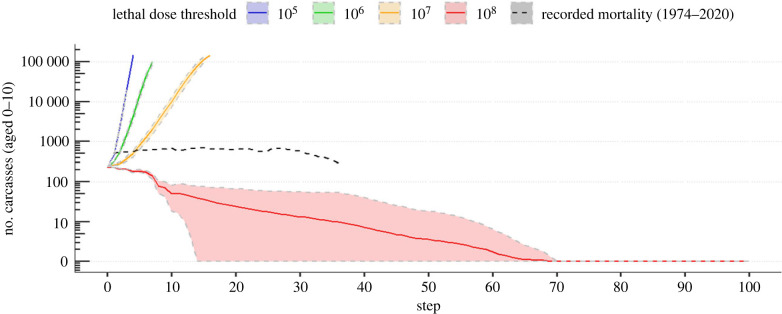
An important part of infectious disease management is predicting factors that influence disease outbreaks, such as R, the number of secondary infections arising from an infected individual. Estimating R is particularly challenging for environmentally transmitted pathogens given time lags between cases and subsequent infections. Here, we calculated R for Bacillus anthracis infections arising from anthrax carcass sites in Etosha National Park, Namibia. Combining host behavioural data, pathogen concentrations and simulation models, we show that R is spatially and temporally variable, driven by spore concentrations at death, host visitation rates and early preference for foraging at infectious sites. While spores were detected up to a decade after death, most secondary infections occurred within 2 years. Transmission simulations under scenarios combining site infectiousness and host exposure risk under different environmental conditions led to dramatically different outbreak dynamics, from pathogen extinction (R < 1) to explosive outbreaks (R > 10). These transmission heterogeneities may explain variation in anthrax outbreak dynamics observed globally, and more generally, the critical importance of environmental variation underlying host-pathogen interactions. Notably, our approach allowed us to estimate the lethal dose of a highly virulent pathogen non-invasively from observational studies and epidemiological data, useful when experiments on wildlife are undesirable or impractical.

Keywords: Bacillus anthracis; disease transmission; environmentally transmitted pathogen; host–pathogen contact; reproduction number.


Conflict of interest statement

The author declares no competing interest.

Figures

Figure 1.
Figure 1.
Model visualization for the estimation of the reproduction number R of anthrax in Etosha National Park, Namibia. Each simulation ran over 10 years and was repeated 100 times. Each year is separated into three seasons (k), the hot wet, cool dry and hot dry seasons. Each probability density function (PDF) is obtained using the camera trap data. During the hot wet season, the proportion of animals ingesting grass and soil ω is ωwet, while it is ωdry during the cool and hot dry seasons. The yearly reproduction number Rt is the sum of the number of infections occurring during each of the three seasons k of year t. The reproduction number R is the sum of the yearly reproduction number.
Figure 2.
Figure 2.
Total number of individuals by age and sex recorded visiting (lighter colours) and grazing (darker colours) at anthrax carcass sites (a,b), and the time spent grazing (in seconds) by season, at control (blue) and carcass (red) sites (c,d), for plains zebra (Equus quagga: a,c) and blue wildebeest (Connochaetes taurinus: b,d) in Etosha National Park, Namibia.
Figure 3.
Figure 3.
Decline in Bacillus anthracis spore concentrations at 40 anthrax carcass sites in Etosha National Park, Namibia, over time, on grass tops (green) and in surface soils (brown). Grass concentrations were obtained from extrapolation of the soil concentrations (equation 2.1).
Figure 4.
Figure 4.
Variation in the reproduction number, R, for plains zebras (Equus quagga) at anthrax carcass sites, for a lethal dose threshold of 107 Bacillus anthracis spores based on differences in seasonality of host visitation, season of reservoir formation, and percentage of individuals ingesting soil during grazing, estimated over the 10-year lifetime of a B. anthracis reservoir site. The percentage of animals ingesting soil while grazing is varied from 0% to 100%. In all cases, animals are ingesting 10% soil, 90% grass (by weight) if soil is consumed. Soil contact during foraging is considered for two seasons, wet season (numbers below the diagonal) and dry season (numbers above the diagonal). The R values falling along the diagonal represent no difference in soil exposure by season. The black line represents the most likely parameter space for the study system, according to host foraging literature [29,30]. The grey tiles represent an R < 1, then a colour gradient is used for R > 1. (a) reading key; (b) all host and reservoir data; (c) visitation rates under good rainfall, wet season reservoirs; (d) visitation rates under good rainfall, dry season reservoirs; (e) visitation rates under simulated drought, wet season reservoirs; (f) visitation rates under simulated drought, dry season reservoirs.
Figure 5.
Figure 5.
Prediction of the number of anthrax cases recorded over 100 years depending on lethal dose thresholds of 105, 106, 107 and 108. The shaded area represents the standard deviation over the 100 simulations. The black dashed line represents the recorded mortality in Etosha National Park, Namibia from 1974 to 2020. Each simulation started with the recorded mortality data from a decade (2003–2013). The x-axis represents the total number of potentially infectious carcass sites present in the environment (each site ‘disappears’ after 10 years). Predictions were made using the simulation model output, with a limit of 10 000 new cases. The lethal doses 105, 106 and 107 lead to an explosion of cases, while the lethal dose of 108 leads to extinction. Lethal doses maintaining a relatively stable number of cases over time would be between 107 and 108. The y-axis is log-transformed.
Figure 6.
Figure 6.
Variation in the average number of plains zebra (Equus quagga) secondary anthrax mortalities occurring per year after death at an anthrax carcass site, depending on the lethal dose threshold of Bacillus anthracis spores ingested. Opaque colours and dotted error bars represent the average number of infections within the assumed parameter space of our study system, i.e. the percentage of animals ingesting soil while grazing varied from 0% to 40%. The transparent bars and solid error bars represent the average number of secondary infections for the entire parameter space, i.e. the percentage of animals ingesting soil while grazing varied from 0% to 100%. The y-axis is square root transformed to better visualize small numbers. Error bars represent standard deviation.

Similar articles

Cited by

References

    1. Hopkins SR, et al. 2022. Environmental persistence of the World's most burdensome infectious and parasitic diseases. Front. Public Health 10, 892366. (10.3389/fpubh.2022.892366) - DOI - PMC - PubMed
    1. Martinez-Bakker M, King AA, Rohani P. 2015. Unraveling the transmission ecology of Polio. PLoS Biol. 13, e1002172. (10.1371/journal.pbio.1002172) - DOI - PMC - PubMed
    1. Rohani P, Breban R, Stallknecht DE, Drake JM. 2009. Environmental transmission of low pathogenicity avian influenza viruses and its implications for pathogen invasion. Proc. Natl Acad. Sci. USA 106, 10 365-10 369. (10.1073/pnas.0809026106) - DOI - PMC - PubMed
    1. Aune K, Rhyan JC, Russell R, Roffe TJ, Corso B. 2012. Environmental persistence of Brucella abortus in the Greater Yellowstone Area. J. Wildl. Manag. 76, 253-261. (10.1002/jwmg.274) - DOI
    1. Shapiro K, Bahia-Oliveira L, Dixon B, Dumètre A, de Wit LA, VanWormer E, Villena I. 2019. Environmental transmission of Toxoplasma gondii: oocysts in water, soil and food. Food Waterborne Parasitol. 15, e00049. (10.1016/j.fawpar.2019.e00049) - DOI - PMC - PubMed