

Plasma C24:0- and C26:0-lysophosphatidylcholines are reliable biomarkers for the diagnosis of peroxisomal β-oxidation disorders
- PMID: 38320654
- PMCID: PMC10910329
- DOI: 10.1016/j.jlr.2024.100516
Plasma C24:0- and C26:0-lysophosphatidylcholines are reliable biomarkers for the diagnosis of peroxisomal β-oxidation disorders
Abstract
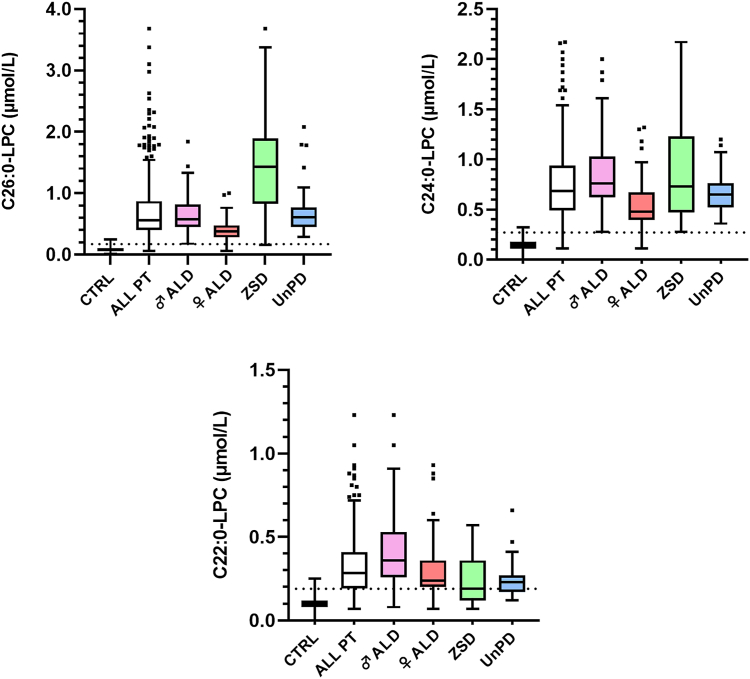
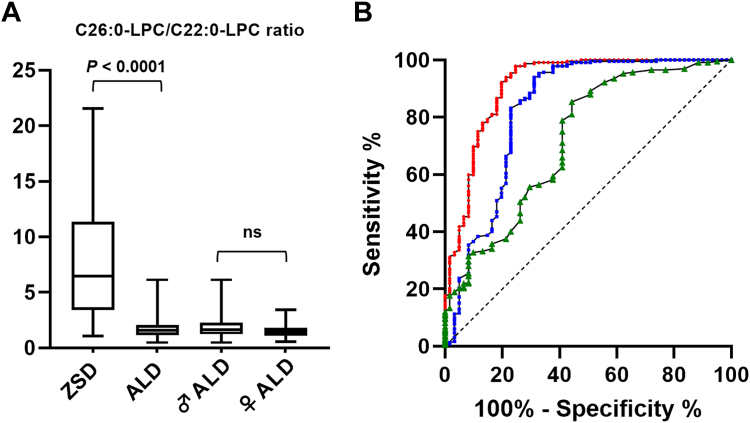
The gold-standard diagnostic test for peroxisomal disorders (PDs) is plasma concentration analysis of very long-chain fatty acids (VLCFAs). However, this method's time-consuming nature and limitations in cases which present normal VLCFA levels necessitates alternative approaches. The analysis of C26:0-lysophosphatydylcholine (C26:0-LPC) in dried blood spot samples by tandem-mass spectrometry (MS/MS) has successfully been implemented in certain newborn screening programs to diagnose X-linked adrenoleukodystrophy (ALD). However, the diagnostic potential of very long-chain LPCs concentrations in plasma remains poorly understood. This study sought to evaluate the diagnostic performance of C26:0-LPC and other very long-chain LPCs, comparing them to VLCFA analysis in plasma. The study, which included 330 individuals affected by a peroxisomal β-oxidation deficiency and 407 control individuals, revealed that C26:0- and C24:0-LPC concentrations demonstrated the highest diagnostic accuracy (98.8% and 98.4%, respectively), outperforming VLCFA when C26:0/C22:0 and C24:0/C22:0 ratios were combined (98.1%). Combining C24:0- and C26:0-LPC gave the highest sensitivity (99.7%), with ALD females exhibiting notably higher sensitivity compared with the VLCFA ratio combination (98.7% vs. 93.5%, respectively). In contrast, C22:0-LPC exhibited suboptimal performance, primarily due to its low sensitivity (75%), but we identified a potential use to help distinguish between ALD and Zellweger spectrum disorders. In summary, MS/MS analysis of plasma C24:0- and C26:0-LPC concentrations represents a rapid and straightforward approach to diagnose PDs, demonstrating superior diagnostic accuracy, particularly in ALD females, compared with conventional VLCFA biomarkers. We strongly recommend integrating very-long chain LPC plasma analysis in the diagnostic evaluation of individuals suspected of having a PD.
Keywords: ALD female; Adrenoleukodystrophy; VLCFA; Zellweger spectrum disorders; Zellweger syndrome; fatty acid/transport; lipids; lipids/oxidation; lysophospholipid; tandem mass spectrometry.
Copyright © 2024 The Authors. Published by Elsevier Inc. All rights reserved.
Conflict of interest statement
Conflict of interest The author declares that they have no conflicts of interest with the contents of this article.
Figures
Similar articles
-
Streamlined determination of lysophosphatidylcholines in dried blood spots for newborn screening of X-linked adrenoleukodystrophy.Mol Genet Metab. 2015 Jan;114(1):46-50. doi: 10.1016/j.ymgme.2014.11.013. Epub 2014 Nov 27. Mol Genet Metab. 2015. PMID: 25481105
-
Comparison of the Diagnostic Performance of C26:0-Lysophosphatidylcholine and Very Long-Chain Fatty Acids Analysis for Peroxisomal Disorders.Front Cell Dev Biol. 2020 Jul 29;8:690. doi: 10.3389/fcell.2020.00690. eCollection 2020. Front Cell Dev Biol. 2020. PMID: 32903870 Free PMC article.
-
Evaluation of a panel of very long-chain lysophosphatidylcholines and acylcarnitines for screening of X-linked adrenoleukodystrophy in China.Clin Chim Acta. 2020 Apr;503:157-162. doi: 10.1016/j.cca.2020.01.016. Epub 2020 Jan 21. Clin Chim Acta. 2020. PMID: 31978407
-
[Peroxisomal neurologic diseases and Refsum disease: very long chain fatty acids and phytanic acid as diagnostic markers].Wien Klin Wochenschr. 1992;104(21):665-70. Wien Klin Wochenschr. 1992. PMID: 1282286 Review. German.
-
DNA diagnosis of X-linked adrenoleukodystrophy.J Inherit Metab Dis. 1995;18 Suppl 1:34-44. doi: 10.1007/BF00711427. J Inherit Metab Dis. 1995. PMID: 9053554 Review.
Cited by
-
Diagnostic Value of Menstrual Blood Lipidomics in Endometriosis: A Pilot Study.Biomolecules. 2024 Jul 24;14(8):899. doi: 10.3390/biom14080899. Biomolecules. 2024. PMID: 39199287 Free PMC article.
References
-
- Klouwer F.C.C., Huffnagel I.C., Ferdinandusse S., Waterham H.R., Wanders R.J.A., Engelen M., et al. Clinical and biochemical pitfalls in the diagnosis of peroxisomal disorders. Neuropediatrics. 2016;47:205–220. - PubMed
-
- Kemp S., Huffnagel I.C., Linthorst G.E., Wanders R.J., Engelen M. Adrenoleukodystrophy - neuroendocrine pathogenesis and redefinition of natural history. Nat. Rev. Endocrinol. 2016;12:606–615. - PubMed
-
- Raymond G.V., Moser A.B., Fatemi A. In: GeneReviews® [Internet] Adam M.P., Feldman J., Mirzaa G.M., Pagon R.A., Wallace S.E., Bean L.J.H., et al., editors. University of Washington; Seattle, WA: 1999. X-linked adrenoleukodystrophy.
-
- Engelen M., Barbier M., Dijkstra I.M.E., Schür R., De Bie R.M.A., Verhamme C., et al. X-linked adrenoleukodystrophy in women: a cross-sectional cohort study. Brain. 2014;137(Pt 3):693–706. - PubMed
Publication types
MeSH terms
Substances
LinkOut - more resources
Full Text Sources
Miscellaneous
