. 2024 Feb 6;7(4):e202302337.
doi: 10.26508/lsa.202302337. Print 2024 Apr.

Epigenomic states contribute to coordinated allelic transcriptional bursting in iPSC reprogramming

Affiliations

Epigenomic states contribute to coordinated allelic transcriptional bursting in iPSC reprogramming

Parichitran Ayyamperumal et al. Life Sci Alliance. .

Abstract

Two alleles of a gene can be transcribed independently or coordinatedly, which can lead to temporal expression heterogeneity with potentially distinct impacts on cell fate. Here, we profiled genome-wide allelic transcriptional burst kinetics during the reprogramming of MEF to induced pluripotent stem cells. We show that the degree of coordination of allelic bursting differs among genes, and alleles of many reprogramming-related genes burst in a highly coordinated fashion. Notably, we show that the chromatin accessibility of the two alleles of highly coordinated genes is similar, unlike the semi-coordinated or independent genes, suggesting the degree of coordination of allelic bursting is linked to allelic chromatin accessibility. Consistently, we show that many transcription factors have differential binding affinity between alleles of semi-coordinated or independent genes. We show that highly coordinated genes are enriched with chromatin accessibility regulators such as H3K4me3, H3K4me1, H3K36me3, H3K27ac, histone variant H3.3, and BRD4. Finally, we demonstrate that enhancer elements are highly enriched in highly coordinated genes. Our study demonstrates that epigenomic states contribute to coordinated allelic bursting to fine-tune gene expression during induced pluripotent stem cell reprogramming.


Conflict of interest statement

S Gayen is an advisor to Bangalore Bio Cluster.

Figures

Figure 1.
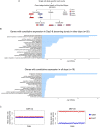
Figure 1.. Genome-wide profiling of bursty expression and dynamic autosomal random monoallelic expression in different stages of MEF to induced pluripotent stem cell (iPSC) reprogramming.
(A) A diagrammatical representation of the “two-state model” of transcriptional bursting. Kon is the rate of transcriptional activation of a gene; Koff is the rate at which a gene becomes transcriptionally inactive; S is the rate of transcription of a gene in an active state; d is the rate of mRNA decay; burst kinetics is represented through Kon (burst frequency) and S/Koff (burst size). (B) Graphical representation of OSKM (Oct-3/4, Sox2, Klf4, and c-Myc)-mediated reprogramming of hybrid MEF cells (129S1 X CAST) and collection of cells of intermediate stages day 8, day 9, day 10, day 12, and iPSCs. (C) Plots representing UMAP-based clustering of cells of the different stages of reprogramming. (D) Quantification of the percent of genes exhibiting bursty expression across all-day points of reprogramming. The number of bursty genes in day 0: 1,769 (of 1,886 biallelic genes), day 8: 1,869 (of 1,968 biallelic genes), day 9: 1,921 (of 2,004 biallelic genes), day 10: 1,993 (of 2,058 biallelic genes), day 12A: 2,544 (of 2,723 biallelic genes), day 12B: 2,585 (of 2,678 biallelic genes), and iPSC: 1,901 (of 2,137 biallelic genes). (E) Cross-comparison plot of bursty and constitutive genes across the different stages of reprogramming. (F) Gene ontology (GO) enrichment analysis of 756 genes that remain bursty across all-day points and 60 genes that are constitutive in iPSCs but bursty in other-day points. (G) Plots representing the percent of genes with different allelic expression categories throughout different stages of reprogramming; Cat 1: nonrandom monoallelic, Cat 2: random monoallelic with one allele, Cat 3: random monoallelic with either allele, Cat 4: biallelic.
Figure S1.
Figure S1.. Related to Fig 1.
(A) Outline of categorization of bursty and constitutive genes through SCALE analysis. (B) Gene ontology analysis. (C) Plots representing allele-specific expression of autosomal and X-linked genes in MEF(d0) cells.
Figure 2.
Figure 2.. Profiling of allelic burst kinetics and coordination.
(A, B) Plots representing correlation between (A) allelic burst frequency across different stages of reprogramming day 0 MEF (r = 0.725), day 8 (r = 0.705), day 9 (r = 0.689), day 10 (r = 0.64), day 12A (r = 0.69), day 12B (r = 0.69) and induced pluripotent stem cells (iPSCs) (r = 0.778) and (B) allelic burst size in day 0 MEF (r = 0.741), day 8 (r = 0.757), day 9 (r = 0.747), day 10 (r = 0.772), day 12A (r = 0.66), day 12B (r = 0.80) and iPSCs (r = 0.76). Genes that exhibit significant differences in burst frequency and size between two alleles have been marked by red triangles. (C) Smooth scatterplots representing bursting coordination between two alleles of genes for day 0 MEF, day 8, day 9, day 10, day 12A, day 12B, and iPSCs. Percent of cells expressing neither allele (p0) is plotted with the percent of cells expressing both alleles (p2); the blue diagonal line represents perfect coordination (p0 + p2 = 1), whereas the red curve signifies independent bursting with shared kinetics. Different categories of genes based on allelic bursting coordination: low p0 high p2 (green filled squares), perfectly coordinated (p0 + p2 > 0.90 marked by gray asterisk between blue dotted diagonal lines), independent genes marked by rosewood triangles (between upper and lower red curved lines, with a threshold of +0.05 signified by upper red curve and −0.05, signified by the lower red curve), and semi-coordinated genes marked with persian blue dots.
Figure 3.
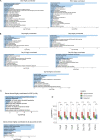
Figure 3.. Highly coordinated genes are enriched to induced pluripotent stem cell (iPSC) reprogramming-related processes.
(A) Gene ontology (GO) enrichment analysis of highly coordinated genes in day 0 MEF and iPSCs. (B) Gene ontology (GO) enrichment analysis of highly coordinated genes in intermediate stages of reprogramming: day 8, day 9, day 10, and day 12 cells. (C) Gene ontology (GO) enrichment analysis of genes (n = 52) that become highly coordinated in iPSCs (top) and genes (n = 25) that maintain highly coordinated allelic bursting through all-day points. (D) Plot representing the expression level (reads per kilobase million) of highly coordinated, semi-coordinated, and independent genes across different stages of reprogramming (Mann–Whitney U test: P-value < 0.0001; **** P-value < 0.01; **).
Figure S2.
Figure S2.. Related to Fig 3.
(A) Cross-comparison plot of highly coordinated, semi-coordinated and independent genes across day 0 MEF, day 8, day 10, day 12, and induced pluripotent stem cells. (B) Gene ontology (GO) enrichment analysis of genes (n = 266) that remained semi-coordinated in all-day points (top) and highly coordinated genes (n = 33) in day 0 MEF that became semi-coordinated in other stages.
Figure 4.
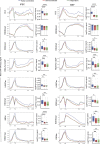
Figure 4.. Comparison of allelic chromatin accessibility of highly coordinated, semi-coordinated, and independent genes.
(A) Quantitative analysis of allelic accessibility enrichment in the gene body and across 3 kb upstream of TSS and 3 kb downstream of TES of all autosomal genes, highly coordinated, semi-coordinated, and independent genes throughout different stages of reprogramming: day 0, day 8, day 10, day 12, and induced pluripotent stem cells. In the boxplots, the line inside each of the boxes denotes the median value, and the edges of each box represent 25% and 75% of dataset, respectively (Mann–Whitney U test: P-value < 0.0001; **** P-value < 0.001; *** P-value < 0.01; ** and P-value < 0.05; *). (B) Allelic accessibility enrichment analysis in the gene body and across 3 kb upstream of TSS and 3 kb downstream of TES of genes that remain semicordinated or highly coordinated throughout the reprogramming (Mann–Whitney U test: P-value < 0.05; *).
Figure S3.
Figure S3.. Related to Fig 4.
(A) Allelic chromatin accessibility for X-linked genes. Quantification of enrichment of allelic accessibility across the gene body and 3 kb upstream of TSS and 3 kb downstream of TES of X-linked genes in all-day points of reprogramming. In the boxplots, the line inside of each box signifies median value, whereas the edges of each box denote 25% and 75% of the datasets (Mann-Whitney U test: P-value < 0.0001; ****). (B) Plots representing allelic accessibility enrichment for genes that converted from semi-coordinated in all days to highly coordinated in induced pluripotent stem cells. In the boxplots, the line inside each of the boxes denotes the median value, and the edges of each box represent 25% and 75% of the dataset, respectively (Mann–Whitney U test: P-value < 0.001; *** P-value < 0.01; ** and P-value < 0.05; *).
Figure 5.
Figure 5.. Binding kinetics of TFs between alleles correlate with the allelic bursting coordination.
Left: Plots showing the correlation of TFs binding score between alleles of highly coordinated, semi-coordinated, and independent genes throughout different stages of reprogramming: day 0, day 8, day 10, day 12, and induced pluripotent stem cells. TFs that exhibit significant differences in binding between two alleles have been marked by red triangles. Right: Venn diagram representing the comparison of TFs that exhibit significant differences in binding between two alleles across highly coordinated, semi-coordinated, and independent genes.
Figure 6.
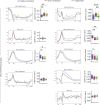
Figure 6.. Correlation between occupancy of chromatin marks and degree of allelic bursting coordination.
Comparison of enrichment of different chromatin accessibility-related factors in the gene body and across 2 kb upstream of TSS and 2 kb downstream of TES of highly coordinated, semi-coordinated, and independent genes in MEF and induced pluripotent stem cells. In the boxplots, the line inside each of the boxes denotes the median value and the edges of each box represent 25% and 75% of dataset, respectively (Mann–Whitney U test: P-value < 0.0001; **** P-value < 0.001; *** P-value < 0.01; ** and P-value < 0.05; *).
Figure S4.
Figure S4.. Related to Fig 6.
Comparison of enrichment of different chromatin accessibility related factors in the gene body and across 2 kb upstream of TSS and 2 kb downstream of TES of highly coordinated, semi-coordinated, and independent genes in MEF and induced pluripotent stem cells.
Figure S5.
Figure S5.. Related to Fig 6.
(A) Cross-comparison plot of highly coordinated, semi-coordinated, and independent genes across day 0 MEF and induced pluripotent stem cells. (B) Plots representing quantitative enrichment of different chromatin accessibility-related factors (H3K27ac, H3.3, H3K36me3, and RNA PolII-S2P) in the gene body and across 2 kb upstream of TSS and 2 kb downstream of TES of genes switching or maintaining coordination pattern between MEF and induced pluripotent stem cells.
Figure S6.
Figure S6.. Related to Fig 6.
(A) Chromatin state profiling through ChromHMM (A) Left: heat map showing the emission parameters in which rows represent 10 different chromatin states based on seven different histone marks (H3K9me3, H3K27me3, H3K4me3, H3K4me2, H3K4me1, H3K27ac, and H3K36me3) in induced pluripotent stem cells. Right: heat map representing the enrichment of different chromatin states in highly coordinated, semi-coordinated, and independent genes and their TSS neighbourhood and TES neighbourhood in induced pluripotent stem cells. (B) Left: heat map showing the emission parameters in which rows represent 10 different chromatin states in MEFs. Right: heat map representing the enrichment of different chromatin states in highly coordinated, semi-coordinated, and independent genes and their TSS neighbourhood and TES neighbourhood in MEFs.
Figure 7.
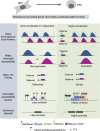
Figure 7.. Epigenomic states mediates allelic bursting coordination.
Allelic chromatin accessibility is linked to allelic transcriptional bursting coordination. Genes with highly coordinated allelic bursting possess equivalent allelic chromatin accessibility. On the contrary, semi-coordinated or independent genes allelic chromatin accessibility differs. Importantly, highly coordinated genes are highly enriched with chromatin accessibility regulators and enhancer elements.

Similar articles

References

    1. Abe K, Schauer T, Torres-Padilla ME (2022) Distinct patterns of RNA polymerase II and transcriptional elongation characterize mammalian genome activation. Cell Rep 41: 111865. 10.1016/j.celrep.2022.111865 - DOI - PubMed
    1. Aldiri I, Xu B, Wang L, Chen X, Hiler D, Griffiths L, Valentine M, Shirinifard A, Thiagarajan S, Sablauer A, et al. (2017) The dynamic epigenetic landscape of the retina during development, reprogramming, and tumorigenesis. Neuron 94: 550–568.e10. 10.1016/j.neuron.2017.04.022 - DOI - PMC - PubMed
    1. Altendorfer E, Mochalova Y, Mayer A (2022) BRD4: A general regulator of transcription elongation. Transcription 13: 70–81. 10.1080/21541264.2022.2108302 - DOI - PMC - PubMed
    1. Bartman CR, Hsu SC, Hsiung CCS, Raj A, Blobel GA (2016) Enhancer regulation of transcriptional bursting parameters revealed by forced chromatin looping. Mol Cell 62: 237–247. 10.1016/j.molcel.2016.03.007 - DOI - PMC - PubMed
    1. Bauer M, Vidal E, Zorita E, Üresin N, Pinter SF, Filion GJ, Payer B (2021) Chromosome compartments on the inactive X guide TAD formation independently of transcription during X-reactivation. Nat Commun 12: 3499. 10.1038/S41467-021-23610-1 - DOI - PMC - PubMed

Publication types

LinkOut - more resources