. 2024 Feb;13(2):e12410.
doi: 10.1002/jev2.12410.

Transfer of inflammatory mitochondria via extracellular vesicles from M1 macrophages induces ferroptosis of pancreatic beta cells in acute pancreatitis

Affiliations

Transfer of inflammatory mitochondria via extracellular vesicles from M1 macrophages induces ferroptosis of pancreatic beta cells in acute pancreatitis

Yuhua Gao et al. J Extracell Vesicles. 2024 Feb.

Erratum in

Abstract

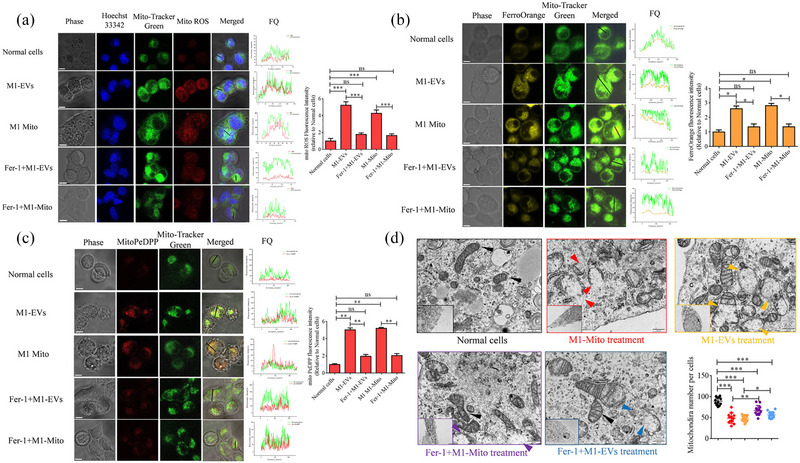
Extracellular vesicles (EVs) exert a significant influence not only on the pathogenesis of diseases but also on their therapeutic interventions, contingent upon the variances observed in their originating cells. Mitochondria can be transported between cells via EVs to promote pathological changes. In this study, we found that EVs derived from M1 macrophages (M1-EVs), which encapsulate inflammatory mitochondria, can penetrate pancreatic beta cells. Inflammatory mitochondria fuse with the mitochondria of pancreatic beta cells, resulting in lipid peroxidation and mitochondrial disruption. Furthermore, fragments of mitochondrial DNA (mtDNA) are released into the cytosol, activating the STING pathway and ultimately inducing apoptosis. The potential of adipose-derived stem cell (ADSC)-released EVs in suppressing M1 macrophage reactions shows promise. Subsequently, ADSC-EVs were utilized and modified with an F4/80 antibody to specifically target macrophages, aiming to treat ferroptosis of pancreatic beta cells in vivo. In summary, our data further demonstrate that EVs secreted from M1 phenotype macrophages play major roles in beta cell ferroptosis, and the modified ADSC-EVs exhibit considerable potential for development as a vehicle for targeted delivery to macrophages.

Keywords: M1 macrophages; extracellular vesicles; ferroptosis; mitochondria; pancreatic beta cells.


Conflict of interest statement

The authors declare no conflicts of interest.

Figures

FIGURE 1
FIGURE 1
EVs derived from macrophages containing packaged mitochondria. (a) Word cloud image illustrating the subcellular localization annotations found in the differential protein between M1‐EVs and M0‐EVs. The mitochondria component was enclosed within M1‐EVs. The detailed list of differential proteins can be found in Table S1. (b) Western blot analysis was conducted to examine the presence of EV‐positive‐markers, TSG101, CD63, CD9, and Alix, EV‐negative‐markers, Calnexin, as well as the mitochondrial marker ATP5A. (c) Immuno‐electron microscope analysis was performed to investigate the presence of ATP5A in M1‐EVs. (d) Western blot analysis was conducted to assess the presence of mitochondrial major components, including VDAC, COX IV, and PDHA in EVs. (e) Schematic and a representative gel electrophoresis image of whole‐genome amplification (using 66 overlapping PCR amplicons covering the complete mtDNA genome) from M1macrophages‐derived EV‐DNA.
FIGURE 2
FIGURE 2
The transfer of mitochondria between M1 macrophages and Beta TC‐6 cells and the subsequent analysis of apoptosis in Beta TC‐6 cells were investigated. (a) Representative images of mitochondria transfer between M1 macrophages and Beta TC‐6 cells (left panel). Additionally, mitochondrial fluorescent quantitation of M1 macrophages in Beta TC‐6 cells was conducted (right panel). (b) Apoptosis analysis was performed in Beta TC‐6 cells following co‐culture with M1 macrophages. This analysis included the examination of mitochondrial membrane potential (upper panel) and the identification of Annexin X‐positive cells (lower panel). n = 3, *P < 0.05, **P < 0.01, ***P < 0.001, ****P < 0.0001.
FIGURE 3
FIGURE 3
Analysis of apoptosis in Beta TC‐6 cells following incubation with mitochondria derived from macrophages. (a) Representative images demonstrate the incubation of Beta TC‐6 cells with varying concentrations of macrophage mitochondria, green fluorescence indicating macrophage mitochondria and red fluorescence indicating Beta TC‐6 cell mitochondria. Fluorescence quantitation (FQ) was performed to assess the levels of fluorescence. (b) Analysis of mitochondrial membrane potential in Beta TC‐6 cells after treatment with mitochondria derived from M1 or M2 macrophages, with different concentrations being utilized. (c) Analysis of Annexin X‐positive cells in Beta TC‐6 cells following exposure to different concentrations of mitochondria derived from M1 macrophages or M2 macrophages. n = 3, *P < 0.05, **P < 0.01, ***P < 0.001. ns, not significant.
FIGURE 4
FIGURE 4
Mitochondria transfer from macrophages to Beta TC‐6 cells through the transportation of extracellular vesicles (EVs). (a) Representative images of mitochondrial transfer from M1 macrophages to Beta TC‐6 cells via transport of EVs. Green fluorescence indicates mitochondria of macrophages, red fluorescence indicates mitochondria of Beta TC‐6 cells, and FQ represents fluorescence quantitation. (b) Analysis of mitochondrial membrane potential in Beta TC‐6 cells after treatment with various concentrations of EVs derived from M1 macrophages or M2 macrophages. (c) Analysis of Annexin X‐positive cells in Beta TC‐6 cells after treatment with various concentrations of EVs derived from M1 macrophages or M2 macrophages. n = 3, *P < 0.05, **P < 0.01, ***P < 0.001. ns, not significant.
FIGURE 5
FIGURE 5
Assessment of mitochondrial reactive oxygen species (mito ROS), ferrous ion (Fe2+) concentration, lipid peroxidation content, and mitochondrial morphology in Beta TC‐6 cells following various treatment protocols. (a) Representative images of mito ROS detection in Beta TC‐6 cells after treatment with M1 mitochondria, M1‐EVs, or a combination of both along with Fer‐1 (n = 3). (b) Representative images of assessment of Fe2+ level in Beta TC‐6 cells after different treatment using FerroOrange fluorescence probe (n = 3). (c) Representative images of detection of lipid peroxidation content in Beta TC‐6 cells after different treatments using mitoPeDPP fluorescence probe (n = 3). (d) Representative images of mitochondrial morphology and quantitative evaluation of mitochondria in Beta TC‐6 cells following various treatments, utilizing a transmission electron microscope (n = 10). Red triangle, abnormal mitochondria treated by mitochondria of M1 macrophages; Yellow triangle, abnormal mitochondria treated by EVs derived from M1 macrophages; Purple triangle, abnormal mitochondria treated by mitochondria of M1 macrophages combined with Fer‐1; Blue triangle, abnormal mitochondria treated by EVs derived from M1 macrophages combine with Fer‐1. *P < 0.05, **P < 0.01, ***P < 0.001.
FIGURE 6
FIGURE 6
Fer‐1 effectively restored the declining GSH/GSGG ratio, cellular function, and mitochondrial oxygen consumption rate (OCR) in Beta TC‐6 cells following various treatments. (a) Assessment of GSH/GSGG ratio in Beta TC‐6 cells following various treatments. (b) Analysis of insulin secretion from Beta‐TC‐6 cells following various treatments. (c and d) Analysis of Annexin X‐positive cells in Beta TC‐6 cells following various treatments. (e) OCR analysis in Beta TC‐6 cells following various treatments. n = 3, *P < 0.05, **P < 0.01, ***P < 0.001. ns, not significant.
FIGURE 7
FIGURE 7
Free mtDNA activated STING pathway in Beta TC‐6 cells following various treatments. (a) Representative images of immunofluorescence staining for mitochondrial marker, TOM20, and dsDNA in Beta TC‐6 cells. (b) Representative images of immunofluorescence staining for mitochondrial marker, TOM20, and cGAS in Beta TC‐6 cells. (c) Representative images of immunofluorescence staining for cGAS and dsDNA in Beta TC‐6 cells. The nucleus was stained with DAPI. Co‐localization analysis of immunofluorescence images using the Image J/colocalization plugin, which calculates Pearson's correlation coefficient. Scale bar = 20 μm. (d) Western blotting was used to analyze the phosphorylation of STING and expression of GPX4. Scale bar = 20 μm. n = 3, *P < 0.05, **P < 0.01, ***P < 0.001. (e) Schematic illustration of the mechanism by which M1‐EVs induce apoptosis in beta cells.
FIGURE 8
FIGURE 8
Surface modification of ADSC‐derived EVs and converting macrophage polarization in vitro. (a) Schematic diagram of the anti‐F4/80 antibody decorated on the surface of ADSC‐derived EVs. (b) Biological characteristics of F4/80‐EVs, including morphology, particulate size distribution, and EV marker proteins. The data indicated no significant change in morphology, particulate size distribution, or EV marker proteins but excluded F4/80 in normal EVs. To assess the integration of the rat anti‐F4/80 antibody with EVs, the lysates were immunoblotted with HRP‐conjugated donkey anti‐rat IgG. The results were positive in the F4/80‐EVs group and negative in the normal EVs group. (c) Various concentrations of ADSC‐secreted EVs (bare EVs) were incubated with M1 phenotype macrophages. (d) Various concentrations of anti‐F4/80‐decorated, ADSC‐secreted EVs (F4/80‐EVs) were incubated with M1 phenotype macrophages. Fluorescence images were used to evaluate the localization of FITC‐labelled NF‐κB1 (p50) and Cy5‐labelled IκBα. FITC fluorescence signals were initially observed in the nucleus, and after incubation with EVs, the FITC signals were co‐localized with Cy5 in the cytoplasm. Fluorescence quantitation of arbitrary single cells revealed fewer FITC signals in the F4/80‐EV group than in the EV group at the same concentration. FQ, fluorescence quantitation; a.u., arbitrary unit. (e) Flow cytometry of M1 (iNOS) and M2 (CD206) macrophage markers in macrophages after treatment with various concentrations (left) and quantification of iNOS and CD206 expression levels in EV and F4/80‐EV‐treated macrophages (n = 3). Black superscript, M0 versus each group; Laurel green superscript, M1 versus each group; Purple superscript, M2‐EVs versus each group. *P < 0.05, **P < 0.01, ***P < 0.001.
FIGURE 9
FIGURE 9
Targeted delivery of F4/80‐EVs to macrophages in vivo. (a) Schematic diagram of the effects of targeted delivery of F4/80‐EVs in AP mice. (b) Representative whole body and organ fluorescence imaging of EVs and F4/80‐EVs (1×10⁹ particles per mouse) in AP and normal mice. (c) Relative fluorescence intensity of EVs and F4/80‐EVs in the pancreas and spleen of normal and AP mice (n = 3). (d) Representative fluorescence imaging of pancreatic tissue sections. Scale bar = 100 μm. (e) Relative fluorescence intensity of EVs and F4/80‐EVs in the pancreas of normal and AP mice. (f) Location of F4/80‐EVs in pancreas sections from AP mice using the corresponding secondary antibody (labelled FITC) of F4/80. A rabbit polyclonal antibody against F4/80 labelled with Cy5 was used to verify macrophages. Double‐positive cells indicated macrophages that carried F4/80‐EVs. (g) Quantification of double‐positive cells in pancreas section of AP mice after treatment with various concentrations of F4/80‐EVs. n = 3. ns, not significant, *P < 0.05, **P < 0.01, ***P < 0.001.
FIGURE 10
FIGURE 10
Therapeutic efficacy of EVs and F4/80‐EVs in AP mice. (a) Treatment regimen used for EVs and F4/80‐EVs (left). Red points represent intraperitoneal injection of samples. Representative whole‐body fluorescence imaging of EVs and F4/80‐EVs in AP mice (right). Fluorescence images were obtained after 24 h of treatment with EVs and F4/80‐EVs. (b) Improvement of abnormal glucose metabolism in AP mice by various concentrations of EVs and F4/80‐EVs. (c and d) Representative immunofluorescence images of iNOS and CD206‐positive cells in the pancreas of variously treated AP mice. (e) Quantification of iNOS and CD206‐positive cells in pancreatic tissue at various time points after various treatments of AP mice. n = 3, *P < 0.05, **P < 0.01, ***P < 0.001, ns, not significant.
FIGURE 11
FIGURE 11
Schematic diagram illustrating the therapeutic impact of ADSC‐EVs and F4/80 antibody‐modified ADSC‐EVs on the aberrant glucose metabolism of an AP model mouse. ADSC, adipose‐derived stem cell; LPS, lipopolysaccharide; EVs, extracellular vesicles.

References

    1. Alonso‐Herranz, L. , Porcuna, J. , & Ricote, M. (2019). Isolation and purification of tissue resident macrophages for the analysis of nuclear receptor activity. Methods in Molecular Biology, 1951, 59–73. - PubMed
    1. Cai, W. J. , Zhang, J. L. , Yu, Y. Q. , Ni, Y. Q. , Wei, Y. , Cheng, Y. H. , Han, L. , Xiao, L. , Ma, X. , Wei, H. , Ji, Y. , & Zhang, Y. (2023). Mitochondrial transfer regulates cell fate through metabolic remodeling in osteoporosis. Advancement of Science, 10(4), e2204871. - PMC - PubMed
    1. Chen, J. , Fu, C. Y. , Shen, G. , Wang, J. , Xu, L. , Li, H. , Cao, X. , Zheng, M.‐Z. , Shen, Y.‐L. , Zhong, J. , Chen, Y.‐Y. , & Wang, L. L. (2022a). Macrophages induce cardiomyocyte ferroptosis via mitochondrial transfer. Free Radical Biology and Medicine, 190, 1–14. - PubMed
    1. Chen, J. , Zhong, J. J. , Wang, L. L. , & Chen, Y. Y. (2021). Mitochondrial transfer in cardiovascular disease: From mechanisms to therapeutic implications. Frontiers in Cardiovascular Medicine, 8, 771298. - PMC - PubMed
    1. Chen, T. , Ma, J. , Liu, Y. , Chen, Z. , Xiao, N. , Lu, Y. , Fu, Y. , Yang, C. , Li, M. , Wu, S. , Wang, X. , Li, D. , He, F. , Hermjakob, H. , & Zhu, Y. (2022b). iProX in 2021: Connecting proteomics data sharing with big data. Nucleic Acids Research., 50, D1522–D1527. - PMC - PubMed

Publication types