. 2024 Feb 6;15(1):968.
doi: 10.1038/s41467-024-45067-8.

A clinically applicable connectivity signature for glioblastoma includes the tumor network driver CHI3L1

Affiliations

A clinically applicable connectivity signature for glioblastoma includes the tumor network driver CHI3L1

Ling Hai et al. Nat Commun. .

Abstract

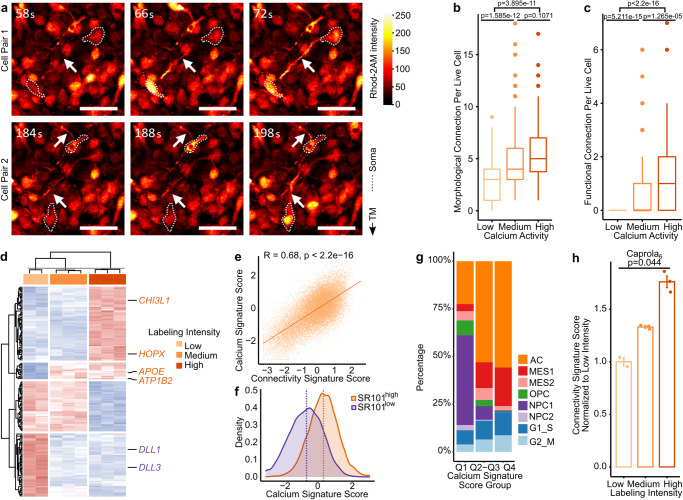
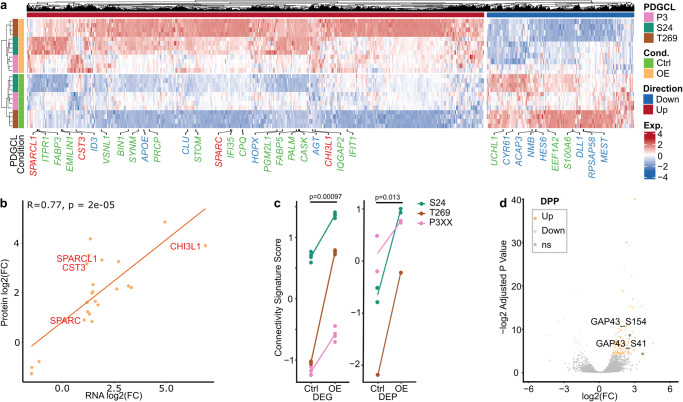
Tumor microtubes (TMs) connect glioma cells to a network with considerable relevance for tumor progression and therapy resistance. However, the determination of TM-interconnectivity in individual tumors is challenging and the impact on patient survival unresolved. Here, we establish a connectivity signature from single-cell RNA-sequenced (scRNA-Seq) xenografted primary glioblastoma (GB) cells using a dye uptake methodology, and validate it with recording of cellular calcium epochs and clinical correlations. Astrocyte-like and mesenchymal-like GB cells have the highest connectivity signature scores in scRNA-sequenced patient-derived xenografts and patient samples. In large GB cohorts, TM-network connectivity correlates with the mesenchymal subtype and dismal patient survival. CHI3L1 gene expression serves as a robust molecular marker of connectivity and functionally influences TM networks. The connectivity signature allows insights into brain tumor biology, provides a proof-of-principle that tumor cell TM-connectivity is relevant for patients' prognosis, and serves as a robust prognostic biomarker.


Conflict of interest statement

E.J., W.W. and F.W. report the patent (WO2017020982A1) entitled Agents for use in the treatment of glioma filed by the Ruprecht-Karls-Universität Heidelberg and Deutsches Krebsforschungszentrum Stiftung des öffentlichen Rechts. F.W. is co-founder of DC Europa Ltd (a company trading under the name Divide & Conquer) that is developing new medicines for the treatment of glioma. M-C.H. and J.H. report the patent (WO2020212537A1) entitled Circular permuted haloalkane transferase fusion molecules filed by the Max Planck Society. The remaining authors declare no competing interests.

Figures

Fig. 1
Fig. 1. Development of the connectivity signature.
a Experimental design of the connectivity signature development. Partly created with BioRender.com. b Intravital two-photon microscopy images of the xenografted tGFP overexpressing patient derived glioblastoma cell lines (PDGCLs) used for scRNA-seq, images representative of n = 3 mice. Bottom right; Representative confocal microscopy 3D rendering of a patient GB visualized with anti-nestin immunofluorescence. Arrowheads showing TMs. Scale bars depict 20 µm. c Two-photon microscopy images of xenografted S24 PDGCs with differential SR101 uptake (red) and constitutive tGFP expression (green), images representative of n = 3 mice. Arrow marks showing highly connected PDGCs and arrowheads showing lowly connected PDGCs. Scale bar depicts 20 µm. d Normalized SR101 intensity in highly and lowly connected xenografted S24 PDGCs. Boxes show 25th to 75th percentile, its middle line the median, whiskers the 5th to 95th percentile and individually plotted data points the outliers. n = 287 PDGCs (TM-connected) vs. n = 228 PDGCs (TM-unconnected) from n = 5 regions of interest (ROIs) of n = 3 mice. Two-tailed Mann-Whitney U test. e Development of the connectivity signatures. 13 differentially expressed genes (DEGs) between SR101high and SR101low PDGCs overlapped. See methods. f Heat map showing average expression levels of 71 scRNA-Seq-derived connectivity genes in SR101high and SR101low PDGCs from three xenografted PDGCLs. g Scatter plot showing the log2 fold changes of overlapping DEGs in scRNA-Seq and RNA-Seq datasets. Upregulated genes in red, downregulated genes in blue. Two-sided Spearman correlation test. h Enrichment map showing the most enriched GO biological processes in the scRNA-Seq-derived and RNA-Seq-derived gene sets. The pie chart size indicates the number of overlapping genes between gene sets. Lines connect GOs with overlapping genes. i, j Scatter plots showing connectivity signature scores based on connectivity genes derived from scRNA-Seq and RNA-Seq. Two-sided Pearson correlation test. i, SR101 xenograft scRNA-seq dataset. n = 35,822 PDGCs j TCGA IDH wt GB RNA-Seq dataset. n = 230 samples. f, i, j Values were Z-score scaled and centered across samples/PDGCs and winsorized to −3 and 3. Exact p-values are shown in the figure. Source data are provided as a Source Data file.
Fig. 2
Fig. 2. Highly and lowly connected single PDGCs correlate with distinct cell states in 35,822 single PDGCs of the SR101 xenograft scRNA-Seq dataset.
a Uniform manifold approximation and projections (UMAPs). Left, colored by the xenografted PDGCL. Middle, colored by SR101 intensity-based sorting. Right, colored by connectivity signature scores. b Connectivity signature scores in SR101high and SR101low groups of each PDGCL. n = 11,190 PDGCs (S24, SR101high) vs n = 4439 PDGCs (S24, SR101low), n = 10,245 PDGCs (T269, SR101high) vs n = 6933 PDGCs (T269, SR101low) and n = 2725 PDGCs (P3XX, SR101high) vs n = 290 PDGCs (P3XX, SR101low), respectively, from n = 3 mice per group. Two-sided Mann-Whitney U test. c Density plot of connectivity signature scores in SR101high and SR101low groups. Dotted lines depict medians. d UMAP of single PDGCs colored by cell states. e Distribution of cell states in SR101high and SR101low groups. f Connectivity signature scores in each cell state. g Dot plot of average expression levels of each connectivity gene in each cell state. Dot size indicates the frequency of cells that express the respective gene. Top, 40 upregulated connectivity genes in SR101high group. Bottom, 31 downregulated connectivity genes in SR101high group. h Venn diagram showing the number of overlapping genes between 71-gene connectivity signature and cell-state-defining genes. i RNA velocities projected on principal component analysis (PCA) embedding of xenografted S24 PDGCs. Streamline indicates the directional flow. Each dot is a single PDGC colored by cell state. j Directed partition-based graph abstraction (PAGA) graphs based on RNA velocity analysis in i. Each dot represents one cell state with the dot size indicating the number of PDGCs in the cell state. The width of the arrow indicates the transition possibility between cell states. ac, f Connectivity signature scores were Z-score scaled and centered across PDGCs and winsorized to −3 and 3. b, f Boxes show 25th to 75th percentile, its middle line the median, whiskers the 5th to 95th percentile and individually plotted data points the outliers. Exact p-values are shown in the figure. Source data are provided as a Source Data file.
Fig. 3
Fig. 3. The connectivity signature score reflects functional cell-to-cell connections.
a Time lapse micrographs of Ca2+ transients traveling between two S24 PDGCs pairs along a TM in vitro, images representative of n = 3 independent experiments. Dotted lines indicate somata of TM-connected PDGCs pairs. Arrowheads indicate intercellular Ca2+ transient traveling through TMs. Scale bars depict 50 µm. b, c Connections per S24-PDGC in low, medium and high Ca2+ activity groups. The three groups were the PDGCs of bottom 5% (n = 159 PDGCs), middle 5% (n = 100 PDGCs) and top 5% (n = 72 PDGCs). n = 3 recordings. Two-sided Mann-Whitney U test. b Number of functional connections. c Number of morphological connections. d Heatmap of 171 gene calcium signature in low, medium and high labeling intensity groups of S24-Caprola6 PDGCs. Genes overlapping with the connectivity signature are highlighted in orange (also upregulated in connectivity signature) and blue (also downregulated in connectivity signature). eg Calcium signature score in SR101 xenograft scRNA-Seq dataset. e Scatter plot showing correlation of calcium signature score and connectivity signature scores. n = 35,822 PDGCs. Two-sided Pearson correlation test. f Density plot of calcium signature scores in SR101high and SR101low groups. Dotted lines depict medians. g Distribution of cell states in three groups of calcium signature score separated by first quartile (Q1), two middle quartiles (Q2-Q3) and last quartile (Q4). h Connectivity signature scores in RNA-Seq data of S24-Caprola6 groups with low, medium and high labeling intensities. Shown is the mean and standard error of the mean (SEM, error bars). n = 2 replicates (low) vs n = 3 replicates (medium) vs n = 3 replicates (high). Two-sided Kruskal-Wallis test. eg Connectivity signature scores or gene expression were Z-score scaled and centered across PDGCs/samples and winsorized to −3 and 3. b, c Boxes show 25th to 75th percentile, its middle line the median, whiskers the 5th to 95th percentile and individually plotted data points the outliers. Exact p-values are shown in the figure. Source data are provided as a Source Data file.
Fig. 4
Fig. 4. Influences of pharmacologic perturbation and cellular density on TM-networks are reflected by connectivity signature score changes.
a Labeling intensities of FACS analyzed S24-Caprola6 PDGCs after Ctrl or BTP2 treatment. n = 21,792 PDGCs (Ctrl) vs n = 20,662 PDGCs (BTP2) of n = 2 replicates. Two-sided Mann-Whitney U test. b Fluorescence micrographs of S24 PDGCs after Ctrl or BTP2 treatment, images representative of n = 3 independent experiments. Scale bars depict 100 µm. c TM number per live cell in S24 PDGCs after Ctrl or BTP2 treatment. n = 19 ROIs from n = 2 independent experiments. Two-sided Mann–Whitney U test. d Percentage of death after Ctrl and BTP2 treatment. n = 19 ROIs from n = 2 independent experiments. Two-sided Mann-Whitney U test. e Connectivity signature scores normalized to Ctrl in RNA-Seq of S24 PDGCs after Ctrl or BTP2 treatment. Shown is the mean and standard error of the mean (SEM, error bars). n = 3 replicates. Two-sided t-test. fh S24 and T269 PDGCs grown in vitro under stem-like conditions in dense networks or sparse single clones. f Phase-contrast micrographs, representative of n = 2 independent experiments. Scale bars depict 100 µm. g Number of morphological connections per live cell. n = 50 PDGCs in n = 10 ROIs from n = 2 independent experiments per seeding condition and PDGCL. Arrows depict connections. Two-sided Mann–Whitney U test. h Connectivity signature scores in scRNA-Seq data of two conditions and two PDGCLs. n = 1150 PDGCs (S24, dense) vs n = 1541 PDGCs (S24, sparse) and n = 1347 PDGCs (T269, dense) vs 1350 PDGCs (T269, sparse) respectively, from n = 2 independent experiments per seeding condition and PDGCL. Two-sided Mann-Whitney U test. Connectivity signature scores or gene expression were Z-score scaled and centered across PDGCs/samples and winsorized to −3 and 3. a, c, d, g, h Boxes show 25th to 75th percentile, its middle line the median, whiskers the 5th to 95th percentile and individually plotted data points the outliers. Exact p-values are shown in the figure. Source data are provided as a Source Data file.
Fig. 5
Fig. 5. Connectivity signature scores and cell states in snRNA-Seq of patient samples and connectivity signature validation in GB patient sections.
a UMAP of 213,444 single cells from 21 GB patient samples. Left, colored by samples. Right, colored by cell types. b Frequency of malignant and non-malignant cell types in each sample. c Frequency of malignant cell states in each sample. d Frequency of connectivity signature score groups in each sample. A connectivity signature score is calculated for each cell and then assigned to one of the four score quartile groups (lower score quartile [Q1] - highest score quartile [Q4]). e Heat map showing connectivity signature scores and cell state signature scores in patient GCs. Each row represents one GC. f UMAPs of patient GCs. Top, colored by cell states. Bottom, colored by connectivity signature scores. g Two-dimensional representation of patient GCs according to cell state signature scores. Top, colored by cell states. Bottom, colored by connectivity signature scores. h Connectivity signature scores from RNA-Seq of six patients of the N2M2 pilot cohort selected for assessment of morphological tumor cell connectivity. n = 3 GB patients per group. One-sided t-test i Immunohistochemistry (IHC) staining of TMs with anti-nestin in GB patients with high (H1, H2, and H3) or low (L1, L2 and L3) connectivity signature scores, images representative of n = 9 ROIs from n = 3 patients per group. Arrows indicate TMs. Scale bars depict 20 µm. j Box plot of TM lengths (µm) in patients. Left, Per group. Right, Median TM lengths per ROI in each patient. n = 454 TMs (high) vs n = 444 TMs (low) of n = 9 ROIs in n = 3 patients per group. Two-sided Mann-Whitney U test. e, g, h Signature scores were Z-score scaled and centered across cells and winsorized to −3 and 3. h, j Boxes show 25th to 75th percentile, its middle line the median, whiskers the 5th to 95th percentile and individually plotted data points the outliers. Exact p-values are shown in the figure. Source data are provided as a Source Data file.
Fig. 6
Fig. 6. Connectivity signature scores in TCGA and CGGA GB cohorts.
a Connectivity signature scores in TCGA expression subtypes. Left: TCGA cohort tumors of MS (n = 90), CL (n = 76) and (PN, n = 61) subtypes. Right: CGGA cohort tumors of MS (n = 57), CL (n = 42) and PN (n = 42) subtypes. Two-sided Mann-Whitney U test. b Frequency of dominant cell states in each expression subtype. Left: TCGA. Right: CGGA. c Connectivity signature scores (Top) and normalized CHI3L1 expression levels (Bottom) in cells of tumor core (n = 3259) and invasion zone (n = 687) from GB scRNA-Seq dataset. Two-sided Mann–Whitney U test. d Connectivity signature scores in GB (n = 230), astrocytoma (n = 241) and oligodendroglioma (n = 176) from TCGA glioma samples. Two-sided Mann–Whitney U test. e Kaplan-Meier survival analysis in primary GB cohorts (Left, TCGA; Middle, CGGA; Right, GLASS) stratified into three quartile-based score groups of connectivity signature scores (lower score quartile [Q1] - highest score quartile [Q4]). Log-rank test. f, g CoxPH regression survival analysis in primary GB cohorts. Univariate analysis with continuous connectivity signature scores and multivariate analysis with connectivity signature scores adjusted for ages, genders and TCGA expression subtypes. f TCGA and CCGA datasets. g GLASS dataset. Surgical interval turned out to be prognostic. a, c, d Connectivity signature scores were Z-score scaled and centered across samples per cohort and winsorized to −3 and 3. a, c, d Boxes show 25th to 75th percentile, its middle line the median, whiskers the 5th to 95th percentile and individually plotted data points the outliers. Exact p-values are shown in the figure. Source data are provided as a Source Data file.
Fig. 7
Fig. 7. CHI3L1 plays a pivotal role in GB and correlates with survival.
a Median CHI3L1 expression levels in 31 tumor types and normal tissues from GEPIA. b Kaplan–Meier survival analysis in cohorts stratified into three score groups of CHI3L1 gene expression (lower score quartile [Q1] - highest score quartile [Q4]). Left, TCGA. n = 230. Right, CGGA. n = 141. Log-rank test. c CoxPH analysis in cohorts. Top, TCGA. Bottom, CGGA. Univariate analysis with CHI3L1 expression levels (log2[FPKM + 1]) and multivariate analysis adjusted for ages, genders and TCGA expression subtype. d Kaplan–Meier survival analysis in CSF proteomics dataset according to upper and lower median-stratified half groups of CHI3L1 protein intensity. Log-rank test. Exact p-values are shown in the figure. Source data are provided as a Source Data file.
Fig. 8
Fig. 8. CHI3L1 is a robust marker for connectivity.
a, b Scatter plots showing correlation between CHI3L1 expression level and connectivity signature scores. Connectivity signature scores were Z-score scaled and centered across samples and winsorized to −3 and 3. Two-sided Pearson correlation test. a TCGA b CGGA c CHI3L1 expression levels in malignant cell states and non-malignant cell types from our snRNA-Seq dataset of 21 GB patient samples. d Average normalized CHI3L1 expression per cell state in SR101high and SR101low xenografted PDGCs. n = 12,955 (AC, SR101high) vs n = 3542 (AC, SR101low), n = 4,234 (MES1, SR101high) vs 348 (MES1, SR101low), n = 1038 (MES2, SR101high) vs n = 689 (MES2, SR101low), n = 421 (OPC, SR101high) vs n = 873 (OPC, SR101low), n = 1370 (NPC1, SR101high) vs n = 4212 (NPC1, SR101low), n = 127 (NPC2, SR101high) vs n = 195 (NPC2, SR101low), n = 2587 (G1_S, SR101high) vs n = 936 (G1_S, SR101low), n = 1428 (G2_M, SR101low), n = 867 (G2_M, SR101high) vs n = 936 (G2_M, SR101low) PDGCs from n = 3 mice per group. Two-sided Mann-Whitney U test. e CHI3L1 expression levels in different labeling intensity groups of S24-Caprola6 and S24-CaProLaon. Shown is the mean and standard error of the mean (SEM, error bars). n = 2 (Caprola6, low) vs n = 3 (Caprola6, medium) vs n = 3 (Caprola6, high) replicates. n = 3 replicates (Caprolaon). Two-sided Kruskal-Wallis test. f IHC staining with anti-CHI3L1 in patients with high (H1, H2, and H3) and low (L1, L2, and L3) connectivity signature scores, images representative of n = 9 ROIs from n = 3 patients per group. Scale bars depict 20 µm. g, h CHI3L1 staining intensities. g Per group. Box plot of weighted histoscores. Boxes show 25th to 75th percentile, its middle line the median, whiskers the 5th to 95th percentile, and individually plotted data points the outliers. n = 3 patients per group. One-sided t-test. h Frequency of CHI3L1 staining intensity of cells. Exact p-values are shown in the figure. Source data are provided as a Source Data file.
Fig. 9
Fig. 9. CHI3L1 is a driver gene of TM connectivity.
a Fluorescence micrograph of S24 PDGCs treated with IgG or anti-CHI3L1 antibodies in vitro. tGFP (green) for TM visualization, Hoechst33342 (blue) for nuclei normalization and quantified objects (multicolor). The scale bar depicts 50 µm. b TM length per live cell after administration of IgG or anti-CHI3L1 antibodies. n = 12 ROIs of n = 2 independent experiments. Two-sided Mann-Whitney U test. c Fluorescence micrograph of S24 Ctrl and CHI3L1 OE PDGCs in vitro. Lipilight (green) for TM visualization, Hoechst33342 (blue) for nuclei normalization, and quantified objects (multicolor). Scalebar depicts 50 µm. d TM Length per S24 Ctrl and CHI3L1 OE PDGCs in vitro. n = 9 ROIs (Ctrl) vs n = 11 ROIs (CHI3L1 OE) of n = 2 independent experiments. Two-sided Mann-Whitney U test. e Immunofluorescence micrograph of xenografted S24 Ctrl and CHI3L1 OE PDGCs with anti-CHI3L1 (red), anti-nestin (green, TM marker) and anti-Ku-80 (blue, nuclear marker). f Weighted histoscores of xenografted S24 Ctrl and CHI3L1 OE PDGCs. n = 6 ROIs in n = 3 mice. Two-sided Mann-Whitney U test. g 3D micrographs of nestin-stained TMs of xenografted S24 Ctrl or CHI3L1 OE PDGCs. Scalebars depict 100 µm. hj TM-network parameters of S24 Ctrl and CHI3L1 OE xenografted PDGCs. n = 38 PDGCs in n = 16 ROIs in n = 4 mice. Two-sided Mann-Whitney U test. h TM Number. n = 38 PDGCs. i Number of TM connections. n = 38 PDGCs. j TM Length. n = 16 ROIs. k 3D micrographs of Ku80-stained nuclei of xenografted S24 Ctrl or CHI3L1 OE PDGCs. Scalebars depict 100 µm. l Number of nuclei per ROI. n = 16 ROIs in n = 4 mice. Two-sided Mann–Whitney U test. a, c, e, g, k Representative micrographs and the quantifications derived from the images match in terms of the number of independently performed experiments. b, d, f, hj, l Boxes show 25th to 75th percentile, its middle line the median, whiskers the 5th to 95th percentile and individually plotted data points the outliers. Exact p-values are shown in the figure. Source data are provided as a Source Data file.
Fig. 10
Fig. 10. Omics-based molecular fingerprinting of CHI3L1 OE PDGCLs.
a Heatmap showing DEG average expression levels of Ctrl and CHI3L1 OE PDGCLs. Data were Z-score scaled and centered across samples, and winsorized to −3 and 3. Colors: Purple, downregulated overlapping genes with connectivity signature score; orange, upregulated overlapping genes with connectivity signature score; grey, overlapping genes with DEPs. b Scatter plot showing the log2 fold changes of DEGs and DEPs in RNA-Seq and proteome datasets. 23 overlapping genes were found. Overlapping gens with the connectivity signature are depicted red. Two-sided Spearman correlation test. c Connectivity signature scores derived from RNA-Seq and proteomics datasets of Ctrl and CHI3L1 OE PDGCLs. Lines indicate the average in each PDGCL. n = 4 independent replicates per PDGCL in RNA-Seq. n = 2 independent replicates (S24 and T269) and n = 1 independent replicate (P3XX) in proteomics. Two-sided paired t-test. d Volcano plot comparing DPPs of Ctrl and CHI3L1 OE in PDGCLs P3XX, S24 and T269. Phosphosites shown in orange or purple have adj. p-value < 0.05. Phosphorylation sites of GAP43 are depicted. Padj is the adjusted value statistically corrected for multiple testing. Exact p-values are shown in the figure. Source data are provided as a Source Data file.

References

    1. Alexander BM, Cloughesy TF. Adult Glioblastoma. J. Clin. Oncol.: Off. J. Am. Soc. Clin. Oncol. 2017;35:2402–2409. doi: 10.1200/JCO.2017.73.0119. - DOI - PubMed
    1. Weller M, et al. EANO guidelines on the diagnosis and treatment of diffuse gliomas of adulthood. Nat. Rev. Clin. Oncol. 2021;18:170–186. doi: 10.1038/s41571-020-00447-z. - DOI - PMC - PubMed
    1. Neftel C, et al. An integrative model of cellular states, plasticity, and genetics for glioblastoma. Cell. 2019;178:835–849.e21. doi: 10.1016/j.cell.2019.06.024. - DOI - PMC - PubMed
    1. Osswald M, et al. Brain tumour cells interconnect to a functional and resistant network. Nature. 2015;528:93–98. doi: 10.1038/nature16071. - DOI - PubMed
    1. Venkatesh HS, et al. Electrical and synaptic integration of glioma into neural circuits. Nature. 2019;573:539–545. doi: 10.1038/s41586-019-1563-y. - DOI - PMC - PubMed

Substances