. 2024 Feb 7;9(1):28.
doi: 10.1038/s41392-024-01736-0.

DNA framework signal amplification platform-based high-throughput systemic immune monitoring

Affiliations

DNA framework signal amplification platform-based high-throughput systemic immune monitoring

Ye Chen et al. Signal Transduct Target Ther. .

Abstract

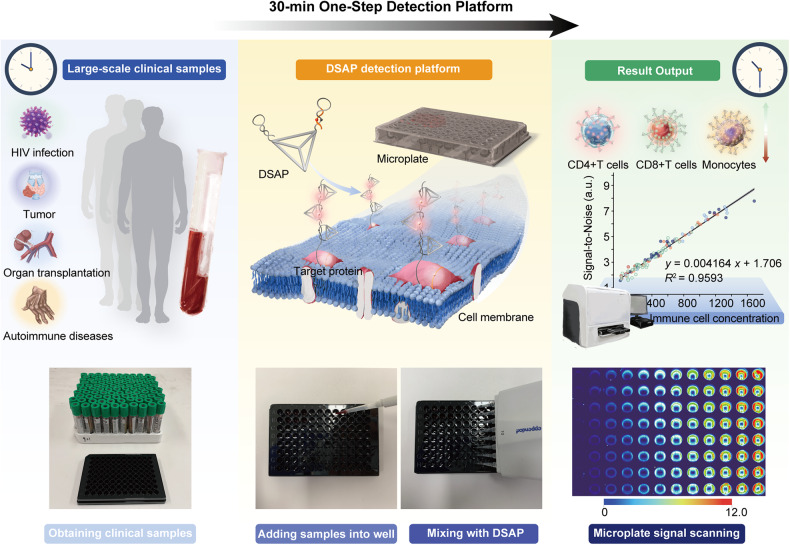
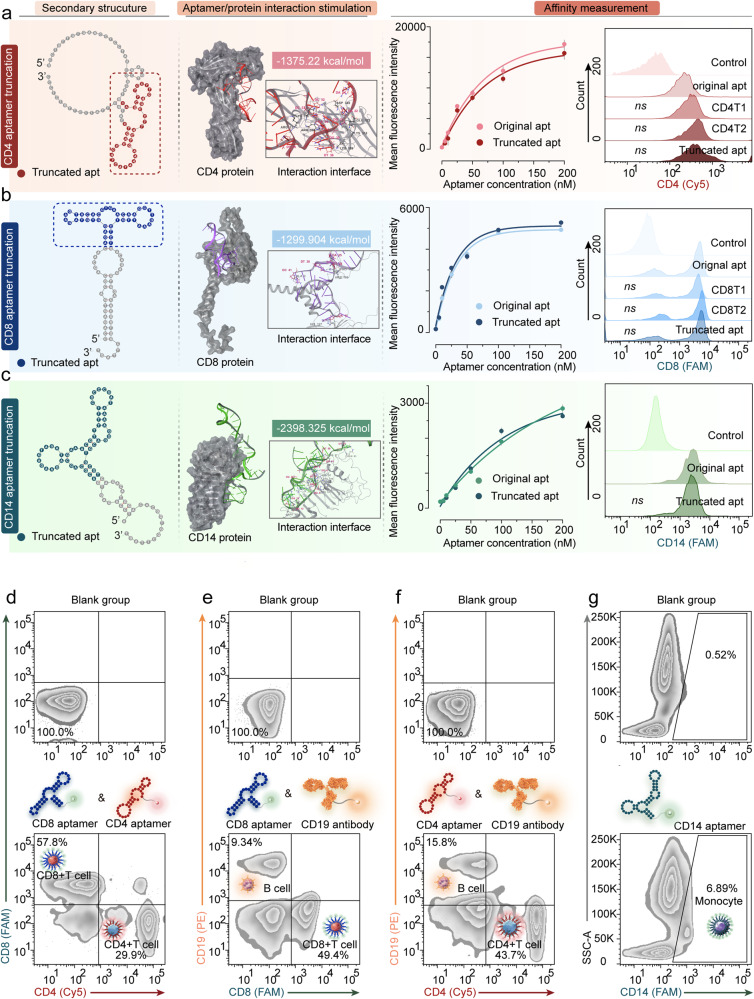
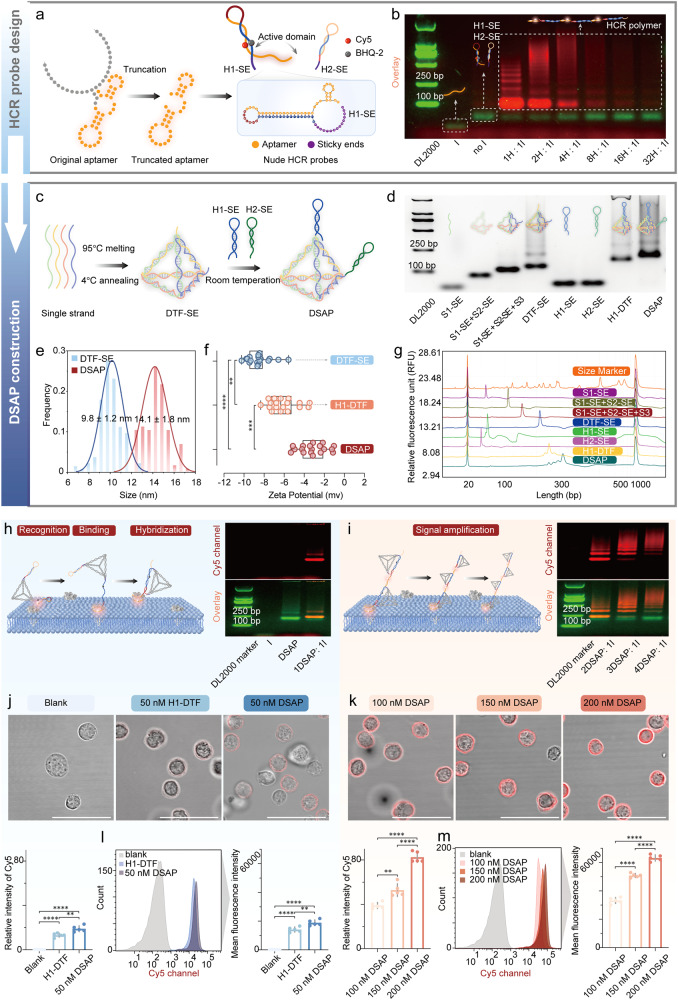
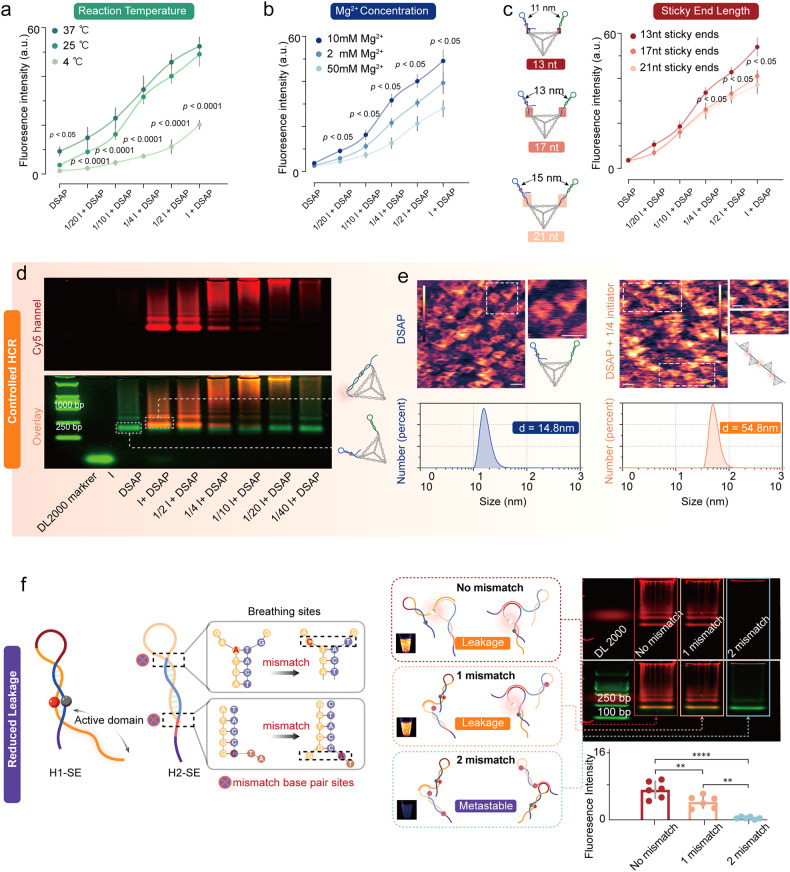
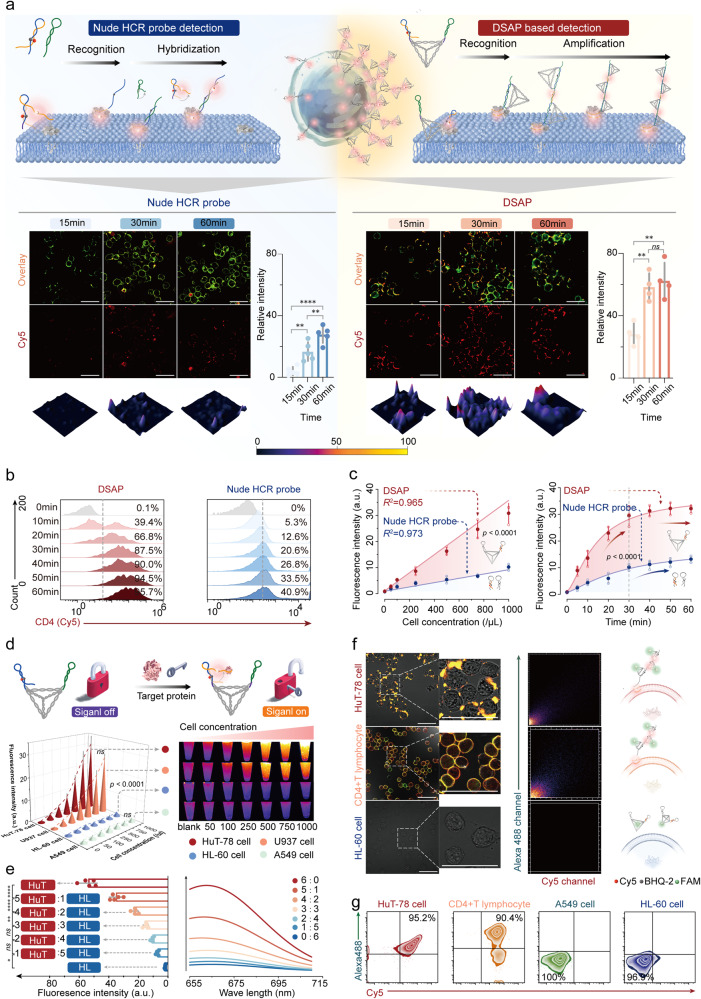
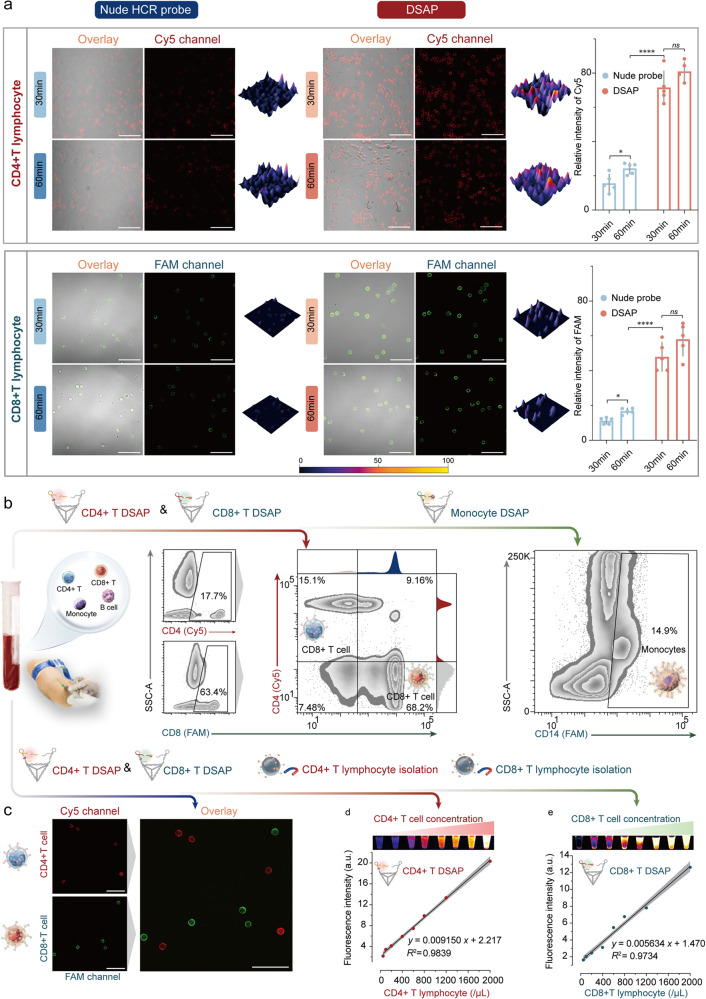
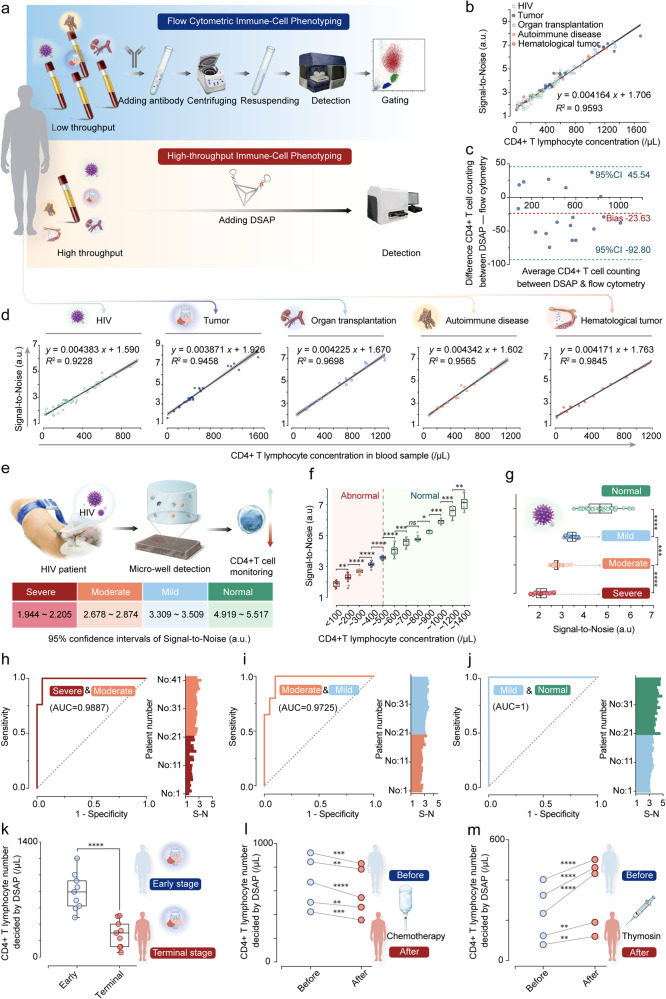
Systemic immune monitoring is a crucial clinical tool for disease early diagnosis, prognosis and treatment planning by quantitative analysis of immune cells. However, conventional immune monitoring using flow cytometry faces huge challenges in large-scale sample testing, especially in mass health screenings, because of time-consuming, technical-sensitive and high-cost features. However, the lack of high-performance detection platforms hinders the development of high-throughput immune monitoring technology. To address this bottleneck, we constructed a generally applicable DNA framework signal amplification platform (DSAP) based on post-systematic evolution of ligands by exponential enrichment and DNA tetrahedral framework-structured probe design to achieve high-sensitive detection for diverse immune cells, including CD4+, CD8+ T-lymphocytes, and monocytes (down to 1/100 μl). Based on this advanced detection platform, we present a novel high-throughput immune-cell phenotyping system, DSAP, achieving 30-min one-step immune-cell phenotyping without cell washing and subset analysis and showing comparable accuracy with flow cytometry while significantly reducing detection time and cost. As a proof-of-concept, DSAP demonstrates excellent diagnostic accuracy in immunodeficiency staging for 107 HIV patients (AUC > 0.97) within 30 min, which can be applied in HIV infection monitoring and screening. Therefore, we initially introduced promising DSAP to achieve high-throughput immune monitoring and open robust routes for point-of-care device development.


Conflict of interest statement

The authors declare no competing interests.

Figures

Fig. 1
Fig. 1
Schematic illustration of DSAP-based high-throughput immune monitoring. The wide application of immune monitoring in diverse diseases brings a huge burden for clinical detection. DSAP is a signal switching-off/on highly-sensitive detection platform for immune cells. It simplifies the clinical procedure to only one step and shortens detection time significantly. After obtaining a batch of samples, adding 100 μl blood samples into a microwell and mixed with 20 μl DSAP. Diverse immune cell numbers can be easily calculated according to signal-to-noise. The entire waiting time is no longer than 30 min. Therefore, large-scale samples can be rapidly detected in a very short time. The fluorescence visualization of microplates during DASP-based immune monitoring. The scale of the thermal figure is shown on the left
Fig. 2
Fig. 2
The structure-guided post-SELEX optimization of sensitive and specific aptamers of CD4+, CD8+ T lymphocytes, and monocytes. a The structure-guided post-SELEX optimization of CD4. The secondary structures of CD4 aptamers were predicted by Mfold software. The gray regions represent unfunctional regions in original aptamers. The colorized regions represent truncated aptamer sequences. The aptamer/protein interaction simulations were conducted for CD4 aptamer with human CD4 protein (PDB ID: 7T0R Chain C). The 3D model, PIPER pose energy, and interaction interfaces were displayed. The affinity measurements of the aptamers for detecting CD4+ T lymphocytes were carried out by flow cytometry. The dissociation curve of original aptamers and truncated aptamers was shown. The histogram of the original aptamer, CD4 T1, CD4 T2, and truncated aptamer is displayed. b The structure-guided post-SELEX optimization of CD8. The secondary structure of aptamer before and after truncation, the interaction simulation results, and affinity measurement were shown. c The structure-guided post-SELEX optimization of CD14. The secondary structure of aptamer before and after truncation, the interaction simulation results, and affinity measurement were shown. d The FCA of whole blood cells before and after being treated with Cy5-labeled CD4 aptamer and FAM-labeled CD8 aptamer. The CD8+/CD4− cells represent mature CD8+ T lymphocytes. The CD4+/CD8− cells belong to mature CD4+ T lymphocytes. e The FCA of whole blood cells before and after being treated with FAM-labeled CD8 aptamer and PE-labeled CD19 antibody. The CD8+/CD19− cells are CD8+ T lymphocytes and the CD19+/CD8− cells represent B cells. f The FCA of whole blood cells before and after being treated with Cy5-labeled CD4 aptamer and PE-labeled CD19 antibody. The CD4+/CD19− cells represent CD4+ T lymphocytes. The CD19+/CD4− cells belong to B cells. g The FCA of whole blood cells before and after being treated with FAM-labeled monocyte aptamer. The gated cells are monocytes. The error bars in (a) are determined by the standard deviation (SD) of the MFI from three parallel experiments. All the tested samples were technical replicates. The abbreviation ‘apt’ in a means aptamer
Fig. 3
Fig. 3
Design, fabrication, characterization, and functional verification of DSAP. a The fabrication of aptamer-based HCR probes. The truncated aptamer was embedded into the toehold and stem regions of H1-SE. The Cy5 and BHQ-2 were modified onto the bases in the stem regions. b The agarose gel electrophoresis (AGE) shows the fluorescence intensity and molecular weight changes of the reaction product between the HCR probe and initiator of varying molar ratios. The gel image is overlaid by GelRed channel (green) and Cy5 channel (red). The first panel is the DL2000 ladder, the second panel represents the initiator, the second panel is the mixture of H1-SE and H2-SE without an initiator, the fourth to the ninth panel is the reaction product between HCR probes (H1-SE, H2-SE) and the initiator of varying molar ratios. c The synthesis procedures of the DSAP. The DTF-SE was synthesized by four DNA oligos. The H1-SE and H2-SE were connected with DTF-SE via sticky ends. d The AGE shows the step-wise construction of the DSAP. e The particle size of DTF-SE and DSAP calculated by TEM images. Data are presented as the mean ± SD (n = 4). f The statistical diagram of the zeta potential of DTF-SE, Hairpin1-DTF (H1-DTF), and DSAP. g The capillary electrophoresis results show the step-wise construction of the DSAP. h, i The scheme and AGE showing the mechanism of the membrane protein recognition, binding, hairpin hybridization, and signal amplification by DSAP. j, k The CLSM characterized the signal amplification capacity of DSAP when detecting CD4+ T lymphocytes. As the CLSM shows, as the concentration of DSAP increased, the membrane fluorescence intensity became stronger. The histogram showed fluorescence intensity from three parallel experiments. l, m The FCA also displayed the Cy5 signal changes as the increased concentration of DSAP. The “H” represents HCR probes, including H1-SE and H2-SE, and the “I” represents the initiator. The **** represented p < 0.0001, *** represented p < 0.001. ** represented p < 0.01. Scale bars, 50 μm
Fig. 4
Fig. 4
The conditional and structural optimization of the HCR efficiency of DSAP. a The influence of reaction temperature on the HCR efficiency of the DSAP, including 4, 25, and 37 °C. b The influence of Mg2+ concentrations in the reaction system on the HCR efficiency of the DSAP, including 2 mM Mg2+, 10 mM Mg2+, and 50 mM Mg2+. c The influence of sticky end length on HCR efficiency of DSAP, including 13, 17, and 21 nt. The error bars in (ac) are SD according to three repetitive experiments. d The AGE showing the initiator, DSAP, and the reaction products between initiators and DSAP of different ratios. The red bands are generated by the Cy5 channel, and the green bands are generated by the GelRed channel. As the Figure shows, the initiator of lower concentration can trigger larger DNA polymers, but the initiator of higher concentration can trigger smaller DNA polymers. e The morphology and particle sizes of the DSAP and HCR reaction products between DSAP and initiator at the molar ratios of 4:1 were determined by AFM imaging and particle size analysis. The mean particle size is decided by three parallel measurements. f The breathing sites can trigger self-hybridization of H1-SE and H2-SE. The base pair mismatches in the breathing sites of H2-SE can improve the metastability of DSAP. The visualization of the DSAP with no mismatch, one mismatch, and two mismatches was displayed. The AGE and fluorescence intensity measurements were also shown for the corresponding group. The error bars in (af) are determined by the SD of the MFI from at least five parallel experiments. All the tested samples were technical replicates. The “I” represents the initiator. The **** represented p < 0.0001, ** represented p < 0.01. Scale bars, 10 nm
Fig. 5
Fig. 5
The excellent sensitivity, specificity, and stability of the DSAP. a The comparison between the DSAP and nude HCR probes in detecting membrane protein. CLSM images of HuT-78 cells treated with DSAP and nude HCR probes for 15, 30, and 60 min, respectively. The cell membranes were stained with DiO dye (green channel), and the released fluorescence from DSAP was Cy5. The statistical results of nude HCR probes and DSAP were shown by histogram. b The FCA of HuT-78 cells treated with DSAP and nude HCR probes from 0 to 60 min at 10 min intervals. c The MFI of HuT-78 cells at increasing concentrations after treatment with DSAP and nude HCR probes. The MFI of HuT-78 cells treated with the DSAP and nude HCR probes from 0 to 60 min. d The schematic illustration of signal switching off/on DSAP. The MFI and visualization of CD4+ cells (HuT-78 cells and U937 cells) and CD4− cells (HL-60 cells and A549 cells) of varying concentration after treatment with the DSAP. e The MFI and emission wave curve of the mixture containing HuT-78 cells and HL-60 cells of varying concentration ratios after treatment with DSAP. f CLSM images of HuT-78 cell, CD4+ T lymphocyte, and HL-60 cell, as well as colocalization profiles of Alexa 488 channel and Cy5 channel after treating FAM/Cy5/BHQ-2 labeled DSAP. The CLSM images were overlaid by the Cy5 channel and FAM channel. g The FCA of HuT-78 cell, CD4+ T cell, A549 cell and HL-60 cell treated with FAM/Cy5/BHQ-2 labeled DSAP. The error bars in (a, ce) are determined by the SD of the MFI from at least three parallel experiments. All the tested samples were technical replicates. The **** represented p < 0.0001, ** represented p < 0.01. Scale bars, 50 μm
Fig. 6
Fig. 6
The validation of DSAP for diverse immune cells. a The CLSM results of isolated human CD4+ T and CD8+ T lymphocytes treated with CD4 nude HCR probes and DSAP as well as CD8 nude HCR probes and DSAP for 30 and 60 min, respectively. The CD4 DSAP and nude HCR probes were modified with Cy5/BHQ-2, and the CD8 DSAP and nude HCR probes were modified with FAM/BHQ-1. The histogram on the right shows the statistical results from three parallel experiments. b The FCA of whole blood cells treated with CD4 DSAP and CD4 DSAP and CD14. c The CLSM of blood samples treated with both CD4 DSAP (red channel) and CD4 DSAP (green channel). d The MFI of isolated human CD4+ T lymphocytes at increasing concentrations after treatment with the DSAP. e The MFI of isolated human CD8+ T lymphocytes of increasing concentrations after treatment with the CD4 DSAP and CD4 DSAP. The dots in (d) and (e) represent the mean average of MFI from at least three parallel experiments. The gray bands in (d) and (e) represent the 95% confidence interval band. All the tested samples were technical replicates. Scale bars, 50 μm
Fig. 7
Fig. 7
The high accuracy in CD4+ T detection and HIV immunodeficiency staging by DSAP. a The workflow of flow cytometric immune-cell phenotyping and DSAP-based high-throughput immune-cell phenotyping for blood samples analysis. The dots represent S-N according to at least three times parallel experiments. The gray bands represent 95% confidence interval bands. b The linear relationship between S-N decided by DSAP and the CD4+ T lymphocyte number decided by flow cytometry. c The Bland-Altman analysis of the CD4+ T lymphocyte number decided by flow cytometry and DSAP when detecting 18 blood samples. The upper and lower limit 95% confidence intervals and the mean bias of difference values are shown. d DSAP measured the blood samples from the patients with various diseases, and the linear relationships between S-N decided by DSAP and the CD4+ T lymphocyte number decided by FCA were displayed. The dots represent S-N according to at least three times parallel experiments. The gray bands represent 95% confidence interval bands. e The schematic illustration of CD4+ T lymphocyte monitoring by DSAP for HIV patients. The 95% confidence intervals of S-N were decided by DSAP when detecting blood samples from patients with mild, moderate, and severe immunodeficiency. f The boxplot represents the signal-to-noise by DSAP when detecting blood samples with different CD4+ T lymphocyte concentrations. g The signal-to-noise by DSAP when detecting blood samples from HIV patients with mild, moderate, and severe immunodeficiency. The ROC curve reflects the diagnostic accuracy of DSAP in diagnosing mild versus moderate immunodeficiency (h), moderate versus severe immunodeficiency (i), and severe immunodeficiency versus normal conditions (j). k The CD4+ T lymphocyte number was decided by DSAP of ten cancer patients of the terminal stage and ten of the early stage. The dots represent the CD4+ T lymphocyte mean concentration of every patient by DSAP, according to three repetitive experiments. l The CD4+ T lymphocyte number decided by DSAP for five patients before and after chemotherapy. The dots represent the CD4+ T lymphocyte mean concentration decided by DSAP, according to three repetitive experiments. m The CD4+ T lymphocyte number decided by DSAP for five patients before and after thymosin. The dots represent the CD4+ T lymphocyte mean concentration decided by DSAP, according to three repetitive experiments. All the tested samples were technical replicates. The **** represented p < 0.0001, *** represented p < 0.001, ** represented p < 0.01, * represented p < 0.05. The abbreviation S-N represents signal-to-noise

Similar articles

Cited by

References

    1. Hartmann FJ, Bendall SC. Immune monitoring using mass cytometry and related high-dimensional imaging approaches. Nat. Rev. Rheumatol. 2020;16:87–99. doi: 10.1038/s41584-019-0338-z. - DOI - PMC - PubMed
    1. Hiam-Galvez KJ, Allen BM, Spitzer MH. Systemic immunity in cancer. Nat. Rev. Cancer. 2021;21:345–359. doi: 10.1038/s41568-021-00347-z. - DOI - PMC - PubMed
    1. Ishiguro T, et al. An anti-glypican 3/CD3 bispecific T cell-redirecting antibody for treatment of solid tumors. Sci. Transl. Med. 2017;9:eaal4291. doi: 10.1126/scitranslmed.aal4291. - DOI - PubMed
    1. Cheng C, et al. Immune monitoring reveals fusion peptide priming to imprint cross-clade HIV-neutralizing responses with a characteristic early B cell signature. Cell Rep. 2020;32:107981. doi: 10.1016/j.celrep.2020.107981. - DOI - PMC - PubMed
    1. Aarntzen EH, Figdor CG, Adema GJ, Punt CJ, de Vries IJ. Dendritic cell vaccination and immune monitoring. Cancer Immunol. Immunother. 2008;57:1559–1568. doi: 10.1007/s00262-008-0553-y. - DOI - PMC - PubMed

Publication types