. 2024 Feb 6;14(1):79.
doi: 10.1038/s41398-024-02800-7.

Prefrontal cortical dopamine deficit may cause impaired glucose metabolism in schizophrenia

Affiliations

Prefrontal cortical dopamine deficit may cause impaired glucose metabolism in schizophrenia

Qiongqiong Wu et al. Transl Psychiatry. .

Abstract

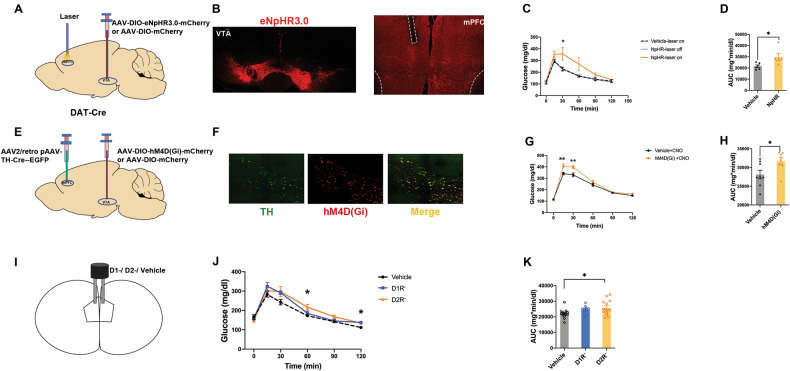
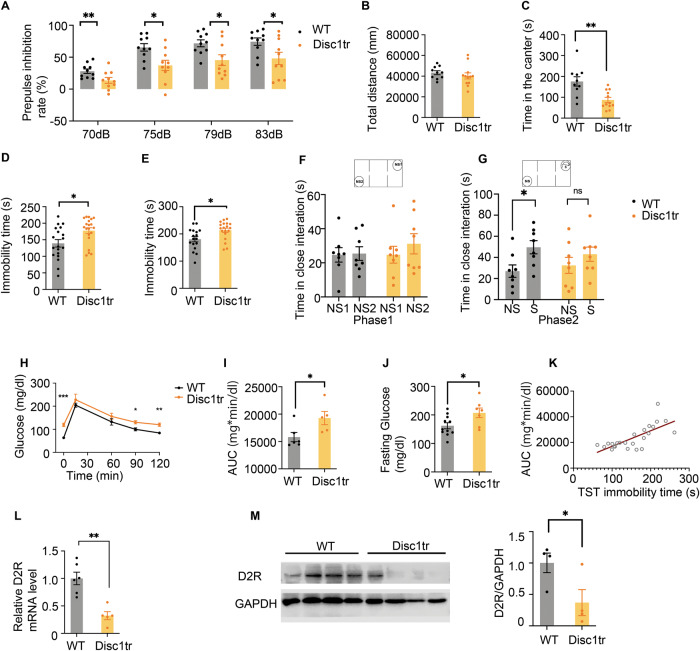
The brain neurotramsmitter dopamine may play an important role in modulating systemic glucose homeostasis. In seven hundred and four drug- naïve patients with first-episode schizophrenia, we provide robust evidence of positive associations between negative symptoms of schizophrenia and high fasting blood glucose. We then show that glucose metabolism and negative symptoms are improved when intermittent theta burst stimulation (iTBS) on prefrontal cortex (PFC) is performed in patients with predominantly negative symptoms of schizophrenia. These findings led us to hypothesize that the prefrontal cortical dopamine deficit, which is known to be associated with negative symptoms, may be responsible for abnormal glucose metabolism in schizophrenia. To explore this, we optogenetically and chemogenetically inhibited the ventral tegmental area (VTA)-medial prefrontal cortex (mPFC) dopamine projection in mice and found both procedures caused glucose intolerance. Moreover, microinjection of dopamine two receptor (D2R) neuron antagonists into mPFC in mice significantly impaired glucose tolerance. Finally, a transgenic mouse model of psychosis named Disc1tr exhibited depressive-like symptoms, impaired glucose homeostasis, and compared to wild type littermates reduced D2R expression in prefrontal cortex.


Conflict of interest statement

The authors declare no competing interests.

Figures

Fig. 1
Fig. 1. Inhibition of VTA-mPFC dopamine projection or blocking dopamine receptors in mPFC resulted in glucose intolerance.
A Schematic experimental strategy for optogenetic inhibition the VTA-mPFC dopamine pathway in DAT-Cre mice. B Confocal image showing AAV2/9-hEF1a-DIO-eNpHR 3.0-mCherry-WPRE-pA in VTA and eNpHR 3.0 terminals and fiber optic cannula placements in mPFC. C, D Glucose tolerance of NpHR groups with laser-on, vehicle groups with laser-on, NpHR groups with laser-off (The comparison was only made between NpHR+laser-on and vehicle+laser-on. 0 min: F1,9 = 0.186, P = 0.676; 15 min: F1,9 = 3.829, P = 0.082; 30 min: F1,9 = 6.262, P = 0.034; 60 min: F1,9 = 4.249, P = 0.069; 90 min: F1,9 = 4.011, P = 0.076; 120 min: F1,9 = 0.605, P = 0.457; n = 5-6). AUC, area under curves in glucose curve to present glucose tolerance (F1,9 = 6.035, P = 0.036; n = 5-6). E Schematic experimental strategy to chemogenetic inhibition the VTA-mPFC dopamine projection. F Confocal image showing AAV2/retro pAAV-TH-Cre and hM4D(Gi)-mCherry expression in VTA. G, H Glucose tolerance of Vehicle+CNO, hM4D(Gi)+CNO (0 min: F1,14 = 0.631, P = 0.440; 15 min: F1,14 = 10.360, P = 0.006; 30 min: F1,14 = 9.699, P = 0.008; 60 min: F1,14 = 1.460, P = 0.247; 90 min: F1,14 = 0.097, P = 0.760; 120 min: F1,14 = 2.701, P = 0.123; n = 8). AUC, area under curves in glucose curve to present glucose tolerance (F1,14 = 5.826, P = 0.030; n = 8). I Bilateral cannula placement of D1R and D2R antagonist microinjection in mPFC. J, K Glucose tolerance of D1R-, D2R- and vehicle groups. AUC, area under curves in glucose curve to present glucose tolerance (0 min: F2,34 = 0.976, P = 0.387; 15 min: F2,34 = 1.479, P = 0.242; 30 min: F2,34 = 2.644, P = 0.0.086; 60 min: F2,34 = 4.209, P = 0.023; 90 min: F2,34 = 3.310, P = 0.049; 120 min: F2,34 = 5.241, P = 0.010; AUC: F2,34 = 3.796, P = 0.033; post hoc test: *P < 0.05; n = 10-14). Error bars, ±s.e.m.
Fig. 2
Fig. 2. Impaired glucose metabolism and disrupted D2R expression in Disc1tr mice.
A Percentage of prepulse inhibition of the auditory startle reflex in four different prepulse intensities (70 dB, 75 dB, 79 dB, 83 dB) (70 dB: F1,18 = 6.348, P = 0.021; 75 dB: F1,18 = 8.123, P = 0.011; 79 dB: F1,18 = 6.937, P = 0.017; 83 dB: F1,18 = 5.450, P = 0.031; n = 10). B Total travel distance in open field test. No significant differences were observed (F1,20 = 0.739, P = 0.400; n = 10-12). C Exploration time in center area in open field test (F1,20 = 13.039, P = 0.002; n = 10–12). D Immobility in tail suspension test (F1,37 = 7.314, P = 0.010; n = 19–20). E, Immobility in force swim test (F1,34 = 7.366, P = 0.010, n = 17-19). F, G, Top panel, schematic diagram of three-chamber test, F Time in close interaction in Phase 1 for familiarization, no difference between non-social stimulus NS1 and NS2. G Time in close interaction when exposed to stranger mice (S) compare with non-social stimulus/NS (WT: F1,14 = 6.986, P = 0.019; Disc1tr: F1,14 = 1.087, P = 0.315; n = 8). H, I Glucose tolerance test for Disc1tr mice (0 min: F1.9 = 37.073, P = 0.000182; 15 min: F1.9 = 0.971, P = 0.350; 60 min: F1.9 = 1.449, P = 0.259; 90 min: F1,9 = 10.034, P = 0.011; 120 min: F1.9 = 19.964, P = 0.002; n = 5–6). AUC, area under curves above baseline in glucose curve (F1,9 = 5.848, P = 0.039; n = 5–6). J, Fasting glucose of blood sample collected from heart was examined (F1,16 = 5.688, P = 0.030; n = 7–11). K The correlation of glucose tolerance AUC and tail suspension test (TST) immobility time (r = 0.727, P < 0.0001, n = 24). L Quantitative analysis of D2R mRNA expression in PFC (F1,9 = 22.433, P = 0.001, n = 5–6). M, Protein levels of D2R in the PFC (F1,6 = 6.155, P = 0.048; n = 4). Error bars, ±s.e.m.

References

    1. Davis KL, Kahn RS, Ko G, Davidson M. Dopamine in schizophrenia: a review and reconceptualization. Am J Psychiatry. 1991;148:1474–86. doi: 10.1176/ajp.148.11.1474. - DOI - PubMed
    1. Akil M, Pierri JN, Whitehead RE, Edgar CL, Mohila C, Sampson AR, et al. Lamina-specific alterations in the dopamine innervation of the prefrontal cortex in schizophrenic subjects. Am J Psychiatry. 1999;156:1580–9. doi: 10.1176/ajp.156.10.1580. - DOI - PubMed
    1. Slifstein M, van de Giessen E, Van Snellenberg J, Thompson JL, Narendran R, Gil R, et al. Deficits in prefrontal cortical and extrastriatal dopamine release in schizophrenia: a positron emission tomographic functional magnetic resonance imaging study. JAMA Psychiatry. 2015;72:316–24. doi: 10.1001/jamapsychiatry.2014.2414. - DOI - PMC - PubMed
    1. Stenkrona P, Matheson GJ, Halldin C, Cervenka S, Farde L. D1-dopamine receptor availability in first-episode neuroleptic naive psychosis patients. Int J Neuropsychopharmacol. 2019;22:415–25. doi: 10.1093/ijnp/pyz017. - DOI - PMC - PubMed
    1. Karlsson P, Farde L, Halldin C, Sedvall G. PET study of D(1) dopamine receptor binding in neuroleptic-naive patients with schizophrenia. Am J Psychiatry. 2002;159:761–7. doi: 10.1176/appi.ajp.159.5.761. - DOI - PubMed