. 2024 Feb 6;10(1):64.
doi: 10.1038/s41420-024-01827-5.

Sulbactam protects neurons against double neurotoxicity of amyloid beta and glutamate load by upregulating glial glutamate transporter 1

Affiliations

Sulbactam protects neurons against double neurotoxicity of amyloid beta and glutamate load by upregulating glial glutamate transporter 1

Li Li et al. Cell Death Discov. .

Abstract

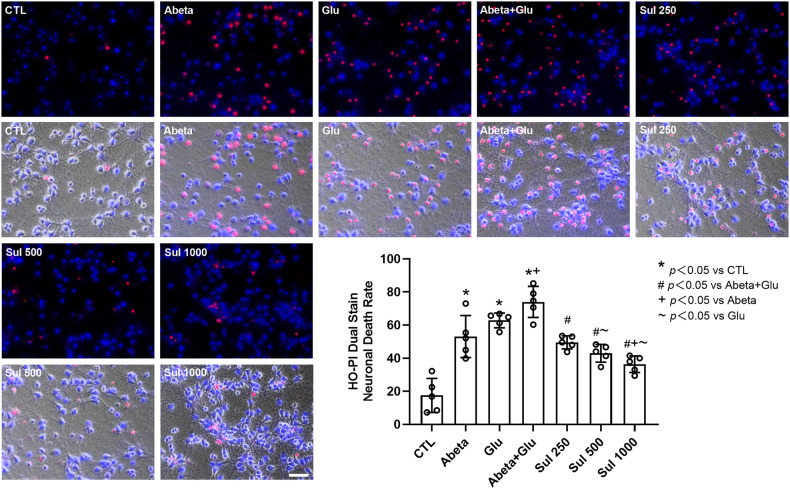
Amyloid beta (Abeta) synergistically enhances excitotoxicity of glutamate load by impairing glutamate transporter 1 (GLT1) expression and function, which exacerbates the development of Alzheimer's disease (AD). Our previous studies suggested that sulbactam can upregulate the expression levels and capacity of GLT1. Therefore, this study aims to investigate whether sulbactam improves neuronal tolerance against neurotoxicity of Abeta and glutamate load by up-regulating GLT1 in primary neuron-astrocyte co-cultures. Early postnatal P0-P1 Wistar rat pups' cortices were collected for primary neuron-astrocyte cultures. Hoechst-propidium iodide (HO-PI) stain and lactate dehydrogenase (LDH) assays were used to analyze neuronal death. Cell counting kit 8 (CCK8) was applied to determine cell viability. Immunofluorescence staining and western blotting were used to assess protein expressions including GLT1, B-cell lymphoma 2 (BCL2), BCL2 associated X (BAX), and cleaved caspase 3 (CCP3). Under the double effect of Abeta and glutamate load, more neurons were lost than that induced by Abeta or glutamate alone, shown as decreased cell viability, increased LDH concentration in the cultural medium, HO-PI positive stains, high CCP3 expression, and high BAX/BCL2 ratio resulting from increased BAX and decreased BCL2 expressions. Notably, pre-incubation with sulbactam significantly attenuated the neuronal loss and activation of apoptosis induced by both Abeta and glutamate in a dose-dependent manner. Simultaneously, both astrocytic and neuronal GLT1 expressions were upregulated after sulbactam incubation. Taken together, it could be concluded that sulbactam protected neurons against double neurotoxicity of Abeta and glutamate load by upregulating GLT1 expression. The conclusion provides evidence for potential intervention using sulbactam in AD research.


Conflict of interest statement

The authors declare no competing interests.

Figures

Fig. 1
Fig. 1. Sulbactam enhanced cell viability and reduced LDH release under the double effect of Abeta and glutamate load in neuron-astrocyte co-cultures.
Cell viability (A) was determined by CCK8 assay (n = 5), and LDH release (B) was detected by lactate dehydrogenase assay (n = 6). *p < 0.05 vs. CTL, # p < 0.05 vs. Abeta + Glu, +p < 0.05 vs. Abeta, ~p < 0.05 vs. Glu.
Fig. 2
Fig. 2. Sulbactam reduced neuronal death induced by the double effect of Abeta and glutamate in neuron-astrocyte co-cultures.
The images are representative fluorescent photomicrographs with HO-PI double stains, in which the uppers are fluorescence, and the lower are bright field photomicrographs. The scale bar represents 50 μm. The bar graph in the lower-right corner shows the neuronal death rate under the HO–PI double stains in each group. n = 5. *p < 0.05 vs. CTL, # p < 0.05 vs. Abeta + Glu, ~p < 0.05 vs. Glu.
Fig. 3
Fig. 3. Sulbactam inhibited BAX, while increased BCL2 expressions induced by the double effect of Abeta and glutamate in neuron-astrocyte co-cultures.
The uppers are representative immunofluorescent photomicrographs in each group (A). The scale bar represents 50 μm. The bar graph in the lower-right corner shows changes in BAX/BCL2 ratios in mean immunofluorescence intensity in each group, n = 5. The bottom is western blotting analysis (B), in which the left is representative immunoblot bands in each group, and the right bar graph is the quantitative representation of immunoblot bands by the ratios of the integrated density of BAX to BCL2, n = 6. *p < 0.05 vs. CTL, #p < 0.05 vs. Abeta + Glu, +p < 0.05 vs. Abeta, and ~p < 0.05 vs. Glu.
Fig. 4
Fig. 4. Sulbactam inhibited CCP3 expression induced by the double effect of Abeta and glutamate in neuron-astrocyte co-cultures.
The uppers are representative of the immunofluorescent photomicrograph in each group (A). The scale bar represents 50 μm. The bar graph in the lower-right corner shows changes in mean immunofluorescence intensity in each group, n = 5. The bottom is western blotting analysis (B), in which the left is representative immunoblot bands in each group, and the right bar graph is the quantitative representation of the immunoblot bands by the ratios of the integrated density of CCP3 to GADPH, n = 6. *p < 0.05 vs. CTL, #p < 0.05 vs. Abeta+Glu, +p < 0.05 vs. Abeta, ~p < 0.05 vs. Glu.
Fig. 5
Fig. 5. Western blotting analysis shows that sulbactam inhibited GLT1 downregulation induced by the double effect of Abeta and glutamate in primary neuron-astrocyte co-cultures.
The upper is representative of immunoblot bands, and the lower bar graph is a quantitative representation of the immunoblot bands by the ratios of the integrated density of GLT1 to GADPH. n = 5. *p < 0.05 vs. CTL, #p < 0.05 vs. Abeta + Glu, +p < 0.05 vs. Abeta, ~p < 0.05 vs. Glu.
Fig. 6
Fig. 6. Double immunofluorescence staining of GLT1 and GFAP shows that sulbactam inhibited GLT1 downregulation in astrocytes in primary neuron-astrocyte co-cultures.
The photomicrographs in the first line show individual expression of GLT1, GFAP (an astrocyte marker), and DAPI in the control group. Others are merged photomicrographs of GLT1, GFAP, and DAPI. The scale bar represents 50 μm. The bar graph in the lower-right corner shows Pearson’s R-value (values range from 1 to −1, 1 for a perfect correlation, 0 for no correlation, and −1 for a perfect anti-correlation) of merged photomicrographs in each group. The co-localization of GLT1 and GFAP was decreased after the incubation of Abeta and glutamate, and sulbactam treatment significantly ameliorated the decrease in co-localization. n = 5. *p < 0.05 vs. CTL, # p < 0.05 vs. Abeta + Glu, +p < 0.05 vs. Abeta, ~p < 0.05 vs. Glu.
Fig. 7
Fig. 7. Double immunofluorescence staining of GLT1 and MAP2 shows that sulbactam inhibited GLT1 downregulation in neurons in primary neuron-astrocyte co-cultures.
The photomicrographs in the first line show individual expression of GLT1, MAP2 (a marker of the neuron), and DAPI in the control group. Others are merged photomicrographs of GLT1, MAP2, and DAPI. The scale bar represents 50 μm. The bar graph in the lower-right corner shows Pearson’s R value (values range from 1 to −1, 1 for a perfect correlation, 0 for no correlation, and −1 for a perfect anti-correlation) of merged photomicrographs in each group. The co-localization of GLT1 and MAP2 was decreased after the incubation of Abeta and glutamate, and sulbactam pre-incubation significantly ameliorated the decrease in co-localization. n = 6. *p < 0.05 vs. CTL, #p < 0.05 vs. Abeta + Glu, +p < 0.05 vs. Abeta, ~p < 0.05 vs. Glu.

Similar articles

Cited by

References

    1. Zhou Y, Danbolt NC. Glutamate as a neurotransmitter in the healthy brain. J Neural Transm (Vienna) 2014;121:799–817. doi: 10.1007/s00702-014-1180-8. - DOI - PMC - PubMed
    1. Holmseth S, Scott HA, Real K, Lehre KP, Leergaard TB, Bjaalie JG, et al. The concentrations and distributions of three C-terminal variants of the GLT1 (EAAT2; slc1a2) glutamate transporter protein in rat brain tissue suggest differential regulation. Neuroscience. 2009;162:1055–71. doi: 10.1016/j.neuroscience.2009.03.048. - DOI - PubMed
    1. Danbolt NC. Glutamate uptake. Prog Neurobiol. 2001;65:1–105. doi: 10.1016/S0301-0082(00)00067-8. - DOI - PubMed
    1. Masliah E, Alford M, DeTeresa R, Mallory M, Hansen L. Deficient glutamate transport is associated with neurodegeneration in Alzheimer’s disease. Ann Neurol. 1996;40:759–66. doi: 10.1002/ana.410400512. - DOI - PubMed
    1. Lauderback CM, Hackett JM, Huang FF, Keller JN, Szweda LI, Markesbery WR, et al. The glial glutamate transporter, GLT-1, is oxidatively modified by 4-hydroxy-2-nonenal in the Alzheimer’s disease brain: the role of Abeta 1-42. J Neurochem. 2001;78:413–6. doi: 10.1046/j.1471-4159.2001.00451.x. - DOI - PubMed