. 2024 Feb 6;15(1):899.
doi: 10.1038/s41467-024-45056-x.

Smith-specific regulatory T cells halt the progression of lupus nephritis

Affiliations

Smith-specific regulatory T cells halt the progression of lupus nephritis

Peter J Eggenhuizen et al. Nat Commun. .

Abstract

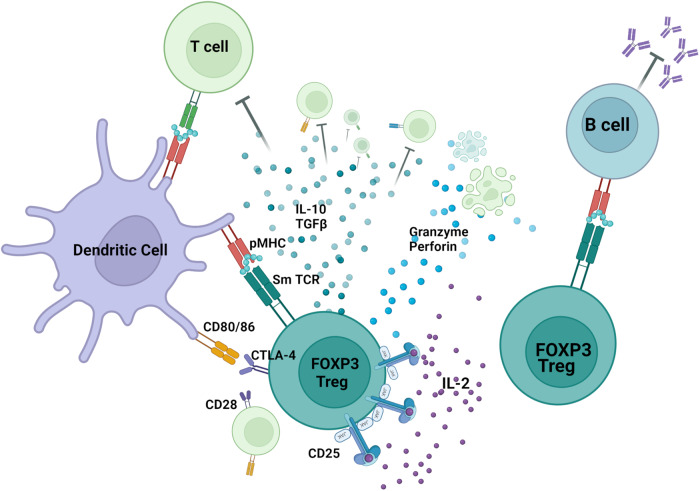
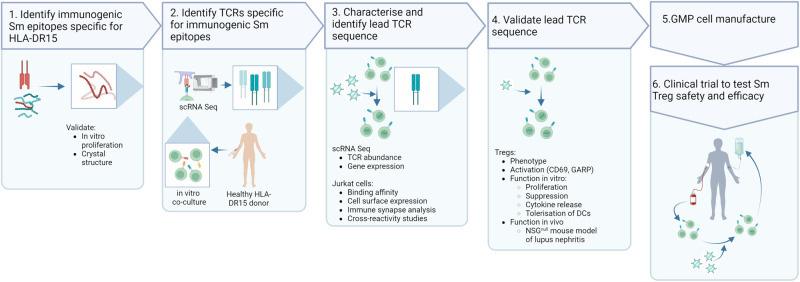
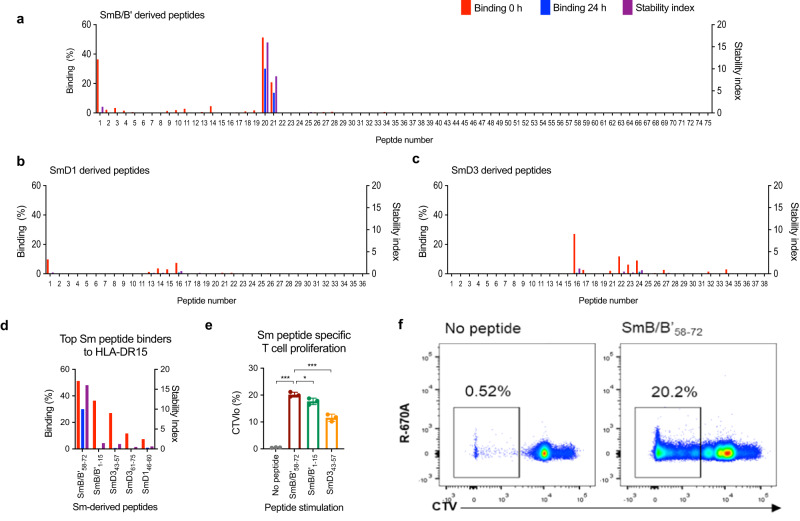
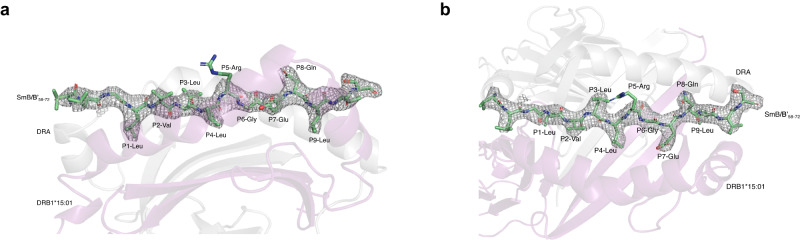
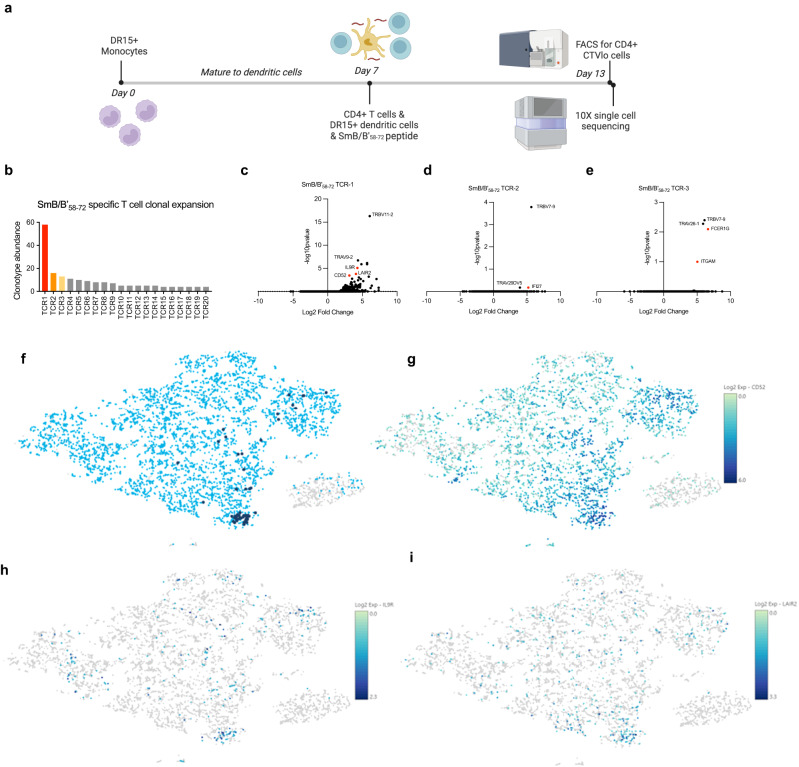
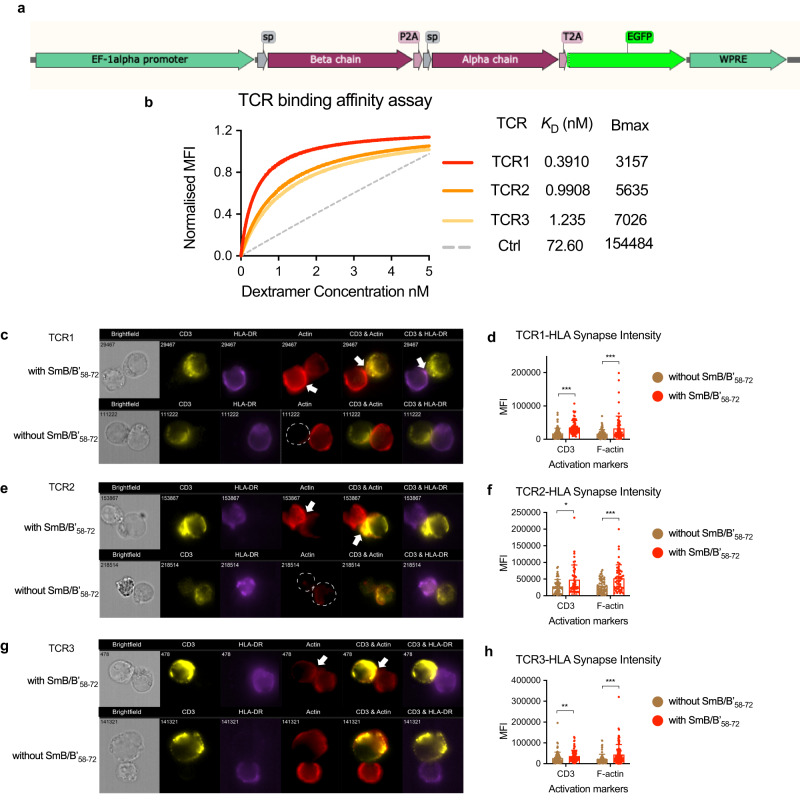
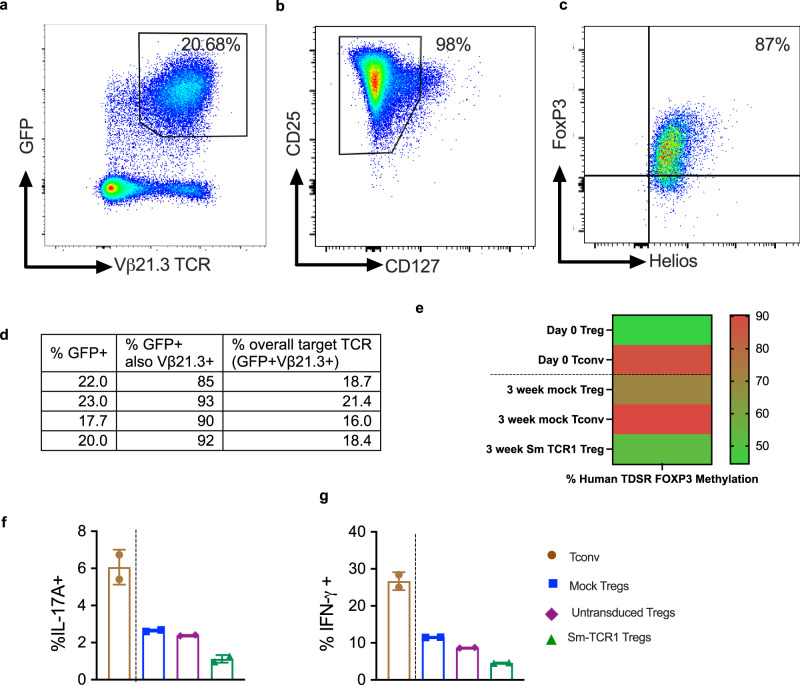
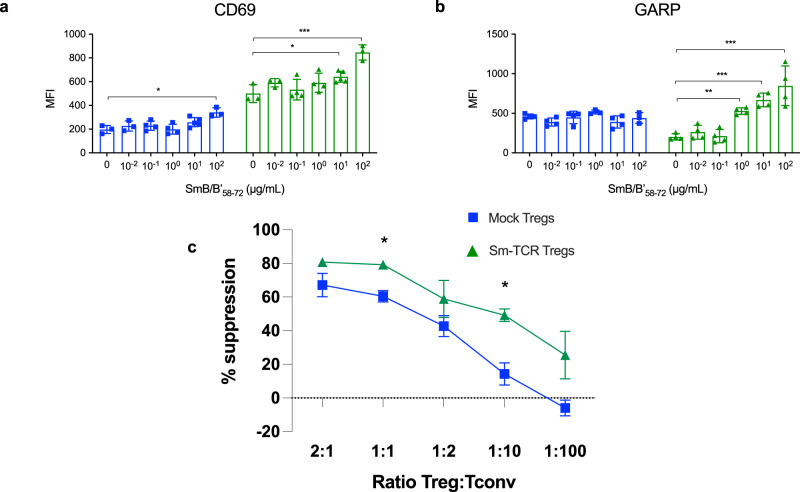
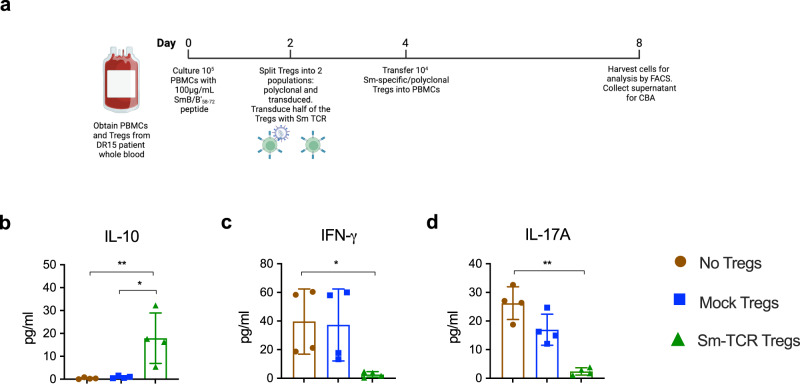
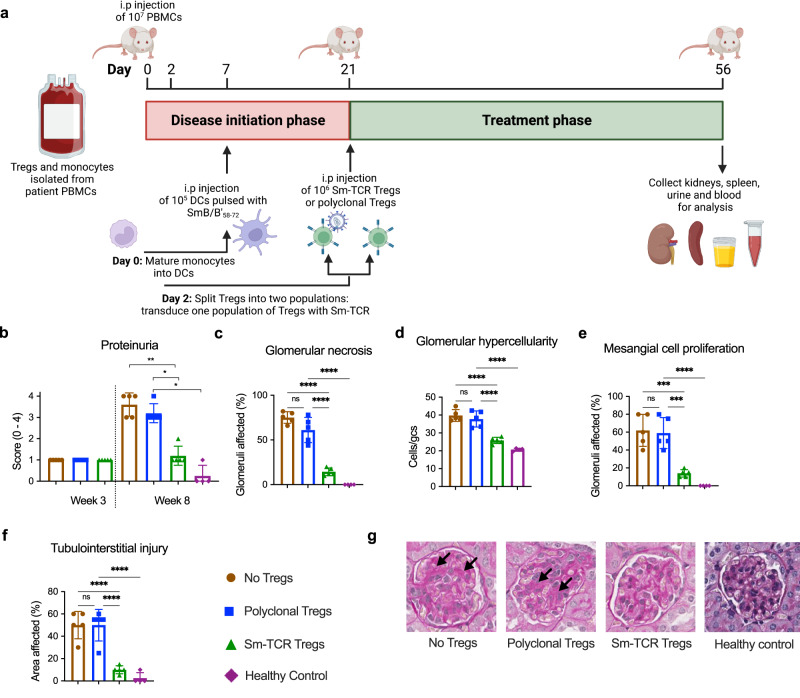
Antigen-specific regulatory T cells (Tregs) suppress pathogenic autoreactivity and are potential therapeutic candidates for autoimmune diseases such as systemic lupus erythematosus (SLE). Lupus nephritis is associated with autoreactivity to the Smith (Sm) autoantigen and the human leucocyte antigen (HLA)-DR15 haplotype; hence, we investigated the potential of Sm-specific Tregs (Sm-Tregs) to suppress disease. Here we identify a HLA-DR15 restricted immunodominant Sm T cell epitope using biophysical affinity binding assays, then identify high-affinity Sm-specific T cell receptors (TCRs) using high-throughput single-cell sequencing. Using lentiviral vectors, we transduce our lead Sm-specific TCR into Tregs derived from patients with SLE who are anti-Sm and HLA-DR15 positive. Compared with polyclonal mock-transduced Tregs, Sm-Tregs potently suppress Sm-specific pro-inflammatory responses in vitro and suppress disease progression in a humanized mouse model of lupus nephritis. These results show that Sm-Tregs are a promising therapy for SLE.


Conflict of interest statement

The authors declare the following competing interests: Relevant funding was awarded by Lupus Research Alliance Inc., Funder ID 100012051, 588087, and 850279 (J.D.O.), National Health and Medical Research Council (NHMRC), Funder ID 501100000925, 2017877 (J.D.O.), Amgen Inc., Funder ID 100002429, 2021026213-001 (J.D.O.), United States Department of Defense, Funder id 100000005, LR210065 (J.D.O.). The research has been partially supported by Amgen. PCT patent application (PCT/AU2021/050254) has been filed by Monash University as the sole applicant. Inventors: J.D.O., P.J.E., and E.F.M. The remaining authors declare no competing interests.

Figures

Fig. 1
Fig. 1. Sm-TCR Treg mechanisms of action.
Sm-TCR Tregs act through a variety of mechanisms to suppress autoreactivity and restore immune tolerance. Tregs can suppress autoreactive B cells and autoantibody production, suppress pathogenic T cells, tolerize antigen-presenting cells such as dendritic cells, and can directly lyse inflammatory cells. TCR transduction of a Sm-specific TCR renders the Treg more potent in its ability to specifically suppress lupus nephritis. Created with BioRender.com.
Fig. 2
Fig. 2. Pipeline for the development of antigen-specific Tregs for autoimmune disease.
To develop an antigen-specific Treg targeting an autoimmune disease a 6-step process is undertaken. In the case of lupus nephritis, Sm-Tregs are developed as follows. (1) The immunogenic autoimmune epitope, the Smith antigen (Sm), in the context of human leukocyte antigen (HLA)-DR15 is identified. (2) T-cell receptors (TCRs) are identified specific for Sm. (3) Candidate TCRs are screened for high expression, specificity and reactivity and a lead Sm TCR is chosen. (4) Lead Sm TCR is validated for its functional responses on Tregs in vitro and in vivo. (5) The pre-clinical data package is sent for regulatory approval and good manufacturing practice (GMP) cell manufacture commences. (6) Sm-Tregs are tested in human clinical trials for safety and efficacy. Created with BioRender.com.
Fig. 3
Fig. 3. Identification of SmB/B’58-72 as the dominant T-cell epitope in lupus nephritis.
Physical binding affinity assay of HLA-DR15 and 145 synthesized 15-mer peptides derived from a SmB/B’, b SmD1, and c SmD3. X axis shows peptide numbering of the 15-mers sequentially overlapping by an offset of three amino acids starting from the N-terminus of each protein. Y axes showing % binding and stability index, as described in “Methods”. d The top five binding HLA-DR15-restricted Sm peptides from the physical binding assay. e Immunogenicity of SmB/B’58-72, SmB/B’1-15 and SmB/B’43-57 measured by the proportion of CD4+ CellTrace Violet (CTV)lo T cells following 6-day co-culture of dendritic cells and CTV-labeled CD4+ T cells with or without peptide (n = 3 independent samples, data are presented as mean with SD) f, representative FACS plots for immunogenicity of SmB/B’58-72-stimulated and un-stimulated CD4+ T cells by CTV dilution. Source data are provided as a Source Data file.
Fig. 4
Fig. 4. Crystal structure of SmB/B’58-72 bound to HLA-DR15.
a TCR top view of the DR15 bound SmB/B’58-72 with 2 Fo-Fc electron density map, contoured at 1σ. b The peptide is bound in an extended conformation across the DR15 peptide binding groove (side view) with P2-Val, P3-Leu, P5-Arg, and P8-Gln accessible to TCR.
Fig. 5
Fig. 5. Single-cell RNA sequencing reveals SmB/B’58-72-specific CD4+ T cells.
a Experimental timeline of single-cell sequencing experiment from co-culture of cells with the peptide of interest to sorting of cells for sequencing. Created with BioRender.com. b Clonotype numbers of the top 20 SmB/B’58-72-specific TCRs (TCR1 to TCR20) as identified using 10X V(D)J single T-cell sequencing. ce Volcano plot of genes expressed by CD4+ T cells of interest that express SmB/B’58-72-TCR1-3. P values are derived from a negative binomial exact test with adjustment using Benjamin Hochberg correction for multiple tests. f t-SNE plot of CD4+ T cells that express our TCR of interest, TCR1 (dark blue dots). The majority of the cells expressing this TCR are clustered close together, indicating they are clonally expanded sharing a similar gene expression profile. g t-SNE plot of CD52 expression, a marker of suppressor T cells. The majority of CD52hi cells are clustered towards the bottom of the plot where cells expressing our TCR1 of interest are. h t-SNE plot of IL9R expression clustered with TCR1 expression. i t-SNE plot of LAIR2 expression clustered with TCR1 expression. Source data are provided as a Source Data file.
Fig. 6
Fig. 6. Sm-TCR lentiviral transduction produces high-affinity, antigen-specific responses.
a lentiviral construct design showing from 5’ to 3’ the Sm-TCR beta chain, P2A ribosomal skipping sequence, Sm-TCR alpha chain, T2A ribosomal skipping sequence, and eGFP reporter under the control of a 5’ EF1-alpha promoter and 3’ WPRE. b Saturation binding curves of the top three SmB/B’58-72-specific TCRs (TCR1 to TCR3) showing the apparent affinity KD (nM) and the maximum specific binding in units of Dextramer PE mean fluorescence intensity (MFI) (Bmax). TCR1-3 show DR15/ SmB/B’58-72 dextramer binding and negative control (Ctrl, dotted gray) shows DR15/ CLIP103-117 dextramer that is not expected to bind. ch Image flow cytometry of the interaction of c TCR1, e TCR2, g TCR3 on J76 Jurkats incubated for 2 h with HLA-DR15 B-LCLs in the presence (above) and absence (below) of SmB/B’58-72. Arrows point to the mature immune synapse (IS). Quantification of the CD3 and F-actin MFI at the IS of (d), TCR1 (n = 66 IS cells with SmB/B’58-72, n = 86 without SmB/B’58-72) CD3 P = < 0.000001, F-actin P = 0.000409, f TCR2 (n = 47 IS cells with SmB/B’58-72, n = 57 without SmB/B’58-72) CD3 P = 0.014402, F-actin P = 0.000998, h TCR3 (n = 111 IS with SmB/B’58-72, n = 83 without SmB/B’58-72) CD3 P = 0.000720, F-actin P = 0.000004. J76 Jurkats and HLA-DR15 B-LCLs in the presence (red) or absence (brown) of SmB/B’58-72. Data are presented as mean with SD. *P < 0.05, **P < 0.01, ***P < 0.001 by Mann–Whitney test. Source data are provided as a Source Data file.
Fig. 7
Fig. 7. Sm-Tregs are phenotypically stable.
Healthy human Tregs were transduced with TCR1 and expanded 10 days in vitro. a Representative flow cytometry dot plot of the CD4+ Treg cells expressing GFP and TCR Vβ21.3, the antibody specific for the variable gene TRBV11-2 of TCR1 showing a mean co-expression of 20.68%. b Treg surface marker phenotype by representative dot plots of CD25 and CD127 expression on CD4+ cells. c Sm-Treg transcription factor phenotype by representative dot plots of forkhead box P3 (FOXP3) and Helios expression. d Treg expression of GFP and Vβ21.3 by flow cytometry from four separate experiments on healthy donor Tregs. e methylation of the Treg-cell specific demethylated region (TDSR) of the FOXP3 locus of Treg and Tconv cells at day 0 (before transduction and expansion) and 3 weeks after transduction and expansion. f, g IL-17A and IFN-γ expression after stimulation with PMA and ionomycin of Tconv (brown), mock-transduced Tregs (blue), the un-transduced (GFP-) portion of Tregs that underwent lentiviral transduction (purple) and Sm-TCR1-transduced Tregs after 10 days of expansion culture in vitro, measured by intracellular flow cytometry (n = 2 biologically independent samples), data are presented as mean with SD. Source data are provided as a Source Data file.
Fig. 8
Fig. 8. Sm-Tregs are more highly activated and suppress SmB/B’58-72 autoreactivity better than polyclonal Tregs.
a Treg activation measured by CD69 mean fluorescence intensity (MFI) expression by flow cytometry of Tregs transduced with TCR1 (green) or mock-transduced (blue) cultured with B-LCLs pulsed with different concentrations of SmB/B’58-72 in triplicate for 36 h. (n = 3 (0, 10−2, 102 condition), n = 4 (10−1 condition), n = 5 (101 condition) biologically independent samples). b Treg activation of the same assay measured by the Treg-specific activation marker, GARP, expression by flow cytometry. (n = 4 biologically independent samples except for n = 3 (100 and 102 mock Treg condition). Data are presented as mean with SD. *P < 0.05, **P < 0.01, ***P < 0.001. c Suppression assay, measured by proliferation, showing the suppressive capacity of Sm-Tregs on Sm-specific Tconv cells transduced with TCR1 in the presence of SmB/B’58-72-pulsed DR15+ B-LCLs and titrations of either TCR1-transduced Tregs (green) or polyclonal mock Tregs (blue). % Suppression is measured by the increase in CellTrace Violet (CTV) MFI from TCR1-transduced Tconvs from the baseline proliferation with no Tregs. (n = 2 biologically independent samples) *P < 0.05 by unpaired t test. P = 0.031 for 1:1 condition and P = 0.044 for 1:10 condition. Source data are provided as a Source Data file.
Fig. 9
Fig. 9. Sm-TCR Treg-dependent in vitro suppression of Sm+ lupus donor PBMC.
a Experimental timeline for co-cultures of PBMCs and Tregs (polyclonal or Sm-specific) obtained from SLE patients with anti-Sm positivity and HLA-DR15. b IL-10 concentration in co-culture supernatant measured using cytometric bead array (CBA), No Tregs vs. Sm-Tregs P = 0.0092, Mock Tregs vs. Sm-Tregs P = 0.0111. c IFN-γ concentration in co-culture supernatant measured by CBA, No Tregs vs. Sm-Tregs P = 0.0140 and d IL-17A concentration in co-culture supernatant as measured by CBA. No Tregs vs. Sm-Tregs P = 0.0001. Data are presented as mean with SD (n = 4 biologically independent samples). *P < 0.0332, **P < 0.0021, ***P < 0.0002, ****P < 0.0001 by ordinary one-way ANOVA and Tukey’s multiple comparisons test. Source data are provided as a Source Data file. Created with Biorender.com.
Fig. 10
Fig. 10. Sm-TCR Treg-dependent in vivo suppression of Sm+ lupus donor PBMC.
a Experimental timeline for in vivo NSG-MHCnull mouse model of disease. Patient PBMCs, mature DCs pulsed with SmB/B’58-72 peptide and Tregs (mock polyclonal or Sm-specific) were administered on day 0, day 7, and day 21, respectively. b Proteinuria scores measured by urine test strips from mice administered no Tregs (brown), polyclonal Tregs (pTregs, blue), Sm-Tregs (green) or healthy control cells (purple) at week 3 and week 8. c Assessments of histological renal injury show the percentage of glomeruli affected by necrosis, d glomerular hypercellularity, e mesangial cell proliferation, and f tubulointerstitial injury from mice administered no Tregs (brown), polyclonal Tregs (pTregs, blue), Sm-Tregs (green), or healthy control cells (purple) at week 8. bf Data are presented as mean with SD. n = 5 independent experiments for mice receiving SLE patient cells and n = 4 for mice receiving healthy donor cells. *P < 0.0332, **P < 0.0021, ***P < 0.0002, ****P < 0.0001 by ordinary one-way ANOVA and Tukey’s multiple comparisons test. g Representative glomeruli from periodic acid Schiff (PAS)-stained kidney sections from mice administered no Tregs, polyclonal Tregs, Sm-Tregs or healthy control cells at week 8. Black arrows indicate areas of glomerular segmental necrosis. Source data are provided as a Source Data file. Created with Biorender.com.

References

    1. Dominguez-Villar M, Hafler DA. Regulatory T cells in autoimmune disease. Nat. Immunol. 2018;19:665–673. doi: 10.1038/s41590-018-0120-4. - DOI - PMC - PubMed
    1. Valencia X, Yarboro C, Illei G, Lipsky PE. Deficient CD4+CD25high T regulatory cell function in patients with active systemic lupus erythematosus. J. Immunol. 2007;178:2579–2588. doi: 10.4049/jimmunol.178.4.2579. - DOI - PubMed
    1. Bonelli M, et al. Quantitative and qualitative deficiencies of regulatory T cells in patients with systemic lupus erythematosus (SLE) Int. Immunol. 2008;20:861–868. doi: 10.1093/intimm/dxn044. - DOI - PubMed
    1. Bluestone JA, et al. Type 1 diabetes immunotherapy using polyclonal regulatory T cells. Sci. Transl. Med. 2015;7:315ra189. doi: 10.1126/scitranslmed.aad4134. - DOI - PMC - PubMed
    1. Ferreira LMR, Muller YD, Bluestone JA, Tang Q. Next-generation regulatory T cell therapy. Nat. Rev. Drug Discov. 2019;18:749–769. doi: 10.1038/s41573-019-0041-4. - DOI - PMC - PubMed