Clinical Trial
. 2024 Feb 6;15(1):974.
doi: 10.1038/s41467-024-44905-z.

A phase 1/2 clinical trial of invariant natural killer T cell therapy in moderate-severe acute respiratory distress syndrome

Affiliations
Clinical Trial

A phase 1/2 clinical trial of invariant natural killer T cell therapy in moderate-severe acute respiratory distress syndrome

Terese C Hammond et al. Nat Commun. .

Abstract

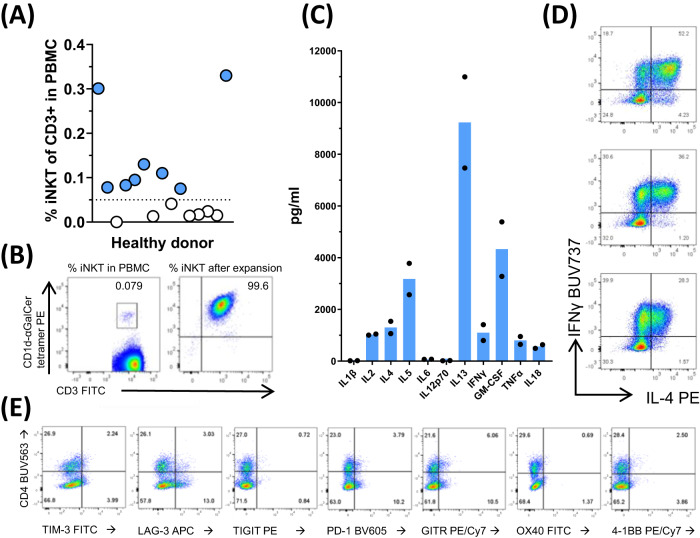
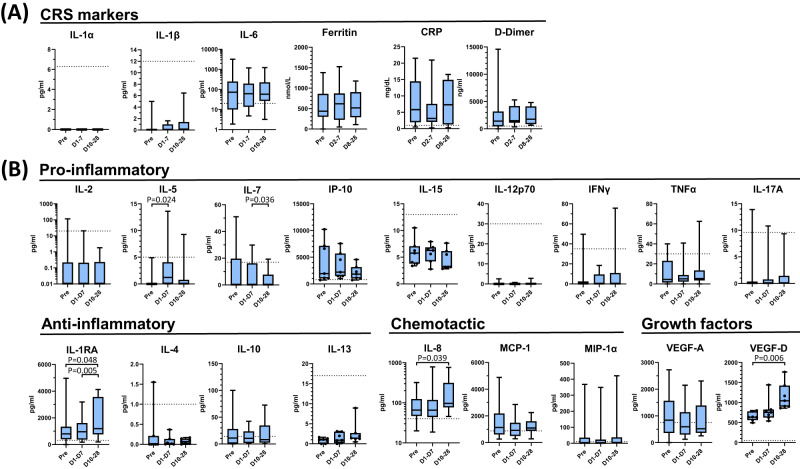
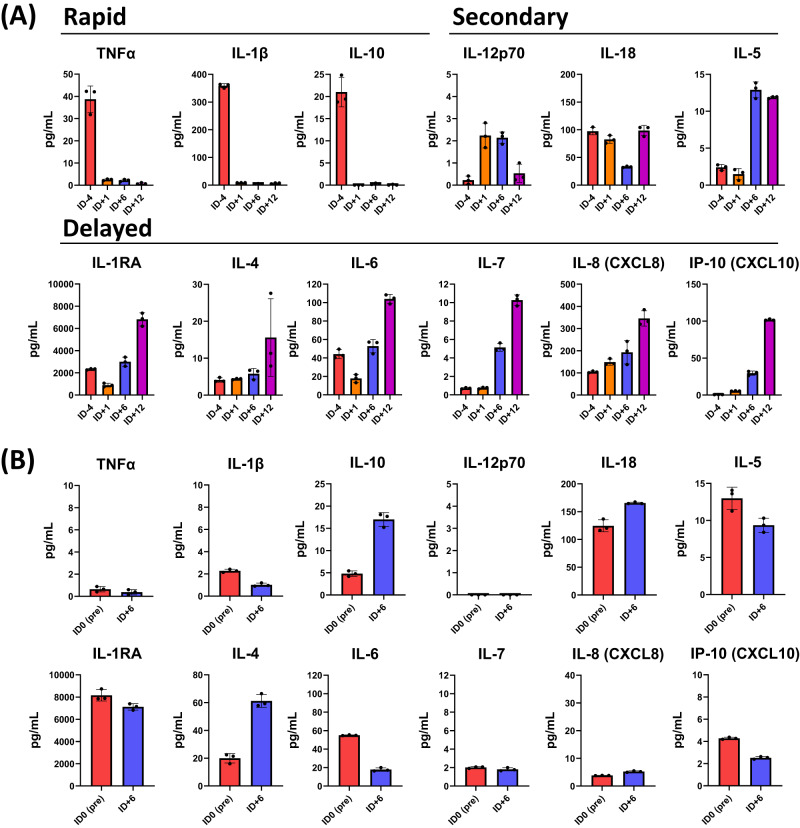
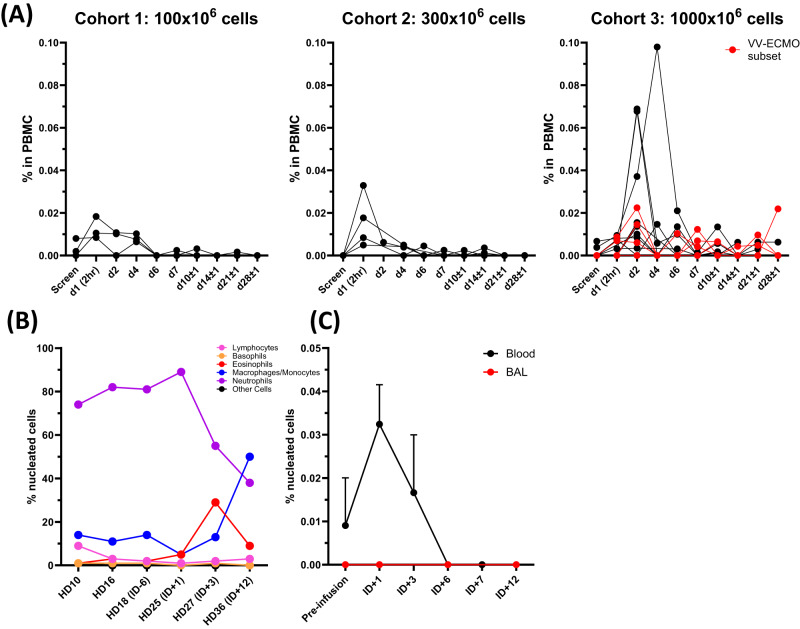
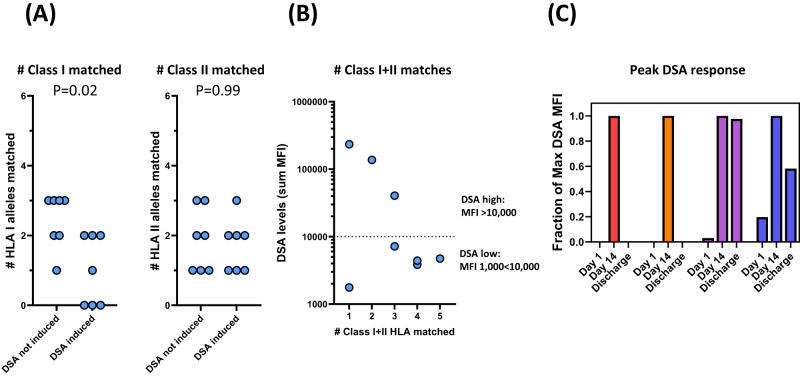
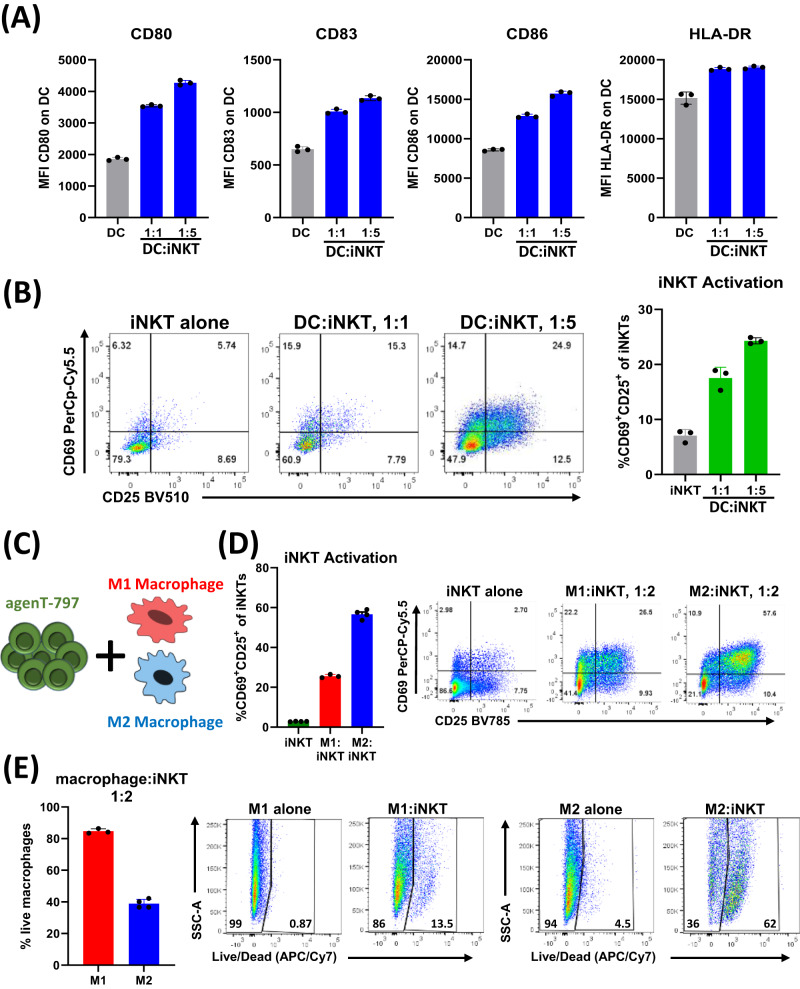
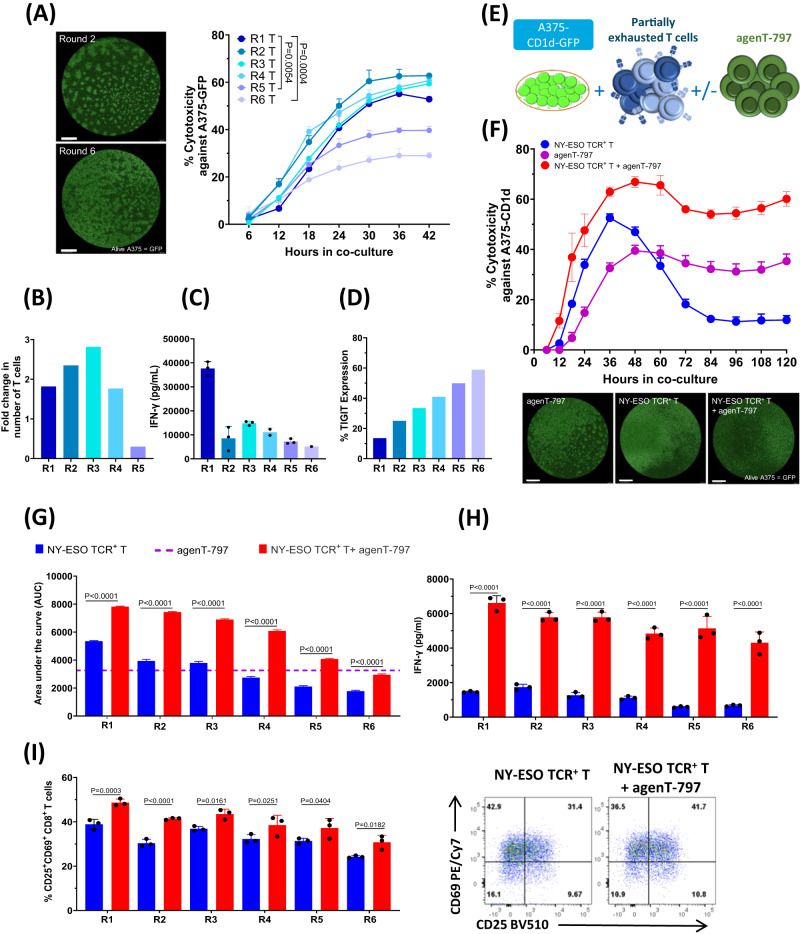
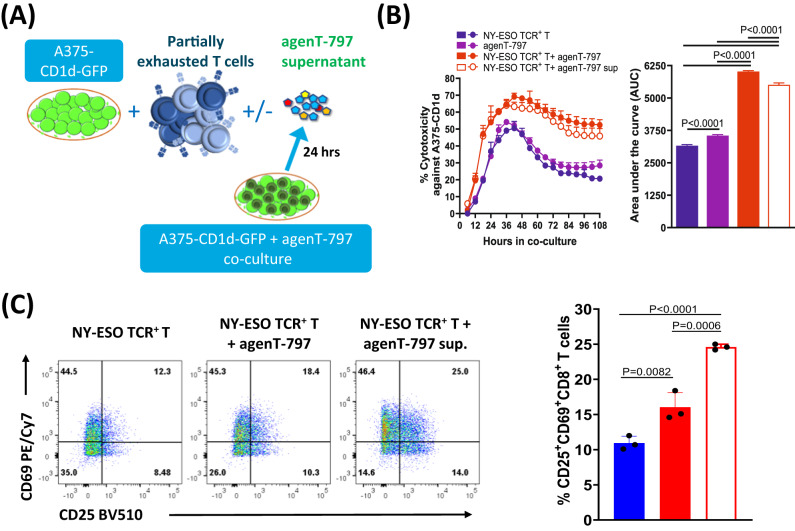
Invariant natural killer T (iNKT) cells, a unique T cell population, lend themselves for use as adoptive therapy due to diverse roles in orchestrating immune responses. Originally developed for use in cancer, agenT-797 is a donor-unrestricted allogeneic ex vivo expanded iNKT cell therapy. We conducted an open-label study in virally induced acute respiratory distress syndrome (ARDS) caused by the severe acute respiratory syndrome-2 virus (trial registration NCT04582201). Here we show that agenT-797 rescues exhausted T cells and rapidly activates both innate and adaptive immunity. In 21 ventilated patients including 5 individuals receiving veno-venous extracorporeal membrane oxygenation (VV-ECMO), there are no dose-limiting toxicities. We observe an anti-inflammatory systemic cytokine response and infused iNKT cells are persistent during follow-up, inducing only transient donor-specific antibodies. Clinical signals of associated survival and prevention of secondary infections are evident. Cellular therapy using off-the-shelf iNKT cells is safe, can be rapidly scaled and is associated with an anti-inflammatory response. The safety and therapeutic potential of iNKT cells across diseases including infections and cancer, warrants randomized-controlled trials.


Conflict of interest statement

M.A.P., S.K., D.M., B.Y., S.B., X.M., R.M., A.B., J.S.B., and M.v.D. are current or former employees of MiNK Therapeutics and have received stock and compensation. M.K., A.B., D.C., V.N., W.O., K.S., X.S., J.C., Y.Q. are current employees of Agenus Inc and have received stock and compensation. J.S. from 2020 has been the Editor-in-Chief of Oncogene has sat on SABs for Vaccitech, Heat Biologics, Eli Lilly, Alveo Technologies, Pear Bio, Agenus (and received compensation), Equilibre Biopharmaceuticals, Graviton Bioscience Corporation, Celltrion, Volvox, Certis, Greenmantle, vTv Therapeutics, APIM Therapeutics, Onconox, IO Labs, Bryologyx, Zephyr AI and Benevolent AI. He has consulted with Lansdowne partners and Vitruvian. He chairs the Board of Directors for Xerion and previously BB Biotech Healthcare Trust PLC. M.A.E. is former employee and current consultant for MiNK, employed by Imvax Inc., I.M. has received consulting fees from Agenus and TCH is on MiNK Therapeutics SAB and a consultant, has received Agenus research funding and consulting fees, and is on the Pfizer International Viral Advisory Council. J.R. received research funding from Equillium, Kite Pharma, Novartis and Oncternal and served on SABs for Akron Biotech, Avrobio, Clade Therapeutics, Erbi Biosystems, Garuda Therapeutics, LifeVault Bio, Novartis, Smart Immune, Talaris Therapeutics and TScan Therapeutics. A.G.A. is on the SAB for Legend Biotech, and a speaker for Bristol Myers Squibb. S.N. sits on the SABs for Kite/Gilead, Iovance, GlaxoSmithKline, Sobi, A2 Bio. K.v.B. has received stock and other ownership from Hemogeny, has a consultant role to HemOgenyx, Glycostem, Gamida Cell, CTI, Intellia, SNIPR BIOME, MorphoSys, Incyte, Autolus, ADC Therapeutics, has received research funding from Precision Biosciences, Orca Bio, Bristol-Myers Squibb/Celgene, Calibr and Actinium Pharmaceuticals. No other author declares a conflict.

Figures

Fig. 1
Fig. 1. Manufacture and characterization of agenT-797.
agenT-797 is manufactured by isolation of iNKT cells from peripheral blood mononuclear cells of healthy donors, iNKT-specific stimulation and expansion in vitro. A Levels of circulating iNKT cells were measured in PBMCs of 15 healthy donors and manufacturing cut-off was set at 0.05% of CD3+ lymphocytes (filled, above cut-off, open, below cut-off). B From selected donors, iNKT cells were purified and cells expanded using MiNK Therapeutics’ manufacturing protocol. At the end of manufacturing, purity of culture measured >99%. C Cytokines that were produced during expansion of iNKT cells were measured from supernatant cultures at the end of manufacturing. Both Th1 (IFN-γ, GM-CSF, TNF-α) and Th2 (IL-4, IL-5, IL-13) cytokines were produced. Data from two separate manufacturing runs using starting material from different donors (bars represent mean). agenT-797 iNKT cell products were subjected to flow cytometric analysis of intracellular cytokines (D) and surface markers (E) as shown. The CD4+ and negative iNKT populations expressed distinct levels of each marker. Data representative of agenT-797 batches manufactured to date (>10).
Fig. 2
Fig. 2. Post-infusion changes in serum biomarkers.
Serum cytokine levels broken into (A) CRS markers and (B) functional classes from pre- and post-infusion timepoints indicated. Pre-infusion serum sample was taken on day of infusion with agenT-797 (ID0 Pre). Cytokines were measured by Luminex using a custom multiplex assay (ThermoFisher). A Serum levels of key indicators of CRS; IL-1α, IL-1β, IL-6, ferritin, C-reactive protein (CRP) and D-dimer levels. Biomarker concentration determined over 28 days. B Serum cytokine levels of selected biomarkers spanning the immuno-regulatory spectrum. Cytokine data is binned as described below. Dotted lines indicate upper limit normal level of respective biomarker in healthy people. Cytokine data are grouped into pre-infusion sample (pre, single timepoint on day 1), early post-infusion window (average from 2 h post infusion on day 1 to day 7 post-infusion; D1-7) corresponding to the measured persistence of agenT-797 in the periphery, and a late post-infusion time window (days 10–28; D10-28). Data for ferritin, CRP, D-dimer shown for pre-infusion timepoint on day of treatment (pre, singe timepoint), early post infusion window (days 2–8; D2-8) and late post-infusion time window (days 8–28; D8-28). IL-1α/β not detected or within normal range. Cytokine data from all patients (n = 20), except for IL-4, IL-13, IL-15, IP-10 and VEGF-D where data are available only for cohorts 1 and 2 (n = 7). Data for ferritin, CRP, D-dimer measurements from 11 patients (Cohort 1: n = 3; Cohort 2: n = 2; Cohort 3: n = 6). All sample measurements returned as under the limit of detection scored as zero. All significant changes (adjusted p value < 0.05) post dosing are indicated (column means comparison using ANOVA/mixed effect model followed by Tukey’s multiple comparisons test). Box plot whiskers extends to the minimum and maximum values, with the box encompassing the interquartile range (IQR), and the center line indicating the median.
Fig. 3
Fig. 3. Post-infusion cytokine level changes in BAL and serum.
Cytokine levels measured in EUA patient broken into onset classes (Rapid: onset and durable change within first day post-infusion; Secondary: onset and peak response within first week of infusion; Delayed: onset and peak following first week of infusion) in (A) BAL versus (B) sera at pre- and post-infusion timepoints indicated. For sera, the pre-infusion serum sample was taken on day of infusion with agenT-797 (ID0 Pre). Cytokines were measured by Luminex using a custom multiplex assay (ThermoFisher). Bar colors: Pre-infusion (red); Day post infusion (orange); Day 6 post-infusion (blue): Day 12 post-infusion (purple). Only pre- and a single post-infusion point (ID + 6) were available for sera. Measurements in triplicate, bar represents mean with SD.
Fig. 4
Fig. 4. Detection of agenT-797 at multiple timepoints during patient hospitalization.
Cellular composition of nucleated material in blood and BAL. Whole blood frozen at −80 °C and sent to MiNK for evaluation. BAL samples collected at bedside and immediately separated into two aliquots, then one aliquot was immediately frozen at −80 °C and sent to MiNK for evaluation. The remainder of the sample was sent to the clinical lab for processing. Cell counts and differentials were determined and closely correlated. A Persistence of agenT-797 in blood. Cohort-level peripheral persistence of agenT-797 Quantification of agenT-797 in patient PBMC by digital PCR based on genetic markers unique to donor material. Each line represents data from one patient. The red line indicates patients treated with agenT-797 and on  VV-ECMO. B EUA patient. Standard cytology cell counts in BAL and differentials. C EUA patient. Detection of agenT-797 in peripheral blood (black circles) and BAL (red circles) pre-infusion and at various timepoints post infusion with agenT-797. Data for four separate agenT-797-specific markers measured at each timepoint in blood and BAL samples shown as mean with standard deviation (SD). Detection and quantification of agenT-797 was by detection of agenT-797-specific single nucleotide polymorphisms (SNPs) using a digital droplet (dd) PCR-based assay to detect genetic chimerism (Neogenomics, CA). Pre-infusion timepoint for BAL: ID -4, and for blood: ID 0.
Fig. 5
Fig. 5. Post-infusion induction of donor specific allo-antibodies (DSA).
A Presence of donor specific allo-antibodies (DSA) was determined on day of dosing and day 14, showing induction of DSA. Patients were scored weather DSA were induced or not induced at day 14 post infusion. Small changes (<1000 MFI) in DSA measurements between D1 and D14 were scored as not induced. Incidence of DSA development is reduced with increased HLA class I matching but appears unrelated to the degree of HLA-class II matching. Mean column values compared using Mann–Whitney nonparametric test, with P values (two-tailed) indicated. B Serum levels of DSA post-dosing are reduced with increased degree of HLA matching. DSA levels of combined MFI < 1000 are considered negative and not reported. C For 4 patients (identified by different colors) DSA levels were measured at the time of discharge (day of discharge of patients, from left to right: 60, 28, 21, 28). DSA levels post infusion of agenT-797 peak at day 14 and appear to decrease afterwards (data normalized to peak DSA levels for each patient).
Fig. 6
Fig. 6. Cross talk between agenT-797 and the myeloid cell compartment.
A, B DCs were cocultured with agenT-797 cells at 1:1 and 1:5 DC to iNKT ratio for 48 h. DC and iNKT activation was measured by flow cytometry. Data shown is representative from one donor. A Expression of DC activation markers CD80, CD83, CD86 and HLA-DR on DCs cultured alone (gray bars) or with iNKT cells (blue bars; n = 3). B Evaluation of iNKT activation from DC co-cultures by co-expression of CD25 and CD69 (n = 3; iNKT alone: gray bars; coculture: green bars). CE M1 and M2 macrophages were cocultured with agenT-797 at 1:2 ratio for 48 hr as shown in schematic (C). Data shown is representative from one donor. D iNKT (agenT-797) activation following macrophage coculture as measured by surface expression of CD69 and CD25. agenT-797 alone (green; n = 4) or cocultured with M1 (red; n = 3) or M2 (blue; n = 4) macrophages. Representative flow chart shown on left. E Frequency of viable macrophage following coculture of iNKT cells with M1 (n = 3) or M2 (n = 4) macrophages as measured by live/dead staining. Representative flow chart shown on left. All bar charts represent mean with SD.
Fig. 7
Fig. 7. Reversal of partial T cell exhaustion by agenT-797.
A Cytotoxicity of NY-ESO TCR + T cells against A375-GFP cells was assessed using Incucyte Live Imaging (representative images after 48 h of co-culture; scalebar: 1 mm). Significant differences in killing curves between single-time antigen-exposed (Round 1; R1) and multiple-times antigen-exposed (R5, R6) T cells became apparent after 30 h of coculture. Adjusted P values shown for data from 30 h timepoint. Data analysed by 2-way ANOVA followed by Dunnett’s multiple comparison test. Datapoints represent mean with SD (n = 3 replicate wells). B T-cell proliferation (fold change) during each round of antigen exposure (n = 1 experiment). C IFN-γ measurement in supernatants after each round of antigen exposure of T cells. Bars represent mean with SD (n = 3). D Expression of TIGIT in CD8 + T cells evaluated as a marker of exhaustion in every round of exposure. Data shown is representative from one donor. EI NY-ESO TCR + T cells from different rounds of antigen exposure were co-cultured with A375-CD1d-GFP target cells in presence or absence agenT-797 cells at the ratio of 1:1:1 as shown in the schematic in (E). F Impact of agenT-797 on killing curve of Round 4 (R4) antigen-exposed T cells. Datapoints represent mean with SD (n = 3). Sample images from end of experiment (scalebar: 1 mm). G Impact of agenT-797 on cytotoxic capacity (area under the curve; AUC) of T cells with 1–6 rounds of prior antigen-exposure (R1-R6). Bars represent mean with SEM (n = 3). H Impact of agent-797 in IFN-γ release in supernatants from antigen-exposed T cells (R1-R6). Bars represent mean with SD (n = 3). I Impact of agenT-797 on activation of antigen-exposed CD8 T cells (R1-R6) as measured by CD25 and CD69 expression. Bars represent mean with SD (n = 3). Flow panels: Impact of agent-797 on expression of activation markers (CD69 + CD25 + ) on Round 4 (R4) antigen-exposed T cells. H, I For each set of antigen-exposed T cells (R1-R6), mean values of respective T cell response (cytotoxicity AUC, IFN-γ release, CD25/69 expression) in absence or presence of agenT-797 were compared by Šídák’s multiple comparison test. P values adjusted for multiple comparisons. Colors as in (G).
Fig. 8
Fig. 8. agenT-797 acts via soluble factors to rescue partially exhausted T cells.
Supernatant from agenT-797 co-culture with A375-CD1d-GFP cells was collected after 24 h and added to coculture assays for antigen-exposed NY-ESO TCR + T cells as shown in the schematic in (A). B Impact of agenT-797 supernatant (sup) on cytotoxicity of Round 2 antigen exposed T cells against target cells. Left panel: killing curves over 5 days. Datapoints represent mean with SD (n = 3). Right panel: Cytotoxicity as measured by area under the curve (AUC). Bars represent mean with SEM (n = 3). C Impact of agenT-797 supernatant an activation of Round 2 antigen-exposed T cells measured by CD25 + CD69+ expression after 24 h of co-culture. Bars in bar graph represent mean with SD (n = 3). Colors represent conditions as in (B). B, C Supernatant from activated agenT-797 significantly improved the cytotoxicity and activation of partially exhausted T cells. Column means compared using Šídák’s multiple comparisons test. P values adjusted for multiple comparisons.

References

    1. Godfrey DI, Kronenberg M. Going both ways: immune regulation via CD1d-dependent NKT cells. J. Clin. Investig. 2004;114:1379–1388. doi: 10.1172/JCI200423594. - DOI - PMC - PubMed
    1. Berzins SP, Smyth MJ, Baxter AG. Presumed guilty: natural killer T cell defects and human disease. Nat. Rev. Immunol. 2011;11:131–142. doi: 10.1038/nri2904. - DOI - PubMed
    1. Salio M, Silk JD, Jones EY, Cerundolo V. Biology of CD1- and MR1-restricted T cells. Annu. Rev. Immunol. 2014;32:323–366. doi: 10.1146/annurev-immunol-032713-120243. - DOI - PubMed
    1. Exley MA, Dellabona P, Casorati G. Exploiting CD1-restricted T cells for clinical benefit. Mol. Immunol. 2021;132:126–131. doi: 10.1016/j.molimm.2020.12.015. - DOI - PubMed
    1. Ingram, Z. et al. Targeting Natural Killer T Cells in Solid Malignancies. Cells. 10 10.3390/cells10061329 (2021). - PMC - PubMed

Publication types