. 2024 Feb 6;15(2):112.
doi: 10.1038/s41419-024-06496-x.

Transcription factor ATMIN facilitates chemoresistance in nasopharyngeal carcinoma

Affiliations

Transcription factor ATMIN facilitates chemoresistance in nasopharyngeal carcinoma

Xue-Liang Fang et al. Cell Death Dis. .

Abstract

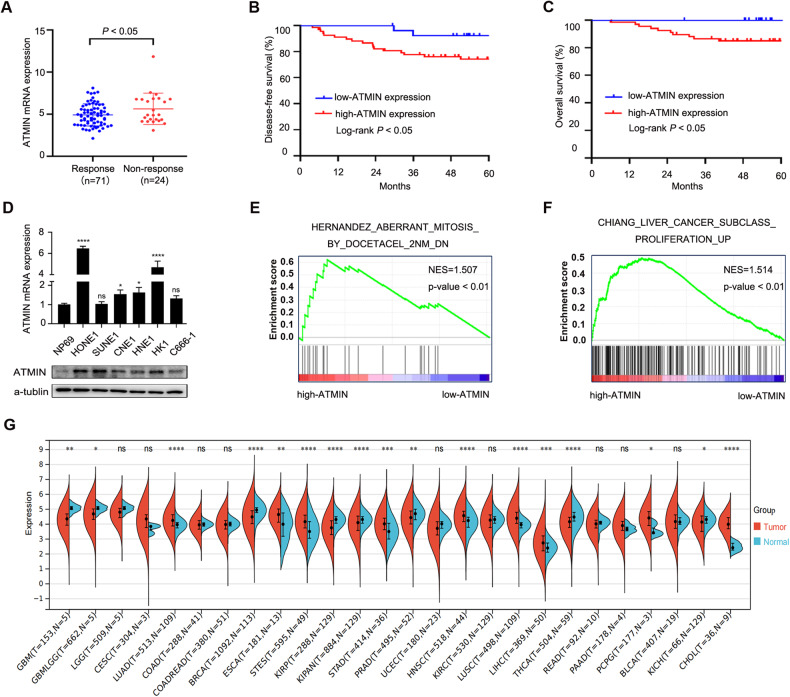
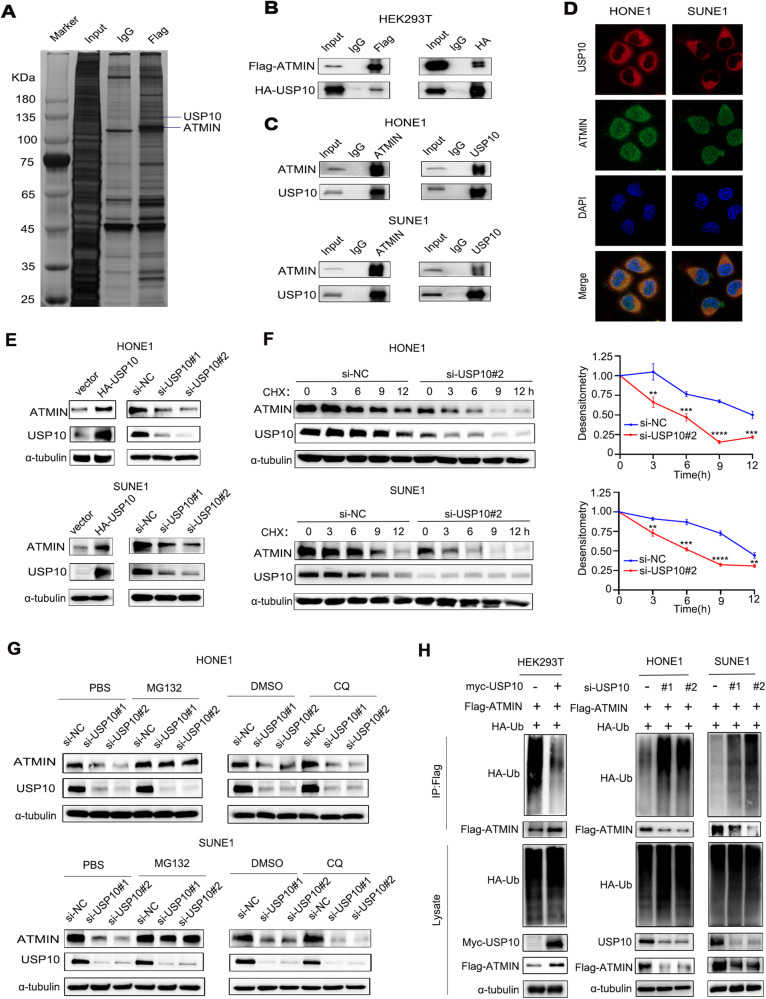
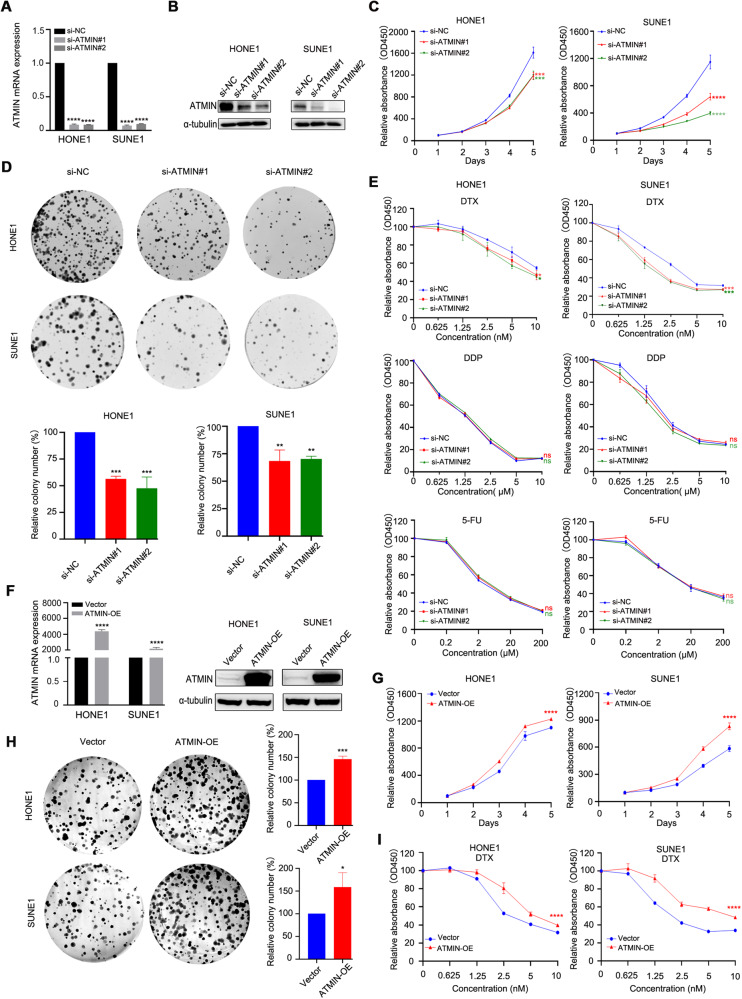
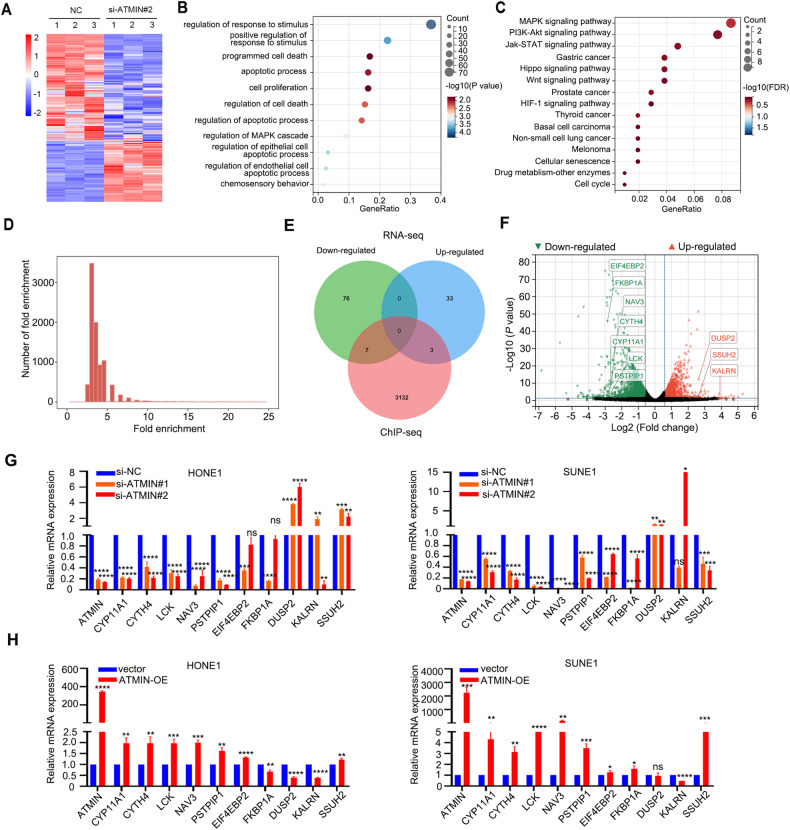
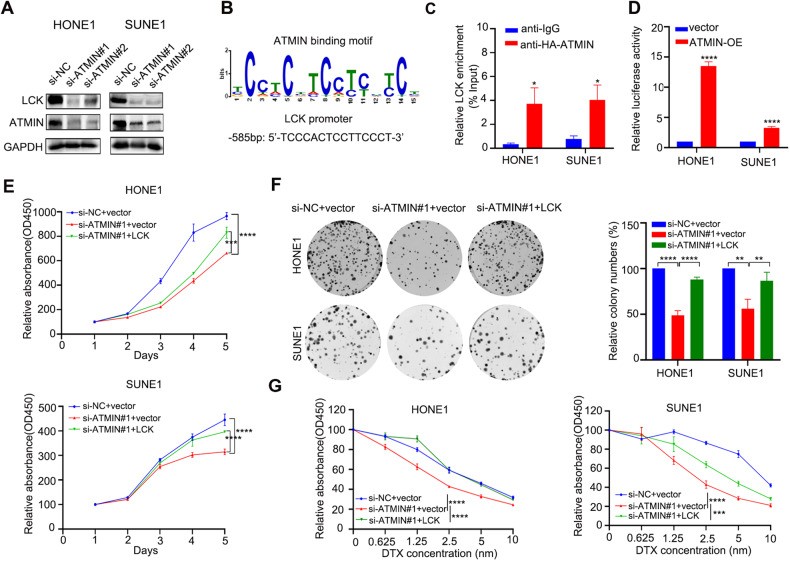
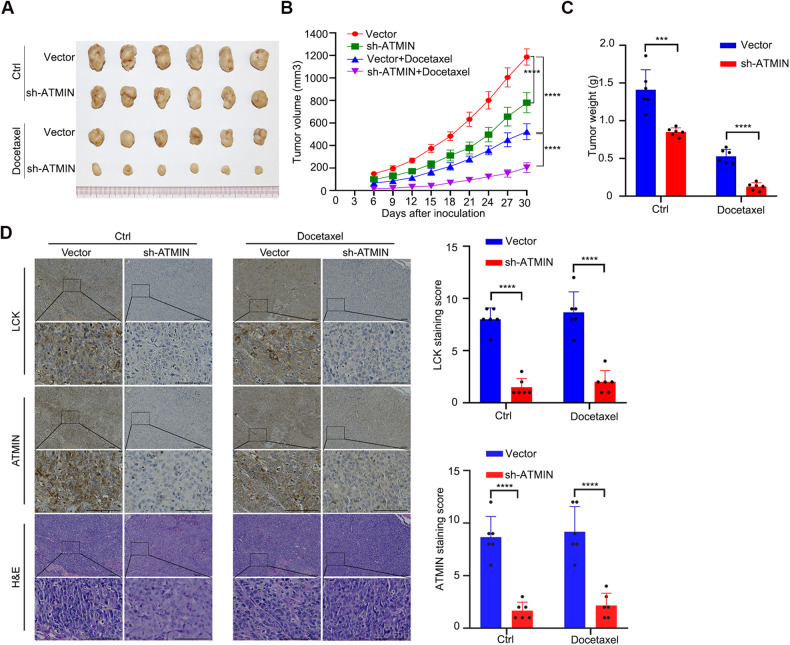
Despite that the docectaxel-cisplatin-5-fluorouracil (TPF) induction chemotherapy has greatly improved patients' survival and became the first-line treatment for advanced nasopharyngeal carcinoma (NPC), not all patients could benefit from this therapy. The mechanism underlying the TPF chemoresistance remains unclear. Here, by analyzing gene-expression microarray data and survival of patients who received TPF chemotherapy, we identify transcription factor ATMIN as a chemoresistance gene in response to TPF chemotherapy in NPC. Mass spectrometry and Co-IP assays reveal that USP10 deubiquitinates and stabilizes ATMIN protein, resulting the high-ATMIN expression in NPC. Knockdown of ATMIN suppresses the cell proliferation and facilitates the docetaxel-sensitivity of NPC cells both in vitro and in vivo, while overexpression of ATMIN exerts the opposite effect. Mechanistically, ChIP-seq combined with RNA-seq analysis suggests that ATMIN is associated with the cell death signaling and identifies ten candidate target genes of ATMIN. We further confirm that ATMIN transcriptionally activates the downstream target gene LCK and stabilizes it to facilitate cell proliferation and docetaxel resistance. Taken together, our findings broaden the insight into the molecular mechanism of chemoresistance in NPC, and the USP10-ATMIN-LCK axis provides potential therapeutic targets for the management of NPC.


Conflict of interest statement

The authors declare no competing interests.

Figures

Fig. 1
Fig. 1. ATMIN expression is upregulated in chemoresistant patients and predicts poor prognosis.
A ATMIN mRNA expression in NPC patients with response (n = 71) and non-response (n = 24) to TPF chemotherapy. Kaplan–Meier survival curves of disease-free survival (B) and overall survival (C) according to ATMIN mRNA expression in NPC patients receiving TPF chemotherapy. D ATMIN expression is up-regulated on mRNA (up) and protein level (down) in NPC cell lines. GSEA analysis based on RNA-seq results of 95 patients showing gene sets related to docetaxel response (E) and tumor proliferation (F). G Pan-cancer analysis of the mRNA expression of ATMIN in tumor and normal tissue samples with the TCGA dataset. Data in (A) are presented as mean ± SD, P values were calculated using Student’s t test (A), log-rank test (B, C), one-way ANOVA (D) or Wilcoxon rank sum test (G). *P < 0.05, **P < 0.01, ***P < 0.001, ****P < 0.0001. ns not significant. NPC nasopharyngeal carcinoma, GBM glioblastoma multiforme, GBMLGG glioma, LGG brain lower grade glioma, CESC cervical squamous cell carcinoma and endocervical adenocarcinoma, LUAD lung adenocarcinoma, COAD colon adenocarcinoma, COADREAD colon adenocarcinoma/rectum adenocarcinoma esophageal carcinoma, BRCA breast invasive carcinoma, ESCA esophageal carcinoma, STES stomach and esophageal carcinoma, KIRP kidney renal papillary cell carcinoma, KIPAN pan-kidney cohort (kidney chromophobe + kidney renal clear cell carcinoma + kidney renal papillary cell carcinoma), STAD stomach adenocarcinoma, PRAD prostate adenocarcinoma, UCEC uterine corpus endometrial carcinoma, HNSC head and neck squamous cell carcinoma, KIRC kidney renal clear cell carcinoma, LUSC lung squamous cell carcinoma, LIHC liver hepatocellular carcinoma, THCA thyroid carcinoma, READ rectum adenocarcinoma, PAAD pancreatic adenocarcinoma, PCPG pheochromocytoma and paraganglioma, BLCA bladder urothelial carcinoma, KICH kidney chromophobe, CHOL cholangiocarcinoma. The unprocessed images of the blots are shown in Supplementary Fig. S3.
Fig. 2
Fig. 2. USP10 deubiquitinates and stabilizes the ATMIN protein.
A Silver staining of FLAG-immunoprecipitated proteins separated from HONE1 cells overexpressing FLAG-ATMIN. Black lines indicated the proteins of interest. B Co-IP with anti-FLAG and anti-HA antibodies in HEK293T cells overexpressing FLAG-ATMIN and HA-USP10. C Co-IP with anti-ATMIN and anti-USP10 antibodies in HONE1 and SUNE1 cells. D Immunofluorescence staining revealed the cellular location of USP10 (red) and ATMIN (green) in HONE1 and SUNE1 cells. E Western blot analysis of ATMIN expression with USP10 overexpression or silencing in HONE1 and SUNE1 cells. F The effect of CHX treatment (left) and greyscale analysis of the results (right) in HONE1 and SUNE1 cells transfected with si-USP10#2 or si-NC. G The effect of MG132 (left) and CQ (right) treatment in HONE1 and SUNE1 cells transfected with indicated siRNA. H HEK293T cells (left) co-transfected with FLAG-ATMIN, HA-ubiquitin (Ub) and MYC-USP10 or the vector plasmids were subjected to Co-IP and immunoblotted with the indicated antibodies. HONE1 (middle) and SUNE1 (right) cells co-transfected with FLAG-ATMIN, HA-ubiquitin (Ub) and si-USP10#2 or si-NC were subjected to Co-IP and immunoblotted with the indicated antibodies. Data in (F) are presented as mean ± SD, P values were calculated using Student’s t test, **P < 0.01, ***P < 0.001, ****P < 0.0001. The unprocessed images of the blots are shown in Supplementary Fig. S3.
Fig. 3
Fig. 3. Knockdown of ATMIN inhibits cell proliferation and facilitates docetaxel-sensitivity of NPC cells in vitro.
A, B qRT-PCR and western blot analysis of ATMIN expression in HONE1 and SUNE1 cells transfected with si-ATMIN#1 or si-ATMIN#2 or si-NC. C CCK-8 assays determining the growth curves of the transfected cells. D Representative images and quantification of the colony formation assays in the transfected cells. E CCK-8 assays testing the sensitivity of the transfected cells to the indicated doses of DTX, DDP and 5-FU. F qRT-PCR and western blot analysis of ATMIN expression in HONE1 and SUNE1 cells transfected with FLAG-ATMIN. G CCK-8 assays determining the growth curves of the SUNE1 and HONE1 cells transfected with vector or FLAG-ATMIN. H Representative images and quantification of the colony formation assays in the SUNE1 and HONE1 cells transfected with vector or FLAG-ATMIN. I CCK-8 assays testing the sensitivity of the SUNE1 and HONE1 cells transfected with vector or FLAG-ATMIN to the indicated doses of DTX. Data are presented as mean ± SD, P values were calculated using one-way ANOVA (A, CE) or Student’s t test (FI). *P < 0.05, **P < 0.01, ***P < 0.001, ****P < 0.0001. ns not significant. DTX docetaxel, DDP cis-diamminedichloro-platinum, 5-FU 5-fluorouracil. The unprocessed images of the blots are shown in Supplementary Fig. S3.
Fig. 4
Fig. 4. RNA-seq combined with ChIP-seq analysis suggests that ATMIN regulates cell death signaling.
A RNA-seq and the heatmap analysis showed differentially expressed genes between HONE1 cells transfected with si-ATMIN#2 and si-NC. B, C GO and KEGG pathways enrichment analysis of RNA-seq results. D ChIP-seq analysis of peaks enriched by ATMIN in HONE1 cells with ATMIN overexpression (q value < 0.05). E Venn diagram showing 10 candidate genes between RNA-seq (|log2fold change| ≥ 2.5 and q value < 0.05) and ChIP-seq (q value < 0.05) peaks within 3000 bp of the transcription start sites. F Volcano plot showing the 10 candidate genes. G, H qRT-PCR showing the relative mRNA expression of 10 candidate genes with ATMIN silencing or overexpression in HONE1 and SUNE1 cells. Data are presented as mean ± SD, P values were calculated using one-way ANOVA (G) or Student’s t test (H). *P < 0.05, **P < 0.01, ***P < 0.001, ****P < 0.0001. ns not significant.
Fig. 5
Fig. 5. LCK functions as a downstream target gene of ATMIN in NPC cells.
A Western blot analysis of LCK expression after ATMIN silencing. B ATMIN-binding motif and predicted LCK promoter site binding for ATMIN. C ChIP-qPCR validation of ATMIN enrichment on the promoter of LCK. D Dual-luciferase reporter assays in HONE1 and SUNE1 cells co-transfected with ATMIN plasmid or empty vector and pGL3-Basic-LCK plasmid (n = 3). E CCK-8 assays determining the growth curves of HONE1 and SUNE1 cells co-transfected with si-NC plus vector or si-ATMIN#1 plus vector or si-ATMIN#1 plus LCK plasmid. F Representative images and quantification of the colony formation assays in HONE1 and SUNE1 cells co-transfected with si-NC plus vector or si-ATMIN#1 plus vector or si-ATMIN#1 plus LCK plasmid. G CCK-8 assays in HONE1 and SUNE1 cells co-transfected with si-NC plus vector or si-ATMIN#1 plus vector or si-ATMIN#1 plus LCK plasmid followed with docetaxel treatment in an increased dose manner. Data are presented as mean ± SD, P values were calculated using Student’s t test (C, D) or one-way ANOVA (EG). *P < 0.05, **P < 0.01, ***P < 0.001, ****P < 0.0001. The unprocessed images of the blots are shown in Supplementary Fig. S3.
Fig. 6
Fig. 6. Knockdown of ATMIN suppresses tumor growth and enhances docetaxel-sensitivity of NPC in vivo.
SUNE1 cells with or without ATMIN silencing were transplanted into the right axillary region of nude mice. Once the tumor nodes became palpable (~100 mm3), the mice were randomly divided into four groups (n = 6 per group) and intraperitoneally injected with saline or docetaxel every three days. A Representative images of the xenograft tumors. B Tumor volume growth curves of the xenograft tumors. C Weight of xenograft tumors in the saline group (left) and docetaxel group (right). D Representative images of H&E and IHC staining and staining scores of ATMIN and LCK in subcutaneous tumors from different groups. Data are presented as mean ± SD, P values were calculated using two-way ANOVA (B) or Student’s t test (C, D). ***P < 0.001, ****P < 0.0001.

References

    1. Chen YP, Chan ATC, Le QT, Blanchard P, Sun Y, Ma J. Nasopharyngeal carcinoma. Lancet. 2019;394:64–80. doi: 10.1016/S0140-6736(19)30956-0. - DOI - PubMed
    1. Pan JJ, Ng WT, Zong JF, Lee SW, Choi HC, Chan LL, et al. Prognostic nomogram for refining the prognostication of the proposed 8th edition of the AJCC/UICC staging system for nasopharyngeal cancer in the era of intensity-modulated radiotherapy. Cancer. 2016;122:3307–15. doi: 10.1002/cncr.30198. - DOI - PMC - PubMed
    1. Tang LL, Chen YP, Chen CB, Chen MY, Chen NY, Chen XZ, et al. The Chinese Society of Clinical Oncology (CSCO) clinical guidelines for the diagnosis and treatment of nasopharyngeal carcinoma. Cancer Commun. 2021;41:1195–227. doi: 10.1002/cac2.12218. - DOI - PMC - PubMed
    1. Sun Y, Li WF, Chen NY, Zhang N, Hu GQ, Xie FY, et al. Induction chemotherapy plus concurrent chemoradiotherapy versus concurrent chemoradiotherapy alone in locoregionally advanced nasopharyngeal carcinoma: a phase 3, multicentre, randomised controlled trial. Lancet Oncol. 2016;17:1509–20. doi: 10.1016/S1470-2045(16)30410-7. - DOI - PubMed
    1. Chen YP, Ismaila N, Chua MLK, Colevas AD, Haddad R, Huang SH, et al. Chemotherapy in combination with radiotherapy for definitive-intent treatment of stage II-IVA nasopharyngeal carcinoma: CSCO and ASCO guideline. J Clin Oncol. 2021;39:840–59. doi: 10.1200/JCO.20.03237. - DOI - PubMed

Publication types

MeSH terms