. 2024 Feb 6;14(1):3077.
doi: 10.1038/s41598-024-53587-y.

Rebaudioside D decreases adiposity and hepatic lipid accumulation in a mouse model of obesity

Affiliations

Rebaudioside D decreases adiposity and hepatic lipid accumulation in a mouse model of obesity

Arianne Morissette et al. Sci Rep. .

Abstract

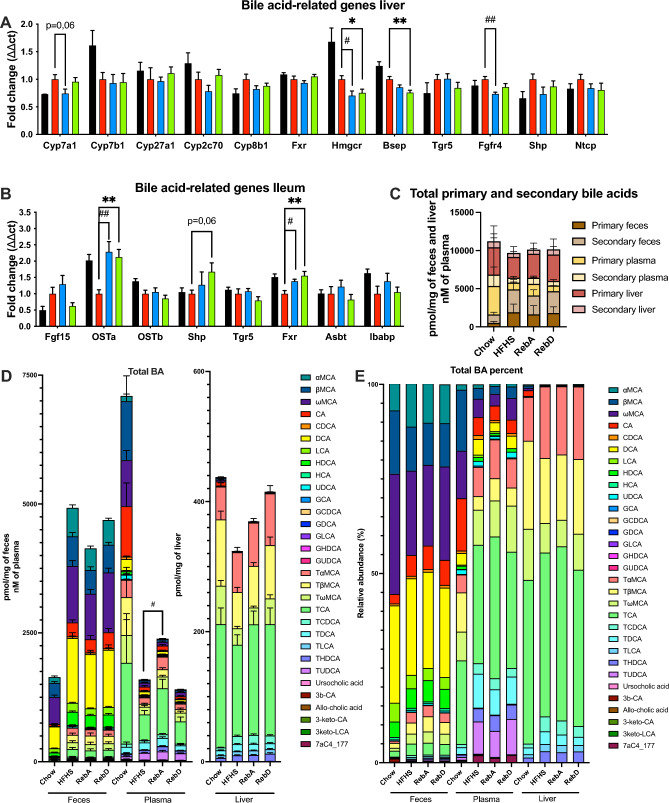
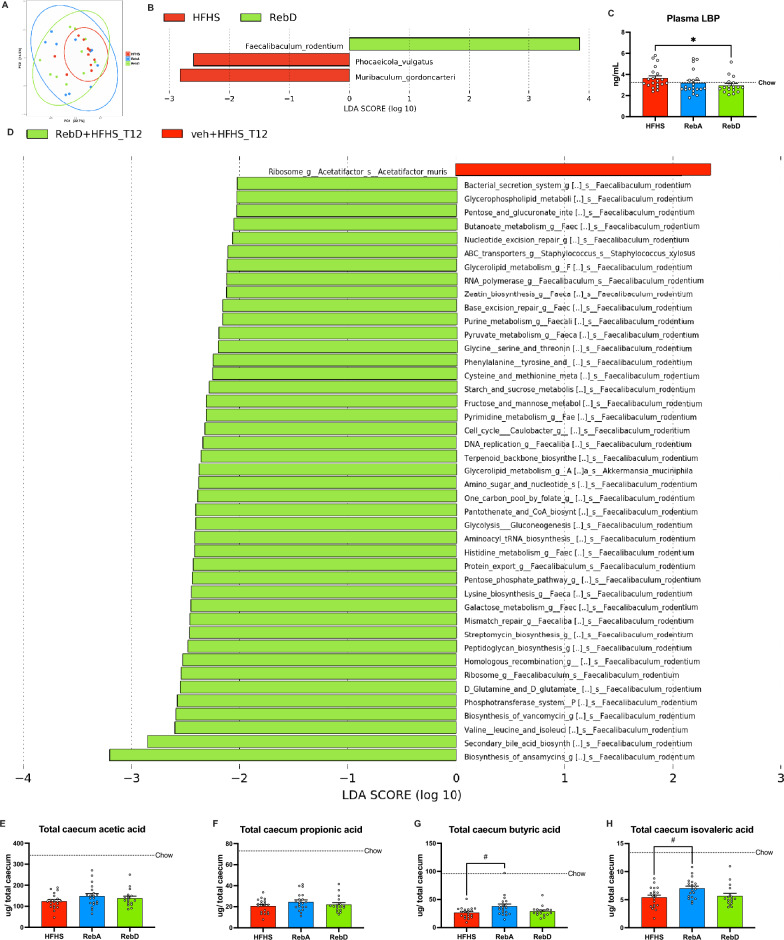
Overconsumption of added sugars has been pointed out as a major culprit in the increasing rates of obesity worldwide, contributing to the rising popularity of non-caloric sweeteners. In order to satisfy the growing demand, industrial efforts have been made to purify the sweet-tasting molecules found in the natural sweetener stevia, which are characterized by a sweet taste free of unpleasant aftertaste. Although the use of artificial sweeteners has raised many concerns regarding metabolic health, the impact of purified stevia components on the latter remains poorly studied. The objective of this project was to evaluate the impact of two purified sweet-tasting components of stevia, rebaudioside A and D (RebA and RebD), on the development of obesity, insulin resistance, hepatic health, bile acid profile, and gut microbiota in a mouse model of diet-induced obesity. Male C57BL/6 J mice were fed an obesogenic high-fat/high-sucrose (HFHS) diet and orally treated with 50 mg/kg of RebA, RebD or vehicle (water) for 12 weeks. An additional group of chow-fed mice treated with the vehicle was included as a healthy reference. At weeks 10 and 12, insulin and oral glucose tolerance tests were performed. Liver lipids content was analyzed. Whole-genome shotgun sequencing was performed to profile the gut microbiota. Bile acids were measured in the feces, plasma, and liver. Liver lipid content and gene expression were analyzed. As compared to the HFHS-vehicle treatment group, mice administered RebD showed a reduced weight gain, as evidenced by decreased visceral adipose tissue weight. Liver triglycerides and cholesterol from RebD-treated mice were lower and lipid peroxidation was decreased. Interestingly, administration of RebD was associated with a significant enrichment of Faecalibaculum rodentium in the gut microbiota and an increased secondary bile acid metabolism. Moreover, RebD decreased the level of lipopolysaccharide-binding protein (LBP). Neither RebA nor RebD treatments were found to impact glucose homeostasis. The daily consumption of two stevia components has no detrimental effects on metabolic health. In contrast, RebD treatment was found to reduce adiposity, alleviate hepatic steatosis and lipid peroxidation, and decrease LBP, a marker of metabolic endotoxemia in a mouse model of diet-induced obesity.


Conflict of interest statement

PDC is inventor on patent applications dealing with the use of specific bacteria and components in the treatment of different diseases. PDC was cofounder of The Akkermansia Company SA and Enterosys SA.

Figures

Figure 1
Figure 1
Daily gavage with RebD decreases weight gain and adiposity, and RebA and RebD do not alter glucose homeostasis. (A) Body weight gain, (B) total energy intake, and (C) daily fecal energy excretion. (D) Total adjusted adipose tissue, namely (E) epidydimal (eWAT), mesenteric (mWAT), retroperitoneal (rpWAT), and inguinal fat (iWAT) adjusted for body weight. (F) Glycemia during intraperitoneal insulin tolerance test (ipITT). (G) Glycemia and (H) insulinemia during oral glucose tolerance test (OGTT). Data are expressed in mean ± SEM. n = 17–20. (BD) One-way ANOVA test with Dunnett’s post-hoc. (E) One-way Welch’s ANOVA with Dunnett’s T3 multiple comparisons test. (A,FH) Two-way ANOVA with Tukey’s post-hoc. *p < 0.05 HFHS vs. RebD.
Figure 2
Figure 2
RebD attenuates the accumulation of hepatic triglycerides and cholesterol. (A) Liver weight. (B,C) Liver triglyceride and cholesterol accumulation. (D) Quantification of Oil-red O (ORO)-positive area. Representative images of hepatic lipid accumulation by ORO staining at 20X objective for (E) chow, HFHS, RebA and RebD. Liver mRNA expression of genes related to (F) lipid synthesis, (G) lipid metabolism, and (H) inflammation were quantified by RT-qPCR; HFHS group as the control. (I) Thiobarbituric acid substances (TBARS) are measured in the liver. (J) Cropped immunoblotting and (K) quantification of densitometry analysis for phosphorylated Acetyl-CoA Carboxylase (pSer79-Acc) corrected for total Acc. Original Blots/gels are presented in Supplementary Fig. 2 and 3. (F) One-way ANOVA with Dunnett’s post-hoc. (B,C,G,K) One-way Welch’s ANOVA with Dunnett’s T3 multiple comparisons test. (I) Kruskal–Wallis test with Dunn’s multiple comparisons test. Data are expressed as the mean ± SEM. n = 17–20. *p < 0.05 HFHS vs. RebD. #p < 0.05 HFHS vs. RebA. ##p < 0.01 HFHS vs. RebA.
Figure 3
Figure 3
RebA and RebD modify bile acid metabolism. Messenger RNA extracted from the liver (A) and ileum (B) of genes involved in bile acid metabolism was quantified by RT-qPCR. (C) Total primary and secondary bile acids in feces, plasma, and liver. (D,E) Bile acids measured in feces, plasma, and liver are expressed in absolute and relative abundance. (A,B,D) One-way ANOVA with Dunnett’s post-hoc test. Data are expressed as the mean ± SEM. n = 17–20. *p < 0.05 HFHS vs. RebD. **p < 0.01 HFHS vs. RebD. #p < 0.05 HFHS vs. RebA. ##p < 0.01 HFHS vs. RebA.
Figure 4
Figure 4
RebD, but not RebA, induces changes in the taxonomy and pathways of the fecal gut microbiota and decreases LBP. Genomic DNA was extracted from fecal samples and analyzed by whole-genome shotgun sequencing. (A) PCA of the Aitchison distance between groups. (B) Linear discriminant analysis (LDA) effect size (LEfSE) was calculated to identify differentially abundant taxa between the gut microbiota of HFHS-fed mice administered the vehicle and RebD. (C) Plasmatic levels of lipopolysaccharide-binding protein (LBP). (D) Bacterial pathways differentially expressed by bacteria of HFHS-fed mice administered the vehicle or RebD calculated by LEfSE. Ceacum concentration of (E) acetic, (F) propionic, (G) butyric, and (H) isovaleric acid. n = 17–20 for SCFA measurements. n = 10 for shotgun sequencing. Data are expressed in mean ± SEM. (D) Kruskal–Wallis test with Dunn’s post-hoc. (EH) One-way ANOVA with Dunnett’s post-hoc. *p < 0.05 HFHS vs RebD. #p < 0.05 HFHS vs RebA.

References

    1. World Health Organization. Obesity and Overweight. https://www.who.int/en/news-room/fact-sheets/detail/obesity-and-overweight. 2020.
    1. Malik VS, Hu FB. The role of sugar-sweetened beverages in the global epidemics of obesity and chronic diseases. Nat. Rev. Endocrinol. 2022 doi: 10.1038/s41574-021-00627-6. - DOI - PMC - PubMed
    1. Fagherazzi G, et al. Consumption of artificially and sugar-sweetened beverages and incident type 2 diabetes in the Etude Epidemiologique aupres des femmes de la Mutuelle Generale de l'Education Nationale-European prospective investigation into cancer and nutrition cohort. Am. J. Clin. Nutr. 2013;97(3):517–523. doi: 10.3945/ajcn.112.050997. - DOI - PubMed
    1. Fowler SP, et al. Fueling the obesity epidemic? Artificially sweetened beverage use and long-term weight gain. Obesity (Silver Spring) 2008;16(8):1894–1900. doi: 10.1038/oby.2008.284. - DOI - PubMed
    1. Sylvetsky AC, Rother KI. Nonnutritive sweeteners in weight management and chronic disease: A review. Obesity (Silver Spring) 2018;26(4):635–640. doi: 10.1002/oby.22139. - DOI - PMC - PubMed