. 2024 Feb;26(2):250-262.
doi: 10.1038/s41556-023-01337-z. Epub 2024 Feb 6.

Epithelial zonation along the mouse and human small intestine defines five discrete metabolic domains

Affiliations

Epithelial zonation along the mouse and human small intestine defines five discrete metabolic domains

Rachel K Zwick et al. Nat Cell Biol. 2024 Feb.

Abstract

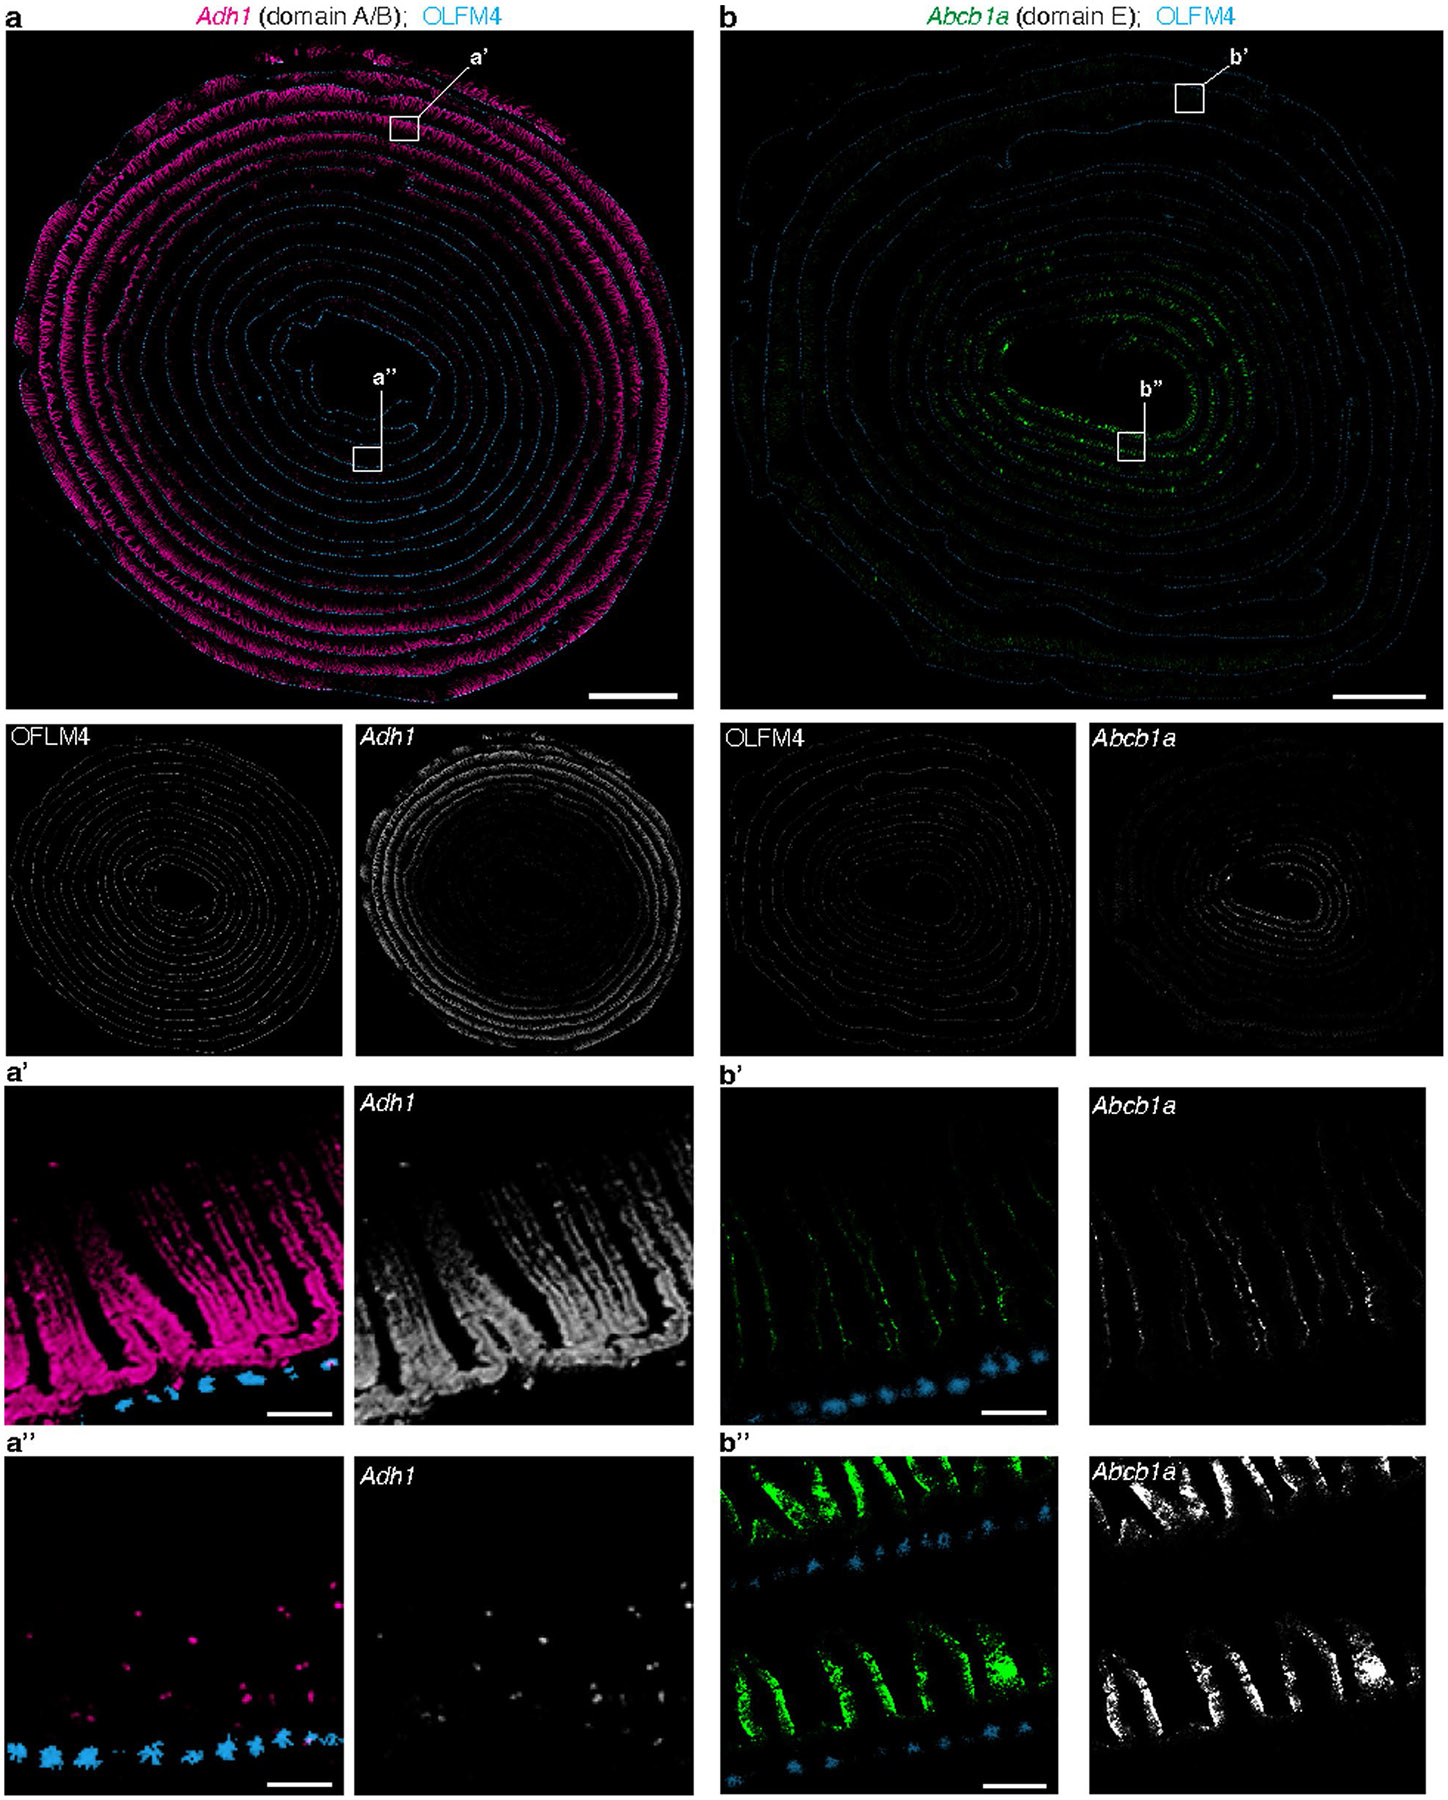
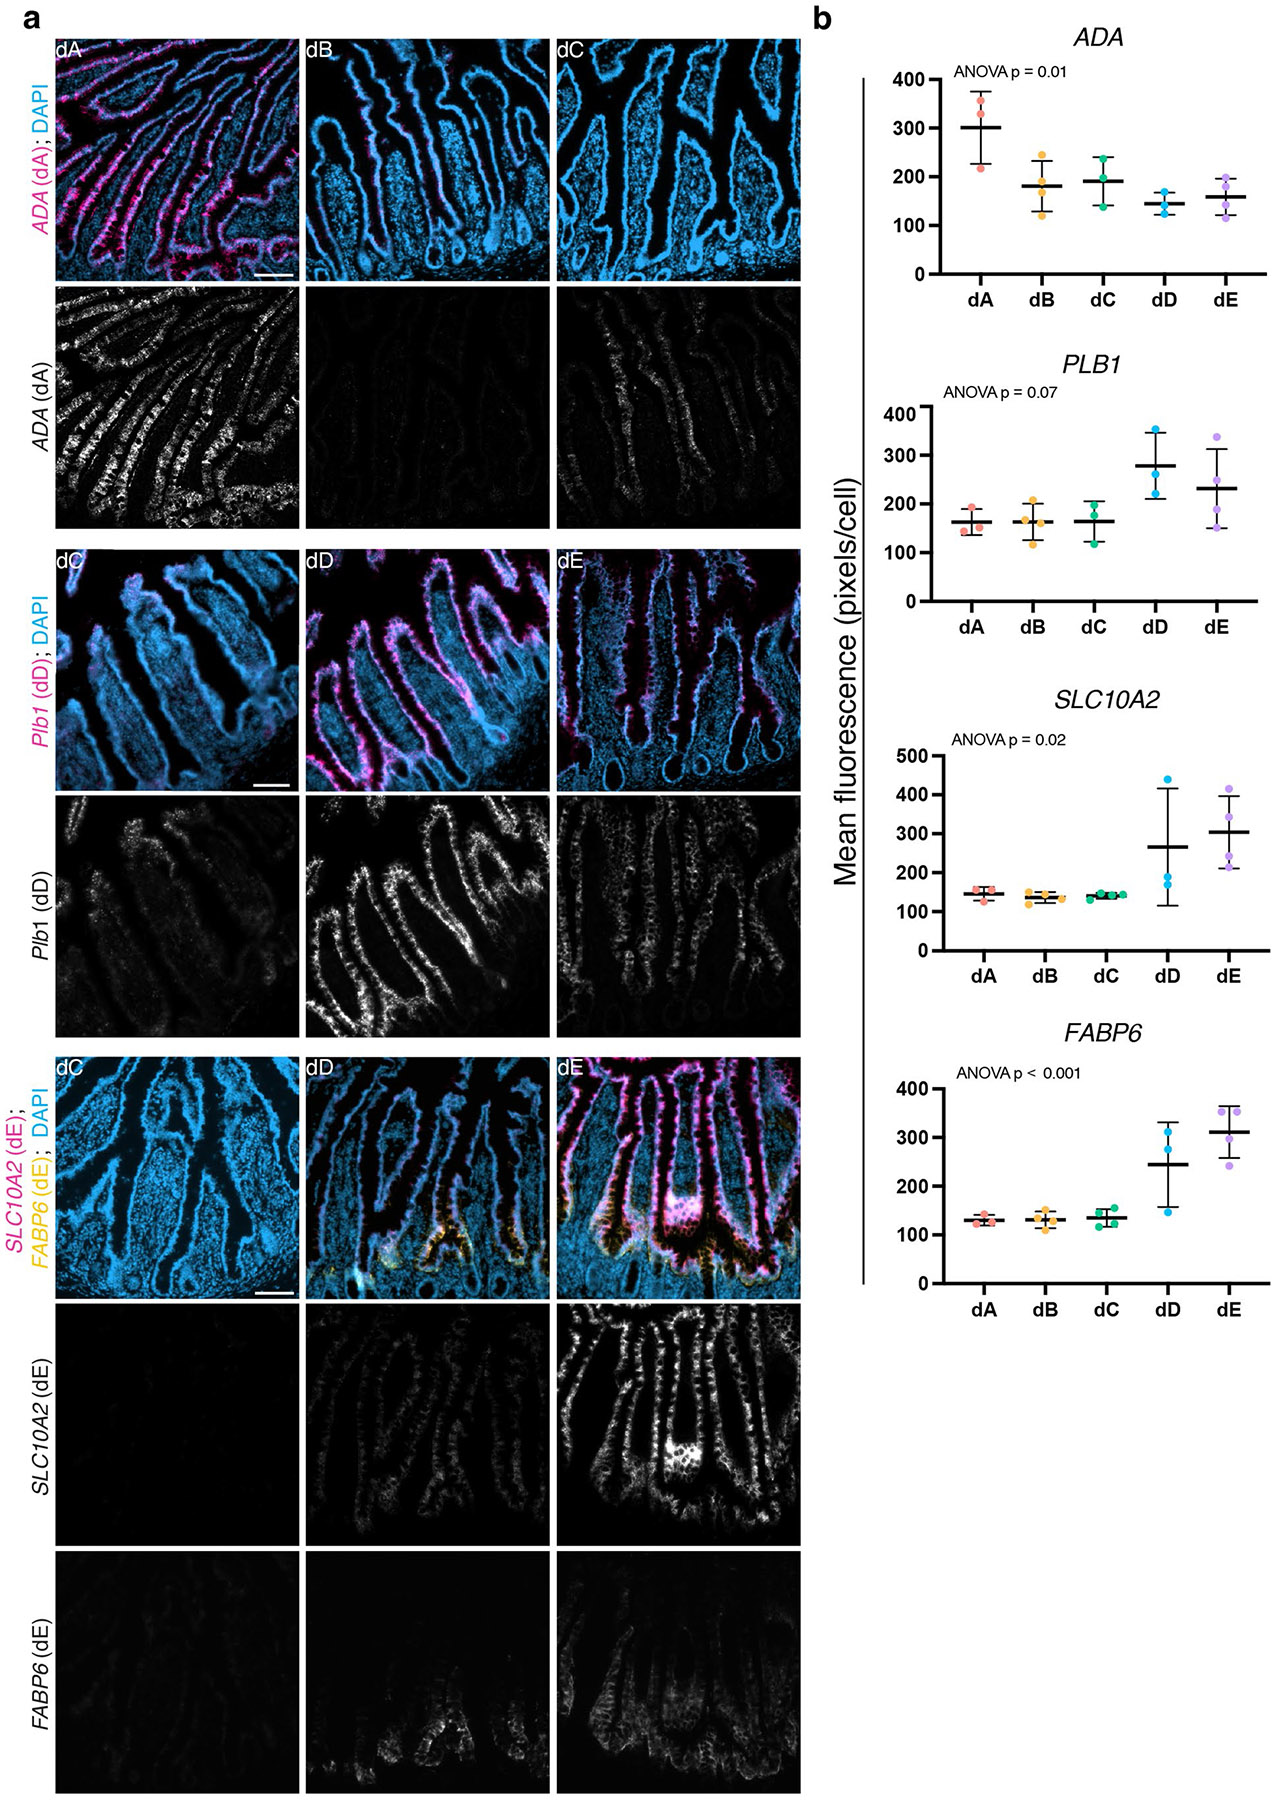
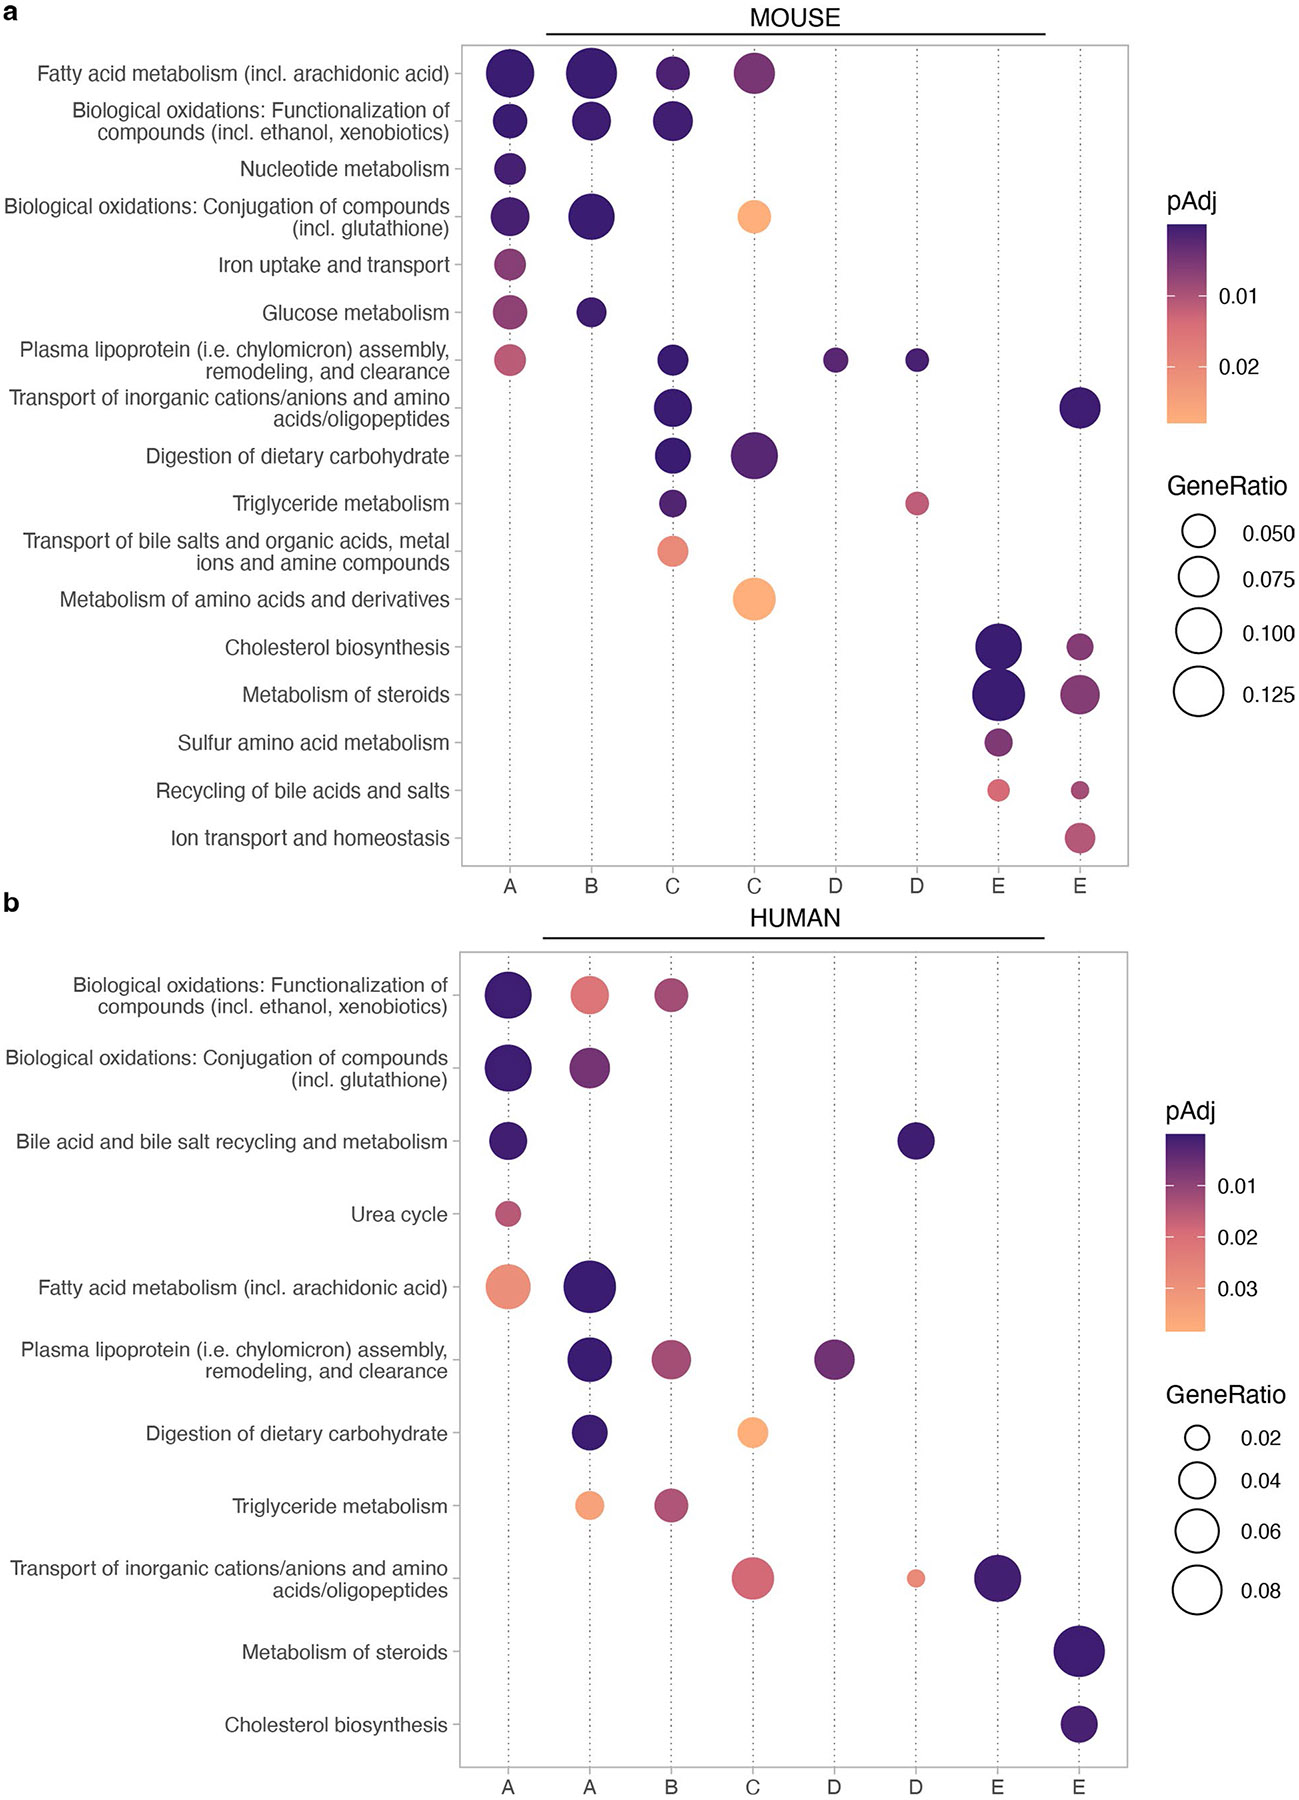
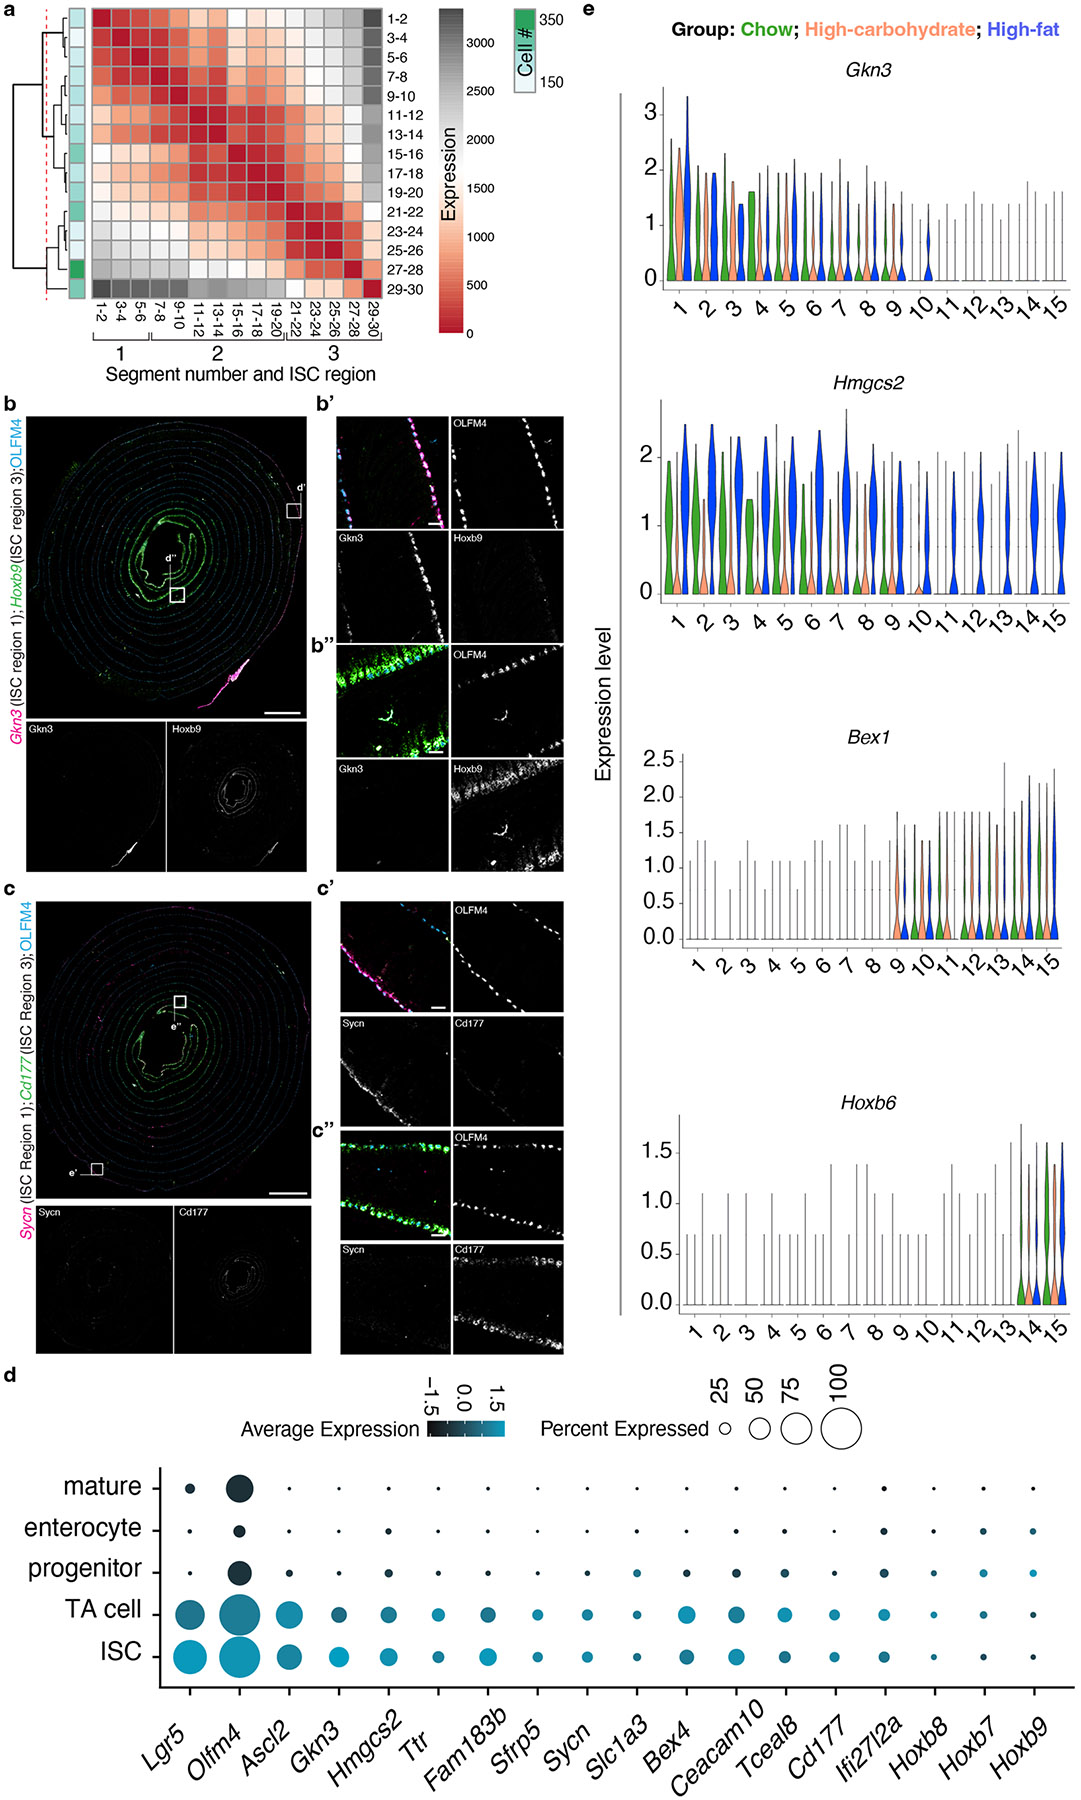
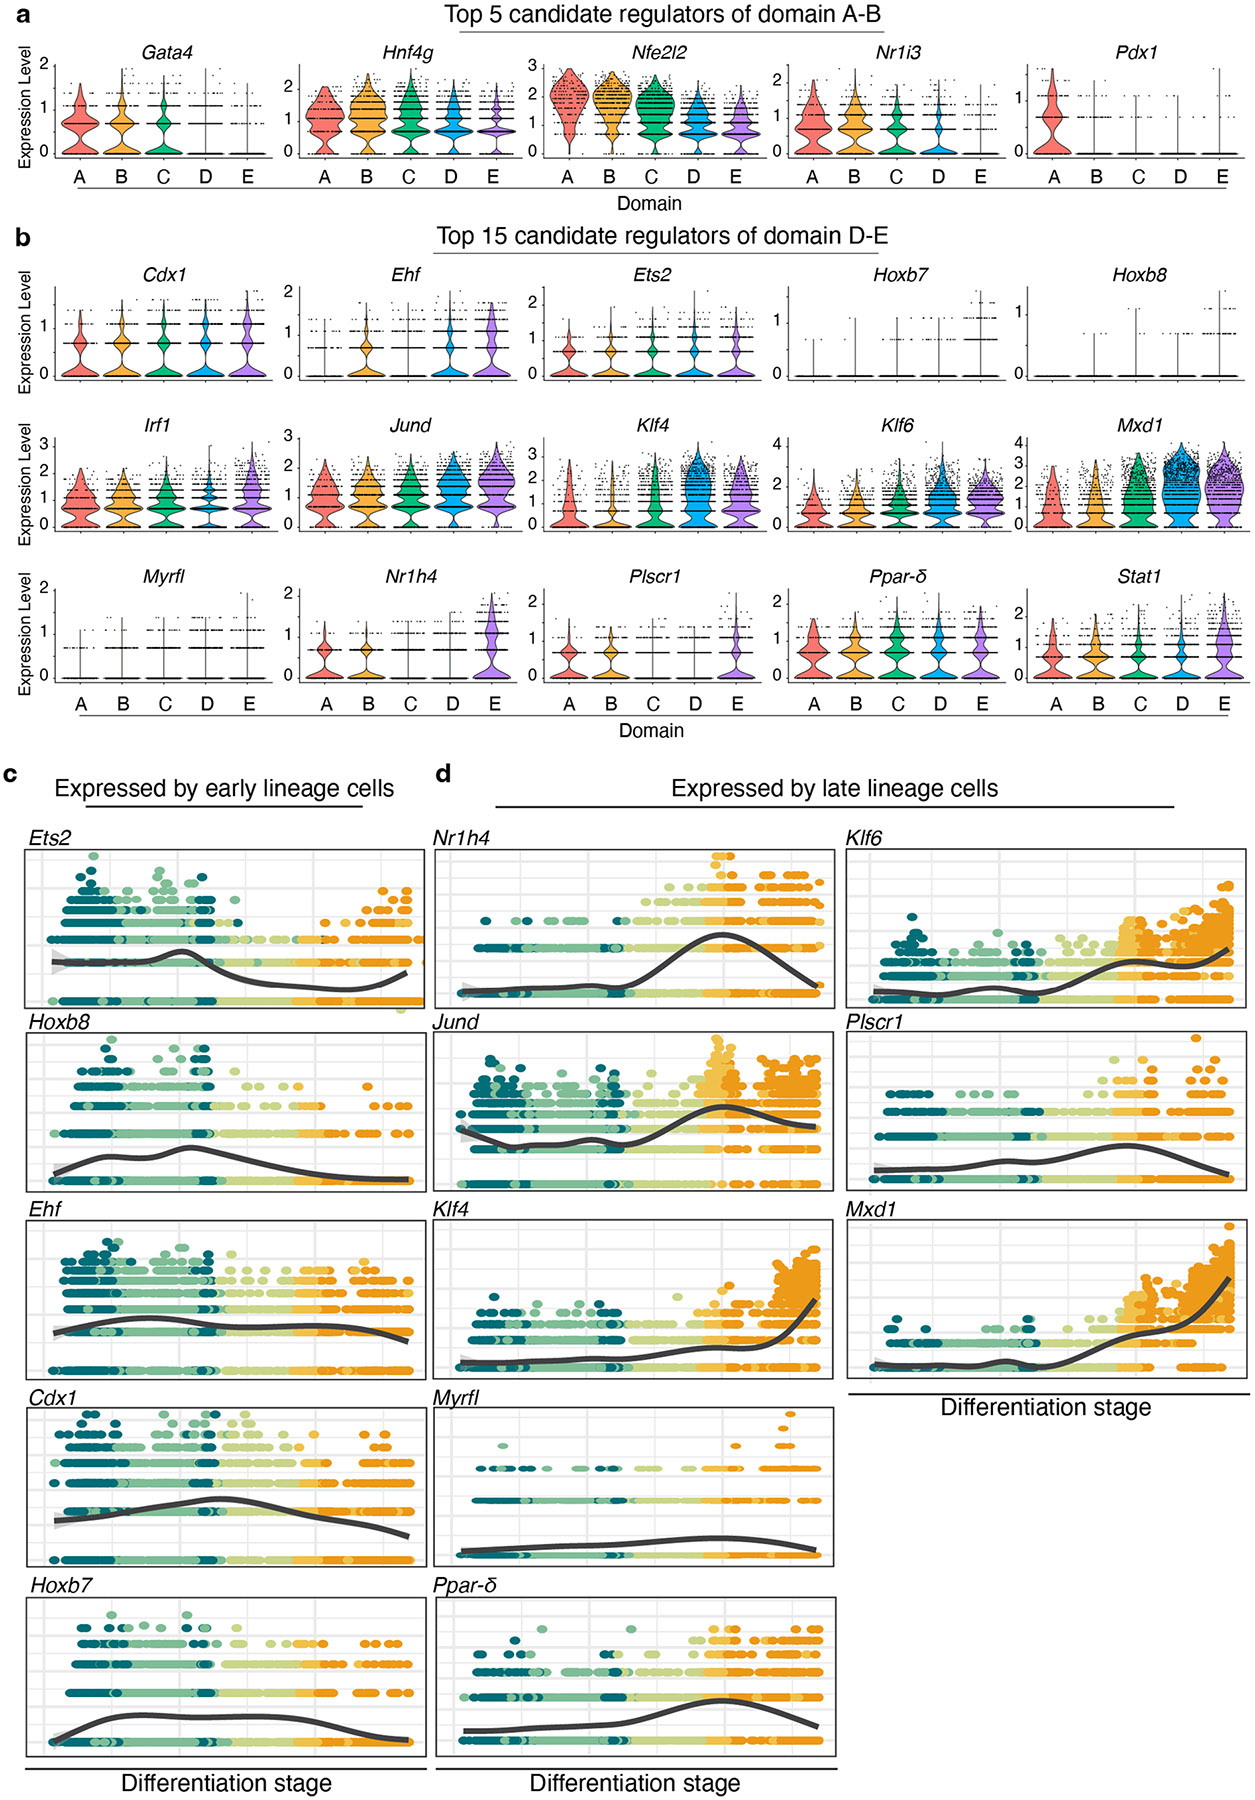
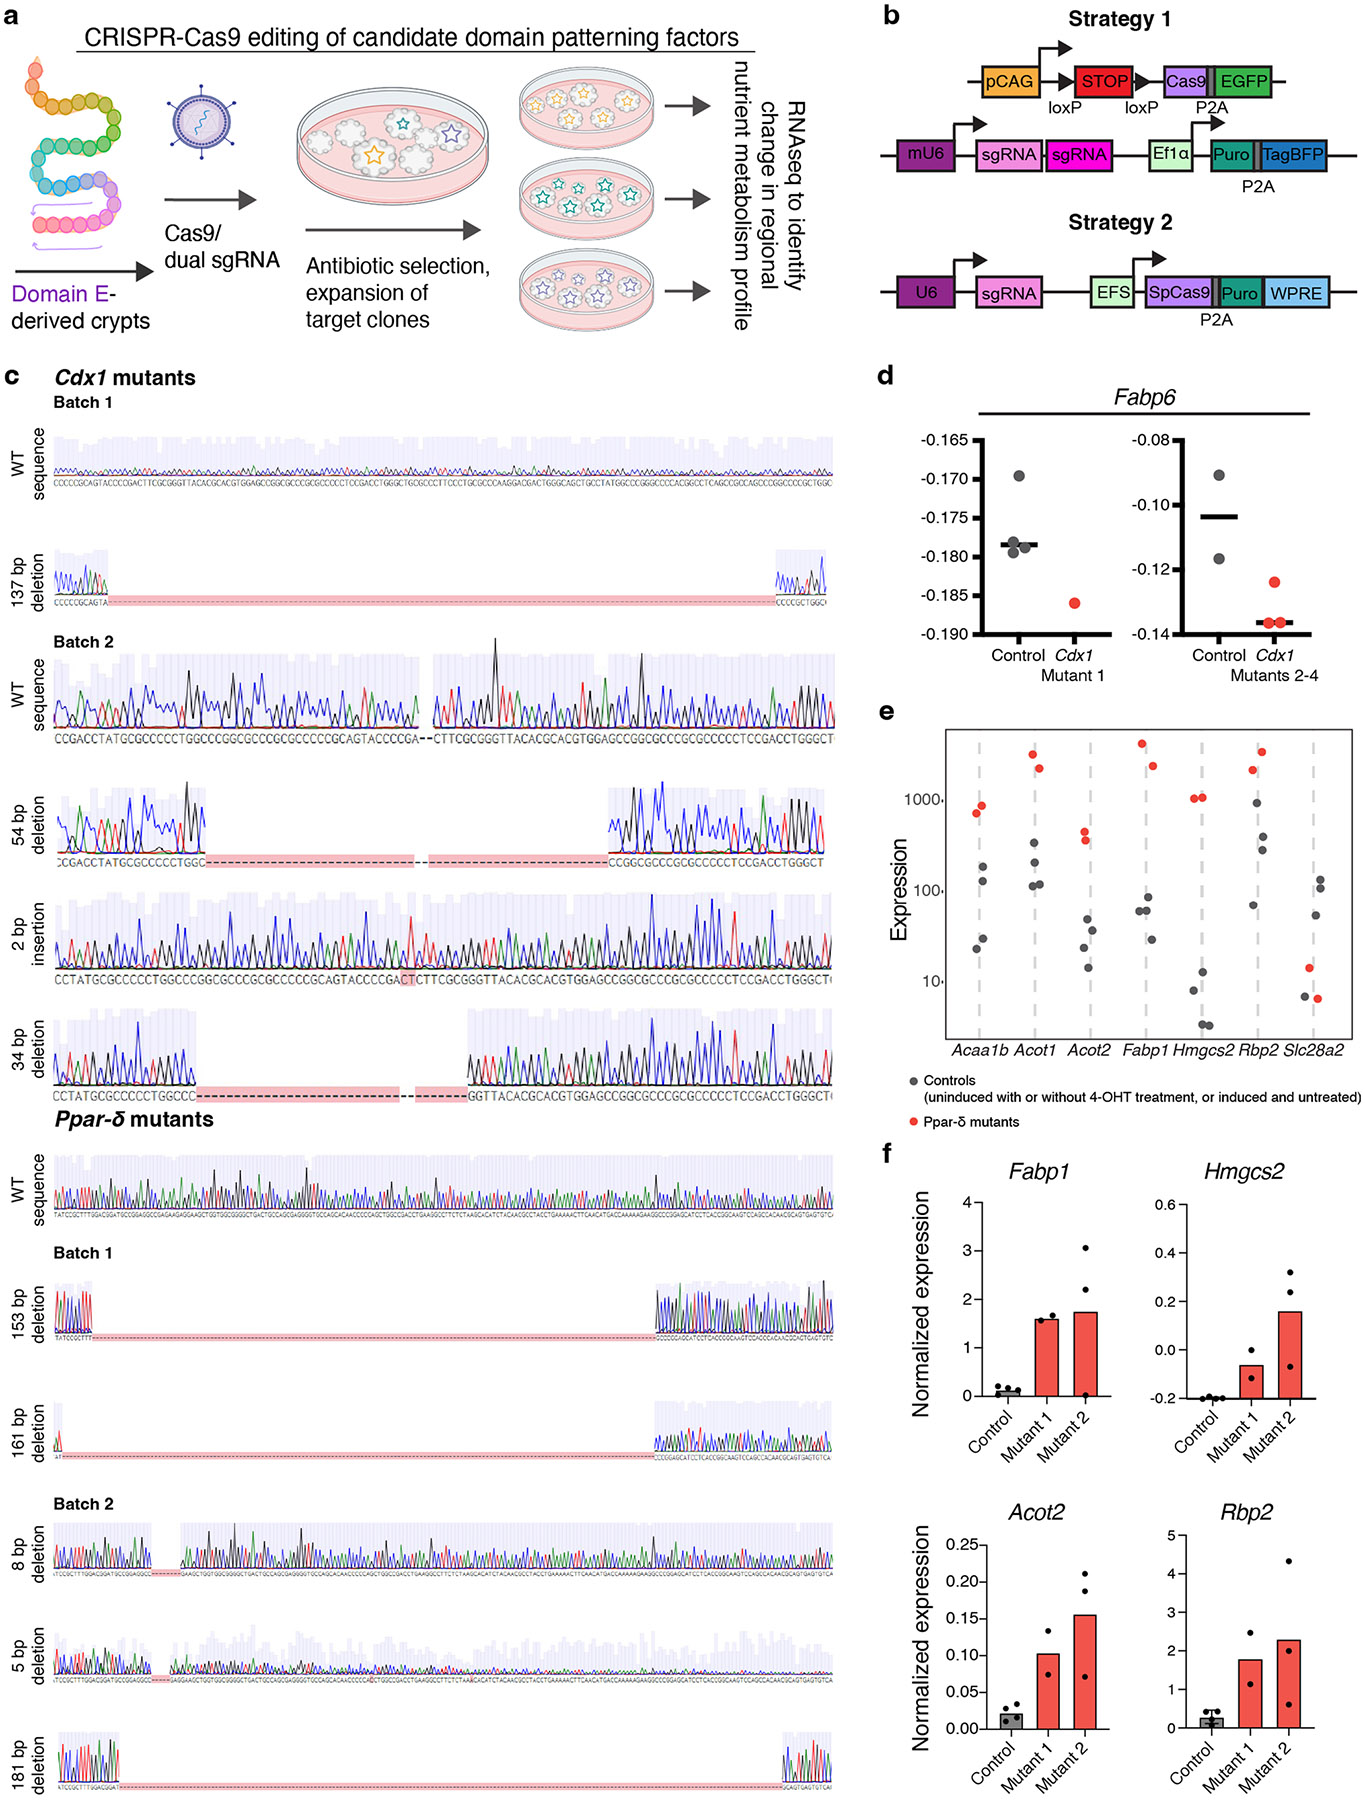
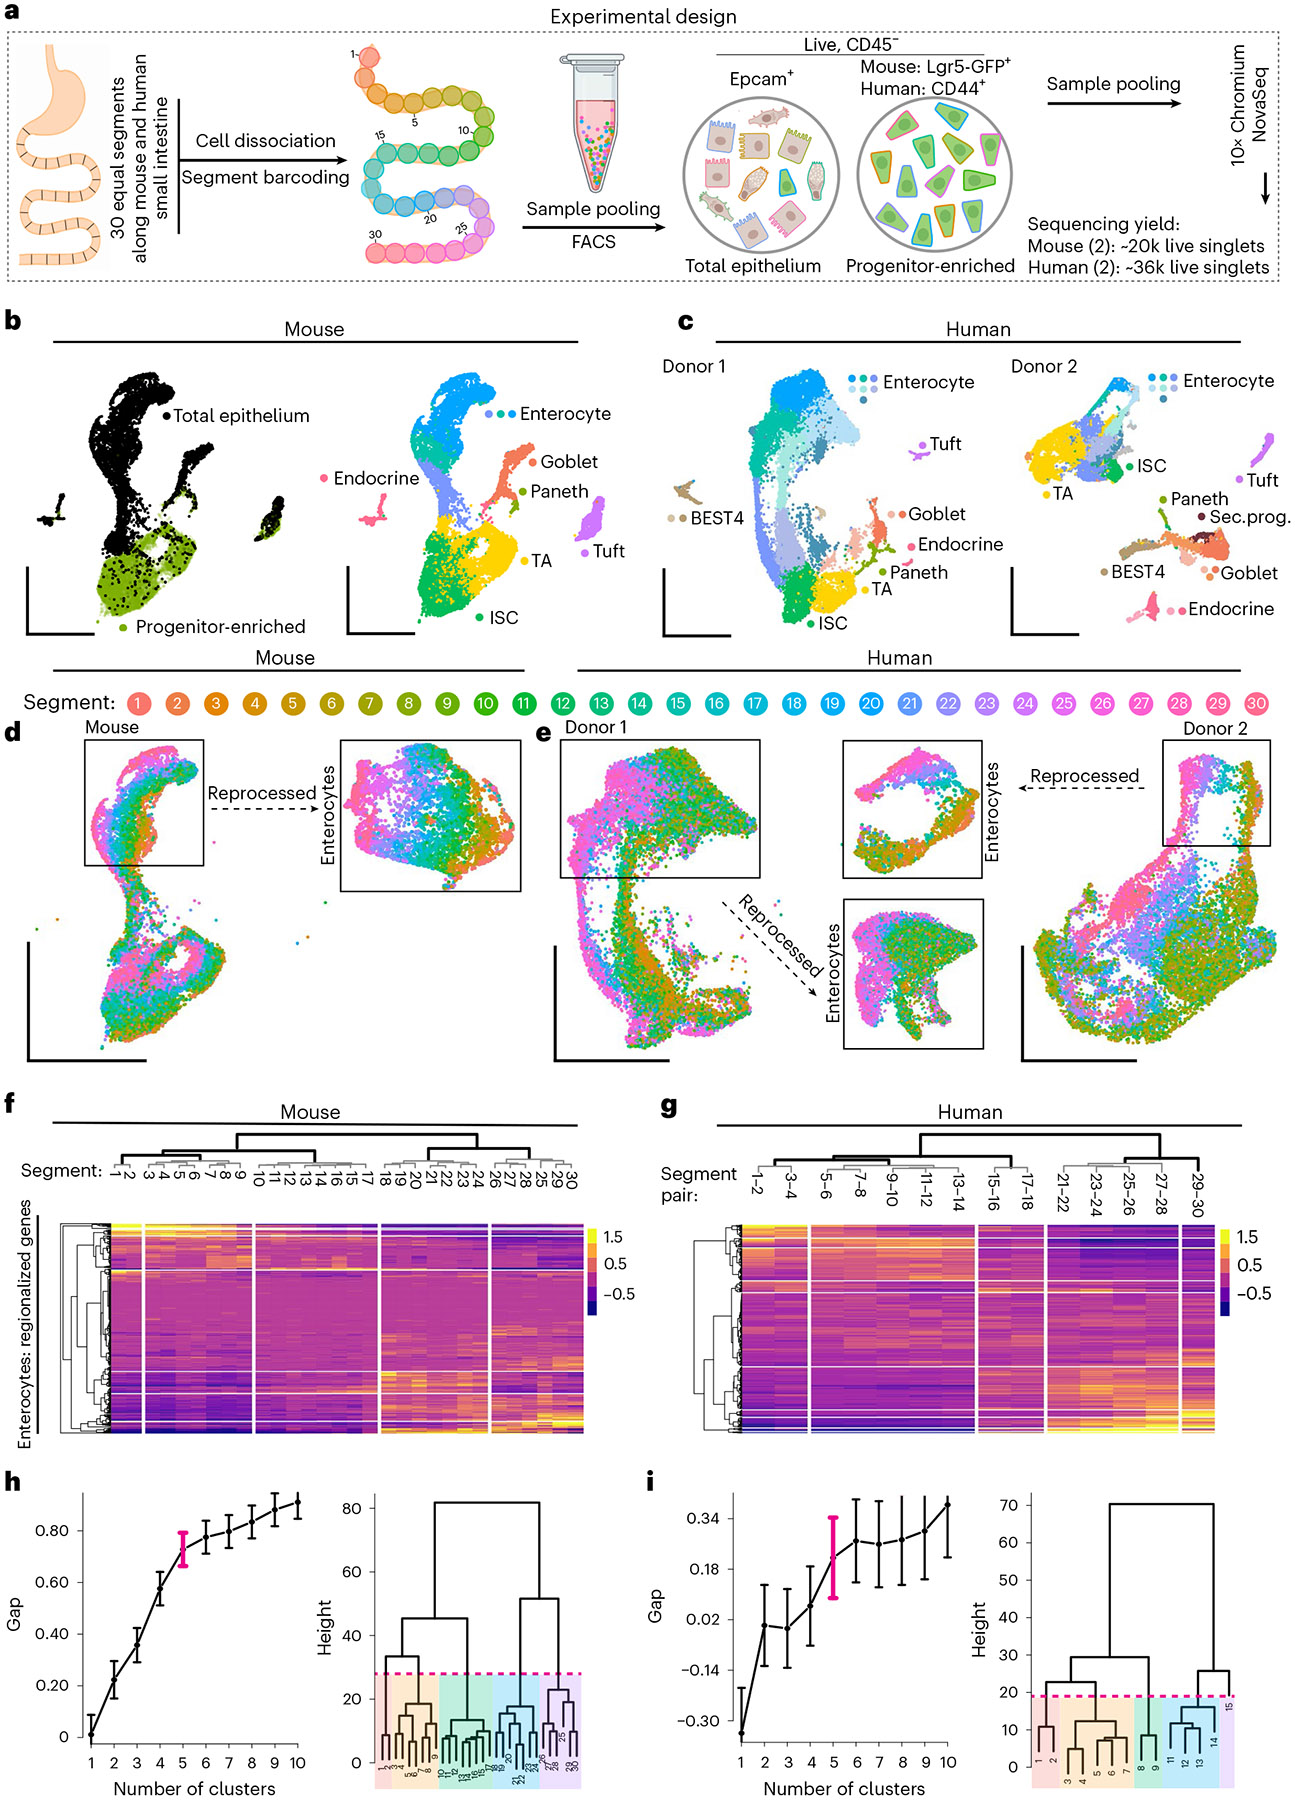
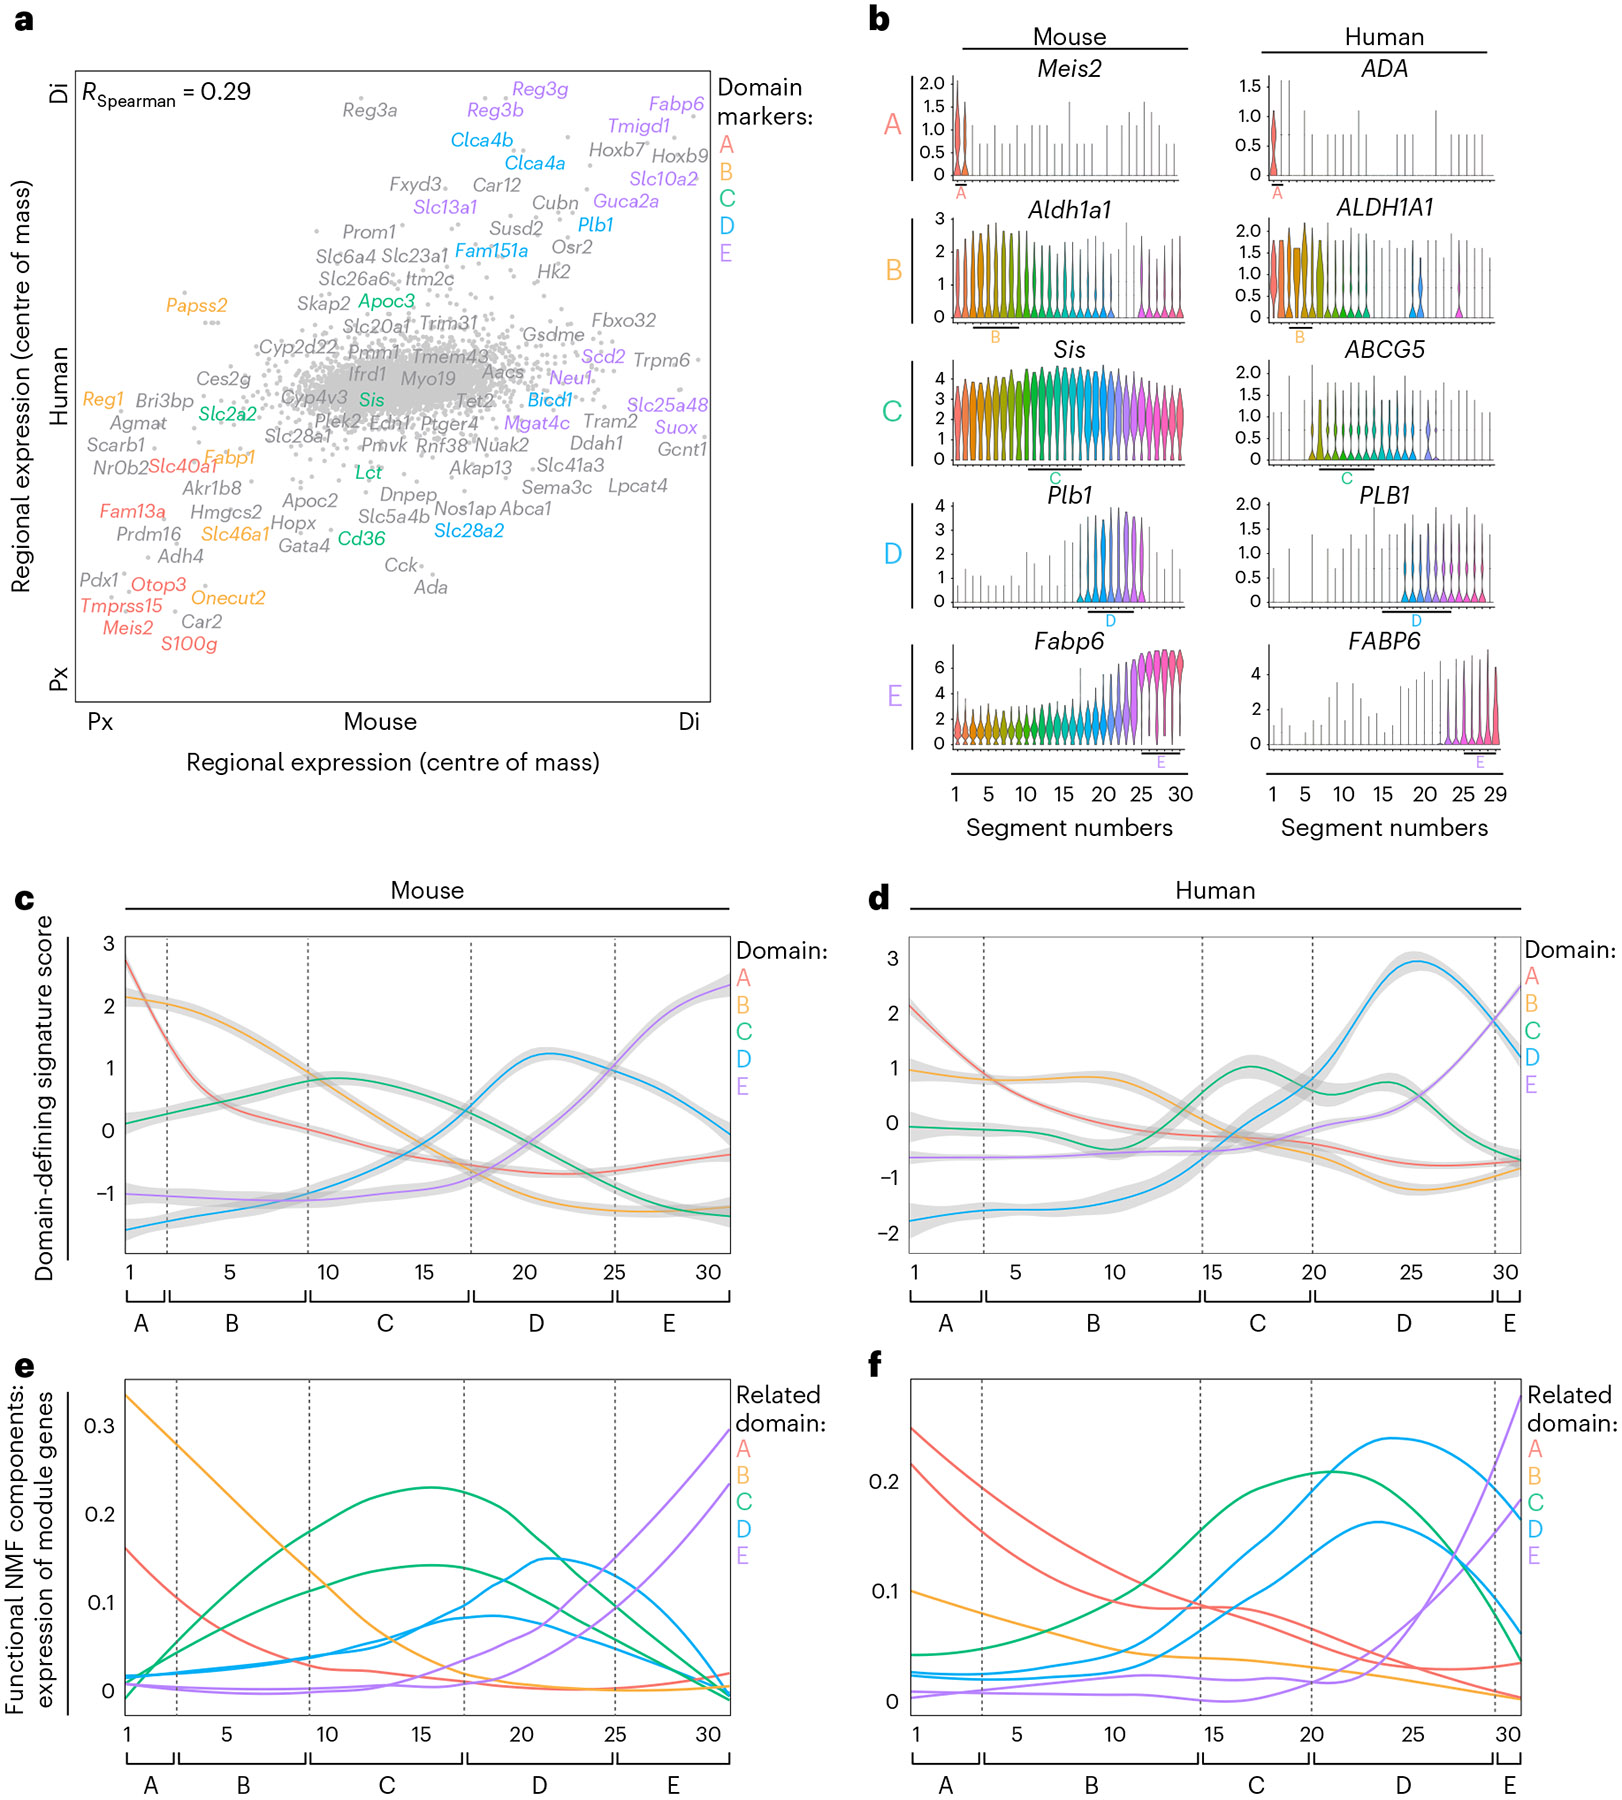
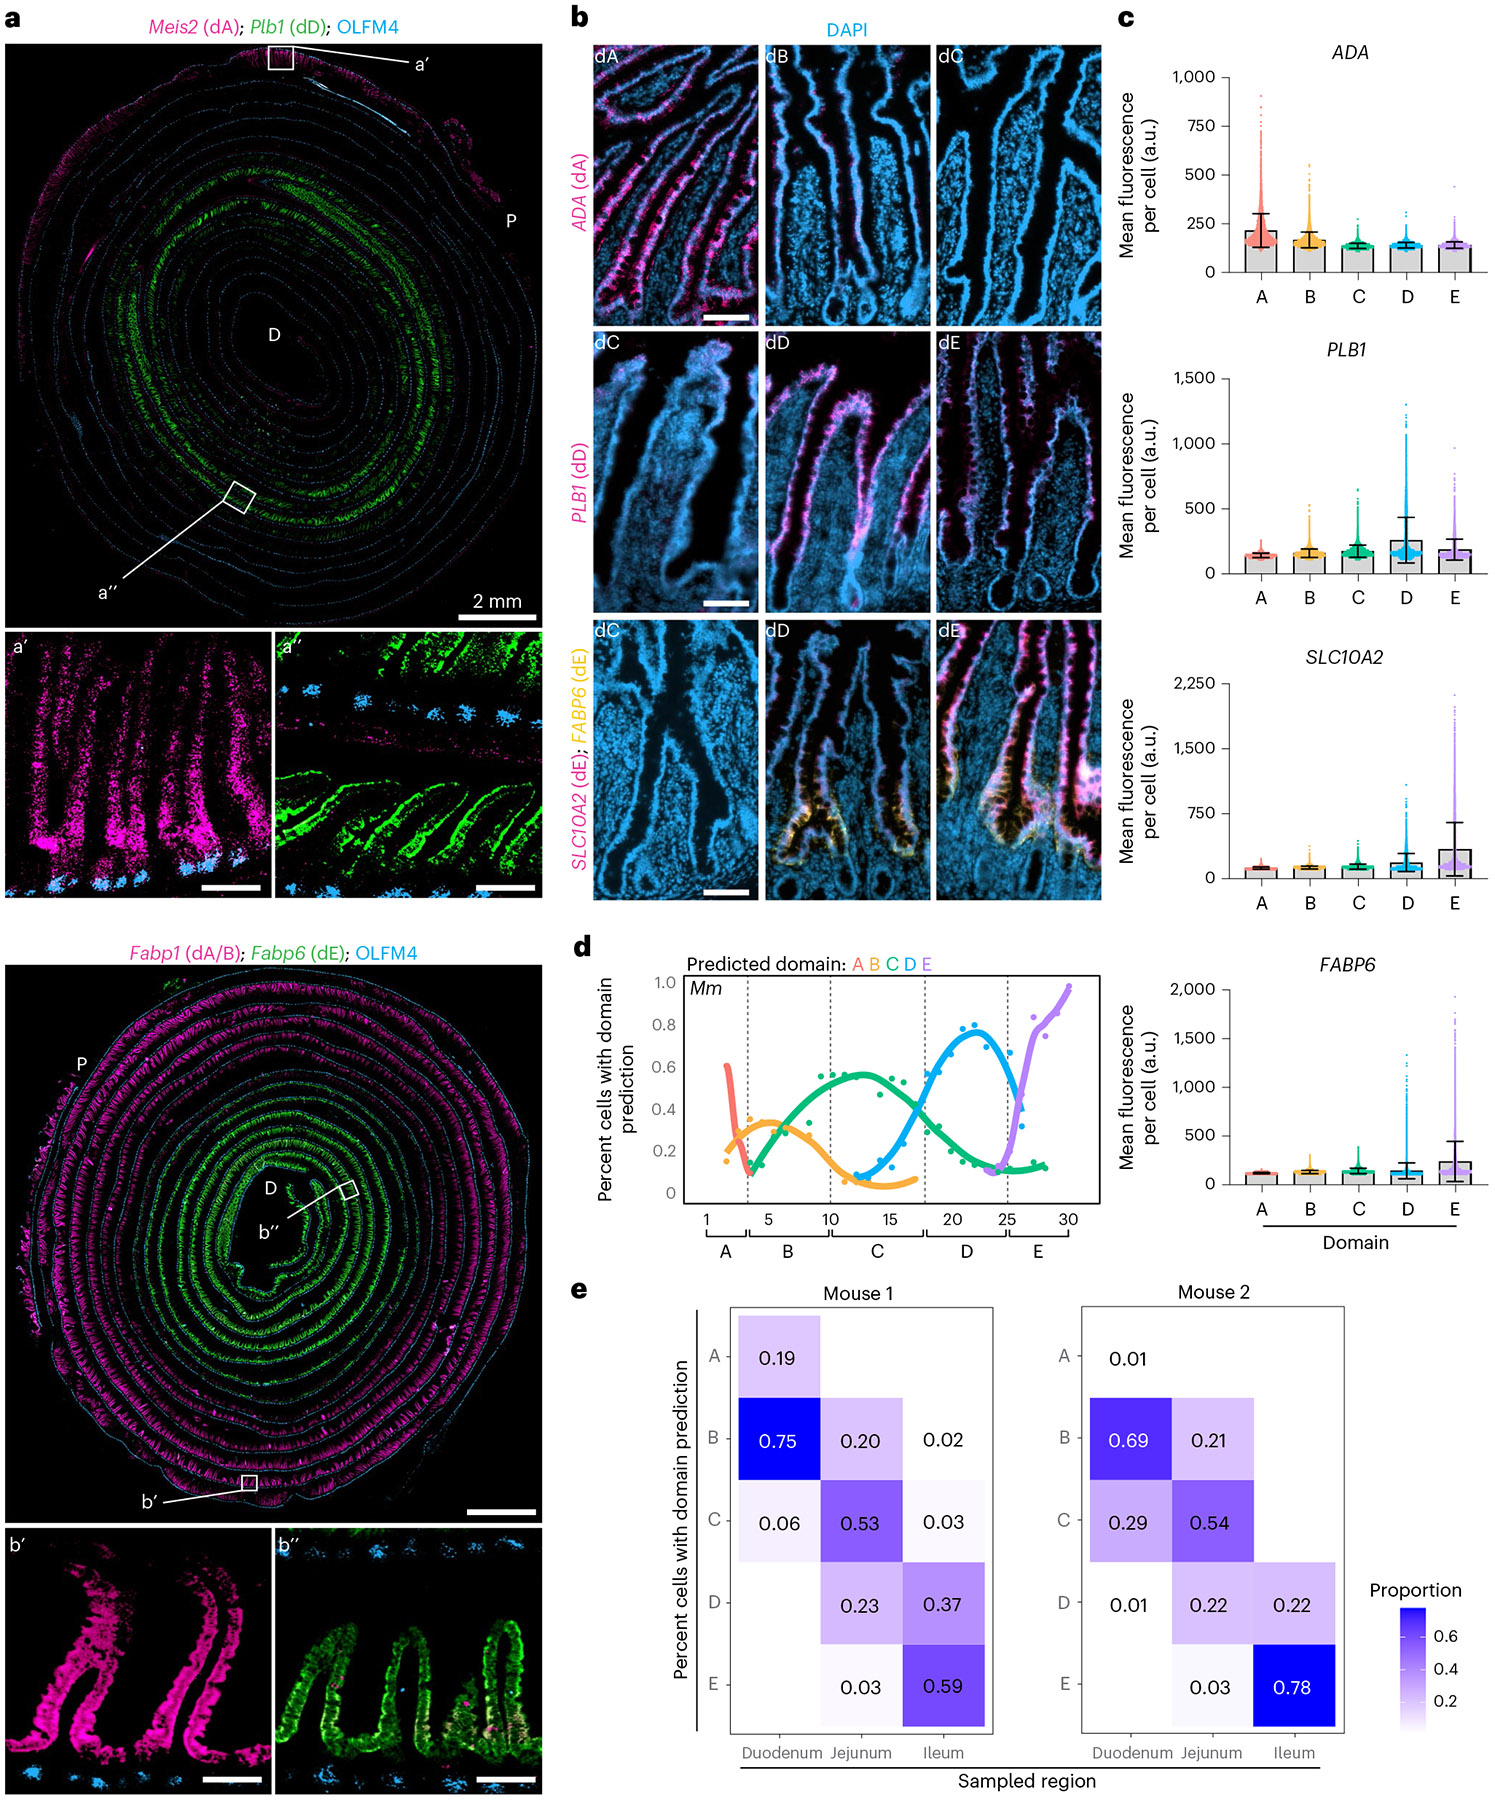
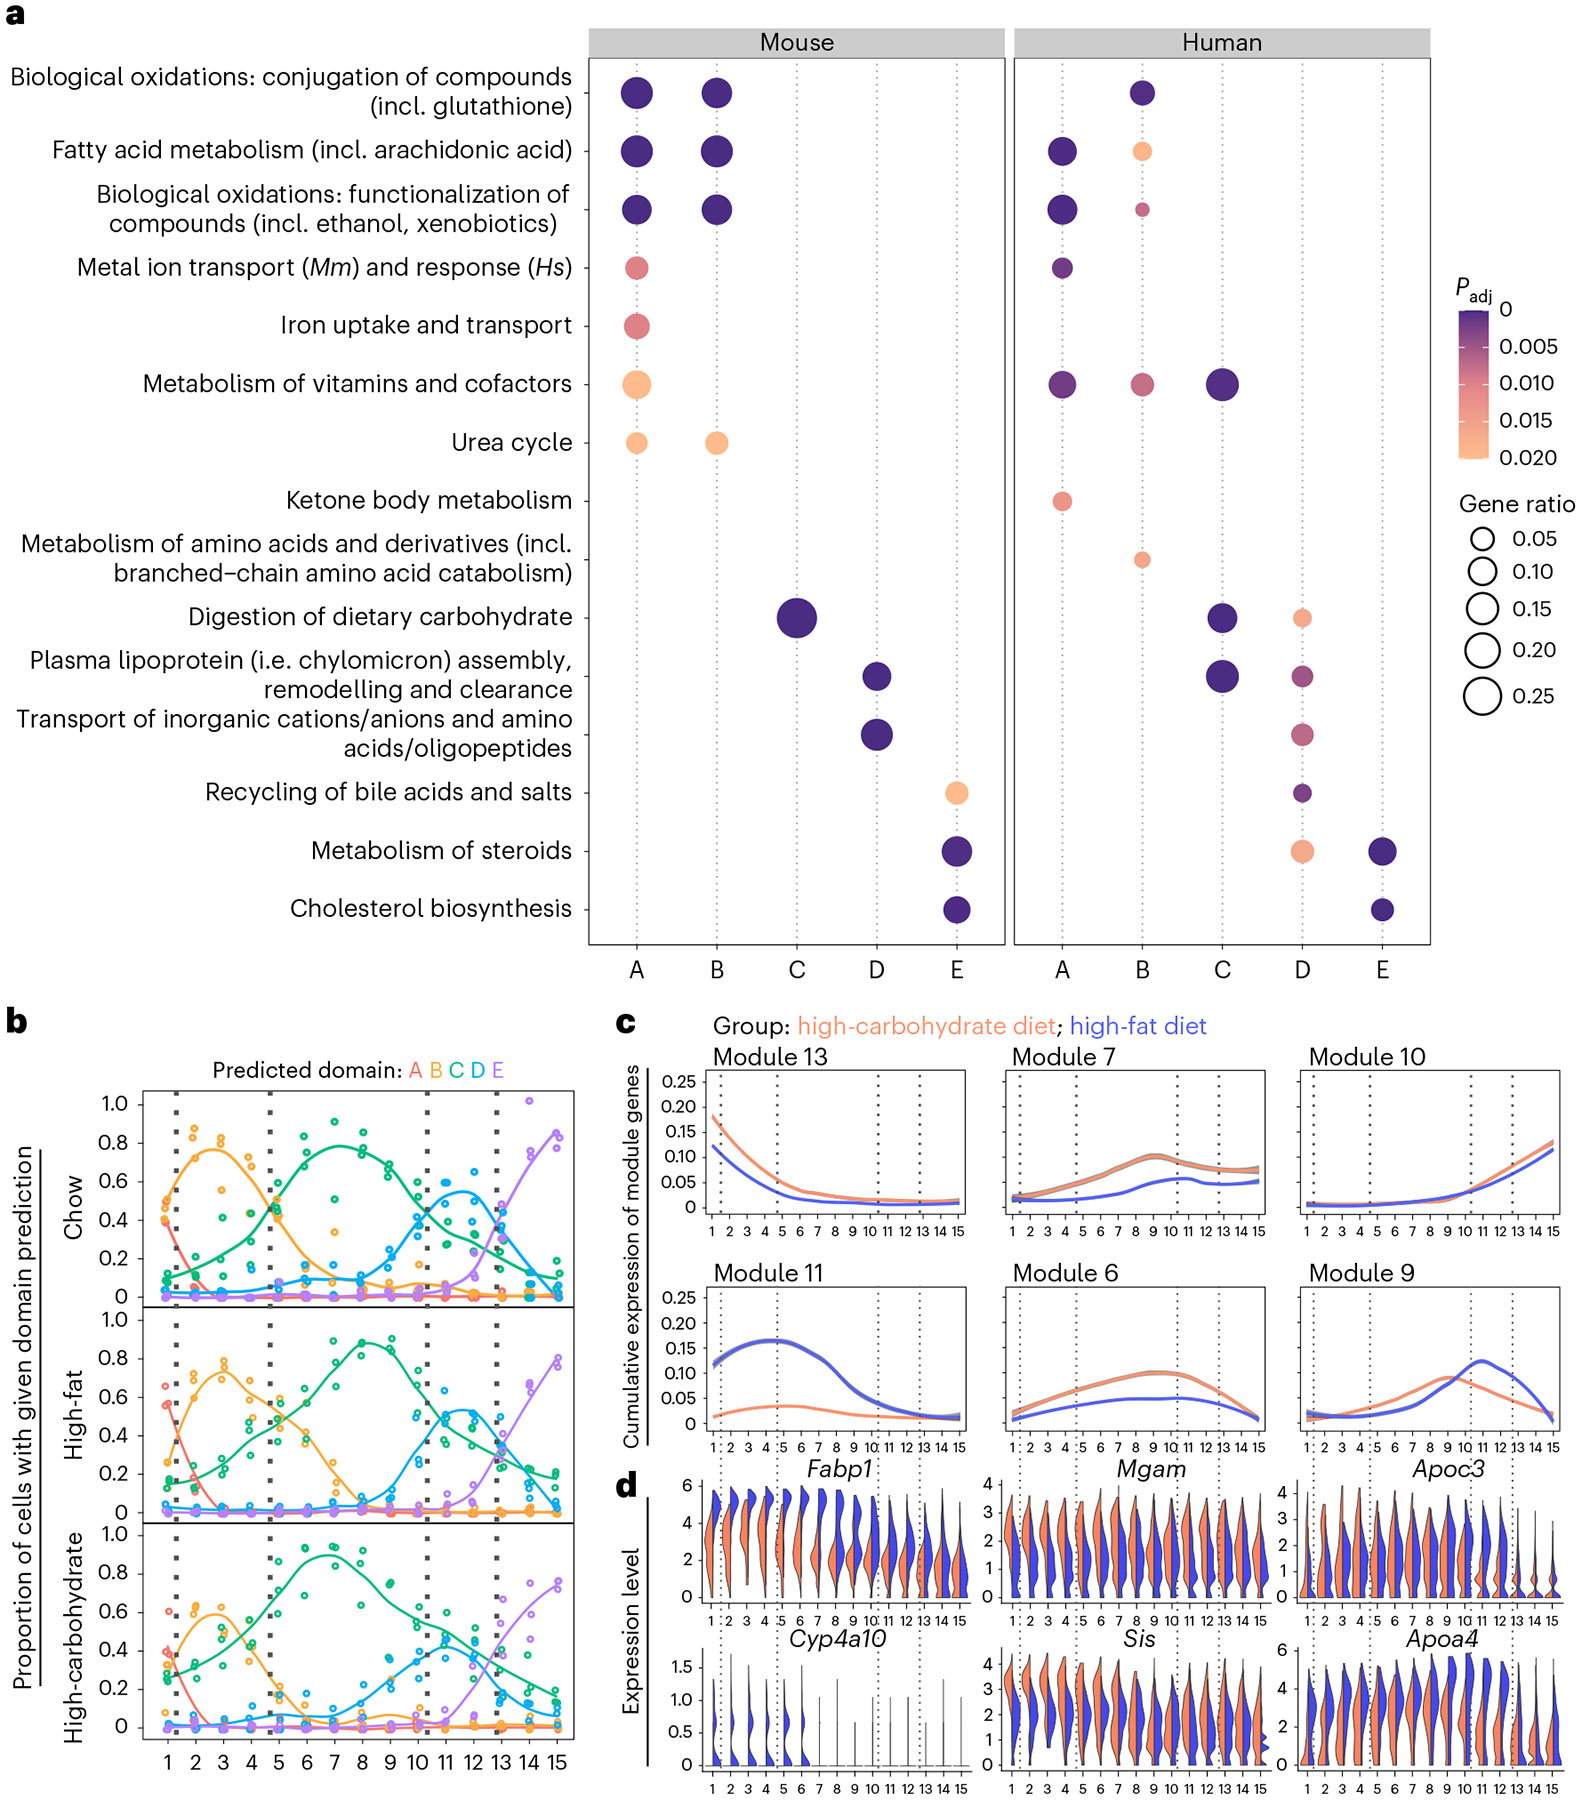
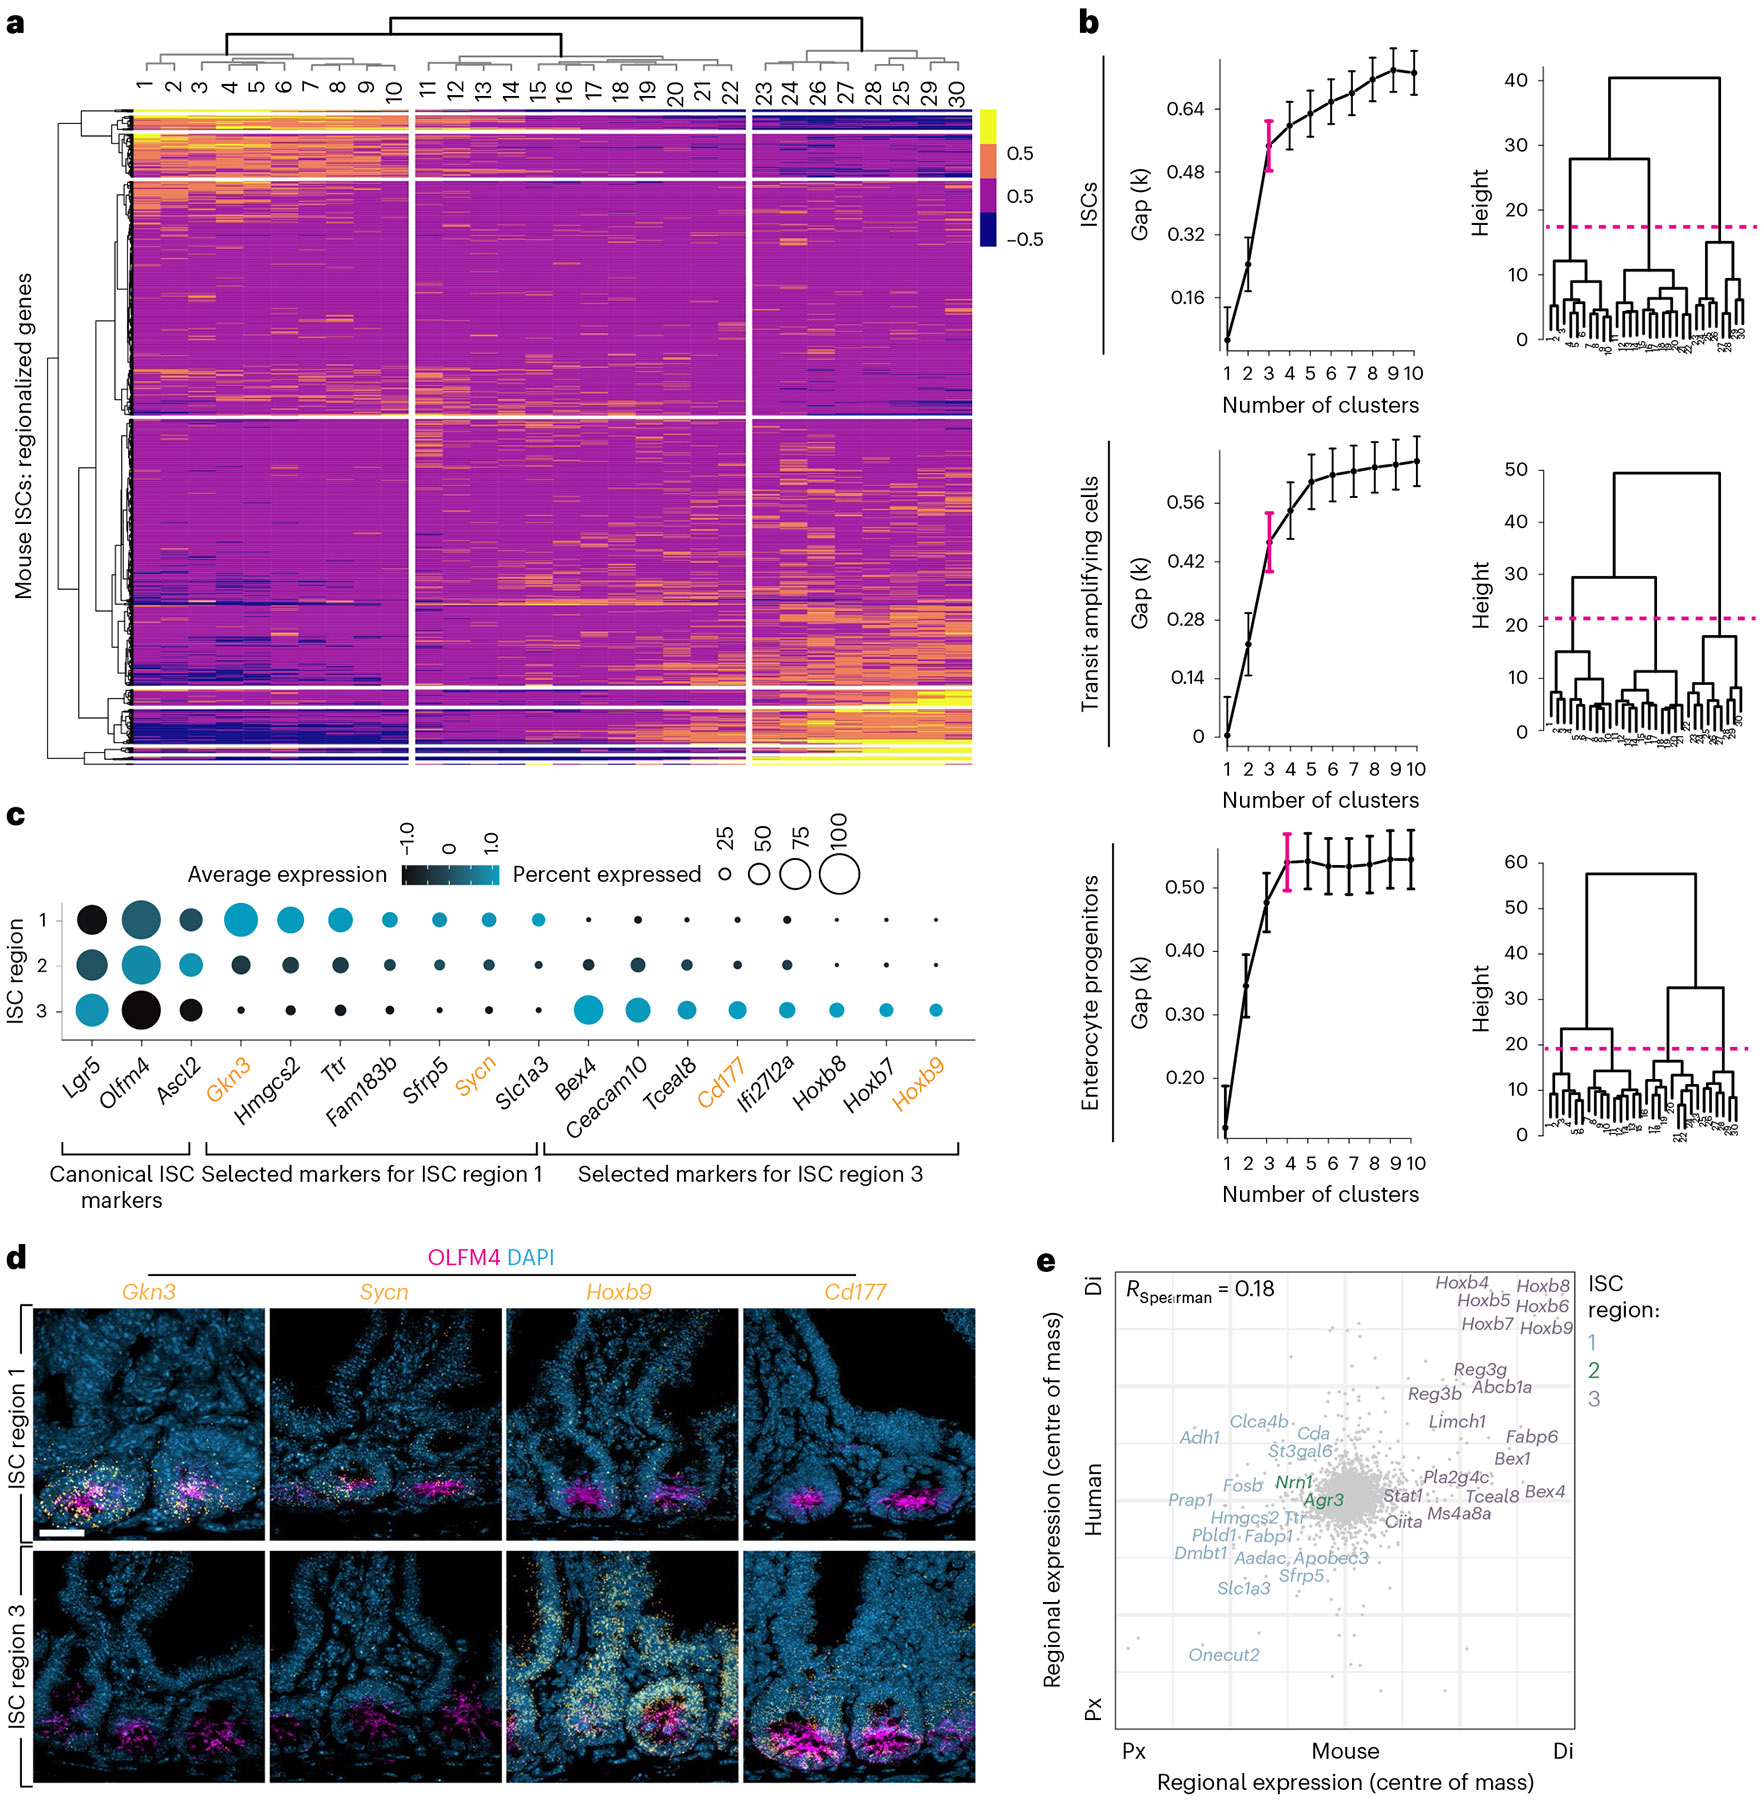
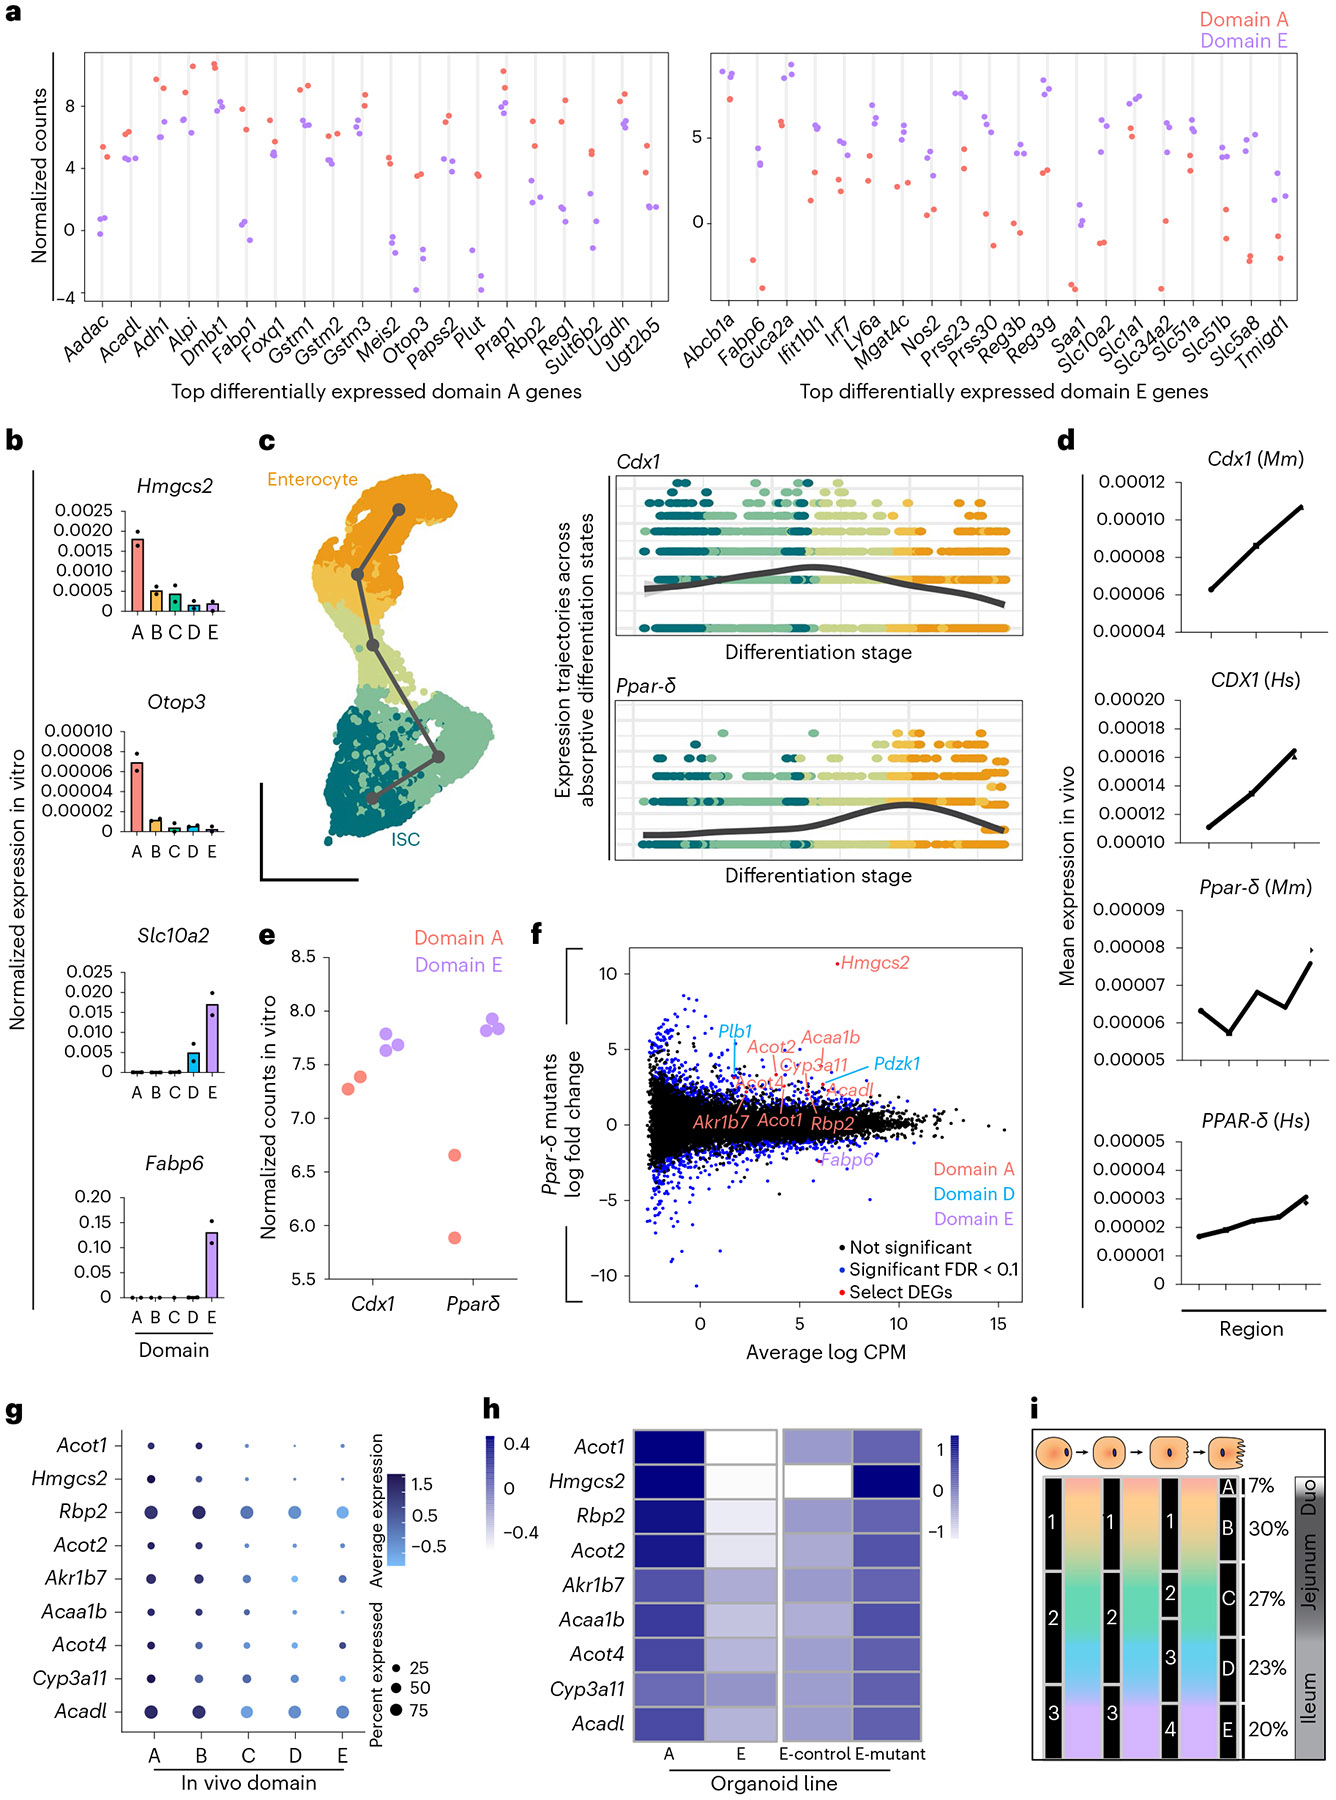
A key aspect of nutrient absorption is the exquisite division of labour across the length of the small intestine, with individual nutrients taken up at different proximal:distal positions. For millennia, the small intestine was thought to comprise three segments with indefinite borders: the duodenum, jejunum and ileum. By examining the fine-scale longitudinal transcriptional patterns that span the mouse and human small intestine, we instead identified five domains of nutrient absorption that mount distinct responses to dietary changes, and three regional stem cell populations. Molecular domain identity can be detected with machine learning, which provides a systematic method to computationally identify intestinal domains in mice. We generated a predictive model of transcriptional control of domain identity and validated the roles of Ppar-δ and Cdx1 in patterning lipid metabolism-associated genes. These findings represent a foundational framework for the zonation of absorption across the mammalian small intestine.


Figures

Extended Data Fig. 1 |
Extended Data Fig. 1 |. Quality control and initial processing of mouse scRNA-seq data.
a,b Quality control metrics of data, including number of genes detected (‘nFeature_RNA’), number of unique molecular identifiers detected (‘nCount_RNA’), and percent mitochondrial reads (‘% mito GE) before (a) and after (b) processing data. c-e UMAP of total murine epithelial cells sequenced post-QC, coloured according to mouse identity (c), cell type annotation (d), or cell cycle phase (e). f Frequency of epithelial cells of indicated subtype by segment. QC, quality control, mito, mitochondrial; GE, gene expression; ISC, intestinal stem cell; TA, transit amplifying; G1, growth 1; G2M, growth 2 mitosis; S, synthesis.
Extended Data Fig. 2 |
Extended Data Fig. 2 |. Quality control and initial processing of human scRNA-seq data from human subject 2.
a,b Quality control metrics of data, including number of genes detected (‘nFeature_RNA’), number of unique molecular identifiers detected (‘nCount_RNA’), and percent mitochondrial reads (‘% mito GE’) before (a) and after (b) processing data. c UMAP of total human cells sequenced post-QC, highlighting cell type annotation. d Frequency of cells of all epithelial subtypes by segment pair. QC, quality control; mito, mitochondrial; GE, gene expression; ISC, intestinal stem cell; TA, transit amplifying.
Extended Data Fig. 3 |
Extended Data Fig. 3 |. Zonation across multiple axes of the small intestine.
a UMAP of absorptive lineage cells coloured by segment number along the proximal to distal axis in mouse and human donors. Major epithelial cell types are labeled. b-e Villus zonation across murine enterocytes. b UMAP plots coloured according to summed expression of previously reported landmarks of the villus tip (left) or base of villus (right). An equal number of enterocytes were assigned to each of 6 crypt:villus zones, zones 1–6. c UMAP plots coloured according to the expression of select top and bottom villus markers. d UMAP plots coloured according to villus zonation scores (left) compared to segment positions (right). Villus zonation scores represent the ratio of the summed expression of bottom and top landmark genes. e Expression of select villus zonation markers across crypt:villus zones. Center lines represent zone mean, and are coloured by domain with surrounding grey standard error bands. M-, microfold.
Extended Data Fig. 4 |
Extended Data Fig. 4 |. Stability and features of five domains across the mouse and human small intestine.
a Right: Average expression of the top 150 upregulated genes in enterocytes from human donor 1 in each segment, with segment order and hierarchical clustering based on expression distance between segments. Vertical white lines show the five domains that divide the small intestine, based on (center) gap statistics for hierarchical clusters of enterocytes in regional gene expression distance. Data bars are presented as mean values +/− confidence interval, based on all cells within the sample. Right: Cuts of dendrogram with optimal cluster number (magenta bracket, center). b Most highly regionalized genes expressed by enterocytes in mouse and donor 2 as in Fig. 1f,g but with a smaller number of genes displayed (75–100), as indicated on the y-axis. c Jensen-Shannon Divergence between enterocytes from segment pairs across the intestine of each individual mouse, with segment pair order and hierarchical clustering based on divergence values between segments. d Murine villus height by domain, presented as mean values +/− standard error of mean. Villus base to tip distances were measured for 3–5 villi in each segment, for each of 4 mice. Statistical significance was calculated using one-way ANOVA followed by Tukey’s multiple comparisons test for villus heights across all segments in each domain. *P < 0.05, ****P < 0.0001, ns not significant. e Domain-defining gene expression scores for human donor 1, as in Fig. 2c,d, coloured by domain with surrounding grey standard error bounds, across intestinal segments. Positions of domain boundaries calculated in b are noted with dotted lines and brackets. f Expression of key domain marker genes in mouse enterocytes across segments. The segment positions of each domain designation are indicated (bottom).
Extended Data Fig. 5 |
Extended Data Fig. 5 |. Single-molecule ISH validation of additional domain markers.
a,b Full-length murine intestinal tissue coiled from the proximal (outside) end to the distal (inside) end, probed with single-molecule ISH for select marker genes of domains as indicated. Channels are shown both individually and merged with pseudocolouring. White boxes indicate insets. Scale bars are 2 mm, and 100 μm for insets. Similar results obtained with 3 mice.
Extended Data Fig. 6 |
Extended Data Fig. 6 |. Domain marker expression in human tissue.
a Single channels of multi-channel images in Fig. 3b. Data are human tissue sections from indicated domains probed using single-molecule ISH with domain marker genes. Scale bars are 100 μm. b Quantification of mean fluorescence per domain for each donor, presented as mean values +/− standard error of mean. n = 3 or 4 donors per domain as indicated by number of datapoints. One-way ANOVA was performed to compare mean fluorescence in each donor by domain, p values for each marker are labeled.
Extended Data Fig. 7 |
Extended Data Fig. 7 |. Functional pathways enriched in domain-associated NMF gene modules in mouse and human.
a,b Selected enriched functional pathways in each NMF gene module displayed in Fig. 2e,f in (a) mouse and (b) human. All gene modules with a regionally variable expression profile across segments that contained genes that encode aspects of nutrient metabolism are displayed (8 modules per species, dotted vertical lines). Module labels (bottom) are the domain(s) most closely-associated with each module, as determined by regional expression profile and rank of key domain-associated signature genes. Pathways were edited to remove redundancy. P values were adjusted for multiple comparisons using the Benjamini-Hochberg procedure.
Extended Data Fig. 8 |
Extended Data Fig. 8 |. Divisions between regional intestinal stem cells (ISCs).
a Jensen-Shannon Divergence between ISCs from segment pairs across the intestine, with segment pair order and hierarchical clustering based on divergence values between segments. Dotted red line indicates level of hierarchical tree of domain divisions. b,c Full-length murine intestinal tissue coiled from the proximal (outside) end to the distal (inside) end, probed with single-molecule ISH for select regional ISC marker genes (as in Fig. 5d) as indicated. Channels are shown both individually and merged with pseudocolouring. White boxes indicate insets. Scale bars are 2 mm, and 100 μm for insets. Similar results obtained with 3 mice. d Expression of regional ISC marker genes in absorptive lineage cells. Dot colour reflects average expression, dot size reflects the percent of cells of each type expressing the marker. 'Mature' and 'progenitor' refer to enterocyte state. e Expression of ISC region 1 genes (Gkn3 and Hmgcs2) and ISC region 3 genes (Bex1 and Hoxb6) across ISCs from 15 segments collected from the small intestines of mice fed chow, high-carbohydrate, or high-fat diets as indicated by colour. (n = 3 mice per diet group). ISC, intestinal stem cell; TA, transit amplifying.
Extended Data Fig. 9 |
Extended Data Fig. 9 |. Top candidate regulators of domain identity.
a,b Domain-wise expression levels of 5 candidate regulators of domain A and B identities (a) and 15 candidate regulators of domain D and E identities (b), identified using ChEA3 and SCENIC analyses. c,d Expression trajectories of indicated factors, coloured according to inferred differentiation stage in Fig. 6c. Transcription factor expression trajectories were plotted for cells in domain E. Plots are grouped according to expression by early-lineage cells (c) or differentiated cells (d).
Extended Data Fig. 10 |
Extended Data Fig. 10 |. Generation and analysis of Ppar-δ and Cdx1 mutant domain E organoids.
a, b Schematics of CRISPR/Cas9 gene targeting strategy. Cas9 endonuclease was encoded in an endogenous genomic locus and 4-hydroxytamoxifen-induced (strategy 1) or delivered by lentiviral vector (strategy 2). Target-specific sgRNAs were delivered by lentiviral vectors (strategies 1 and 2) to induce mutations in the protein coding regions of the target genes. Following mutagenesis, selected clones were expanded and genotyped. Clones containing exclusively deleterious alleles were used for downstream analysis. c Cdx1 mutant organoid sequences from CRISPR editing strategy 1 (‘batch 1’, n = 1 mutant line from mouse 1) and 2 (‘batch 2’, n = 3 unique mutant lines from mouse 2), and Ppar-δ mutant organoid sequences from editing strategy 1 (‘batch 1’, n = 2 unique mutant lines from mouse 1) and 2 (‘batch 2’, n = 3 unique mutant lines from mouse 2). Indel mutations are specified. d Trend towards decreased expression of Fabp6 in Cdx1 mutant lines in both batches of mRNAseq expression data from editing strategies 1 and 2, which could not be merged. Line represents median. e Expression of differentially expressed genes in individual Ppar-δ mutant organoid lines from batch 1 mutants (red dots) and control organoid lines (black dots). Batch 2 expression data of these and other DEGs in Fig. 6f,h. f Normalized mRNA levels of select DEGs of interest in Ppar-δ mutant organoids, validated with real time PCR. (n = 2–4 technical replicates per one control and two mutant organoid lines as indicated). bp, base pair; DEGs, differentially expressed genes.
Fig. 1 |
Fig. 1 |. Five enterocyte groups occupy distinct zones along the length of the SI.
a, scRNA-seq of epithelial cells from 30 equal segments of the mouse (n = 2) and human (n = 2) SI. Cells from each segment were dissociated, tagged with segment-specific barcodes, pooled, sorted into total epithelial and progenitor-enriched samples, and sequenced. Cell number yields following data quality control (QC) are shown. b,c, Uniform manifold approximation and projection (UMAP) of sequenced mouse (b) and human (c) cells following QC, annotated with sample identification (b, left) or predicted cell type. Microfold (M-) cells not displayed; c.f. Extended Data Figs. 2 and 3a. d,e, UMAP of absorptive cells coloured by lengthwise segment number. Insets display reprocessed enterocyte subsets. fi, Average expression of the top 150 upregulated genes in mouse (f) and human (g) enterocytes in each segment, with segment order and hierarchical clustering based on expression distance between segments (h,i). Vertical white lines in f and g show domain delineations, based on h and i, respectively. Left (h,i): gap statistics for hierarchical clusters of enterocytes in regional gene expression distance. Data bars are presented as mean values ± confidence interval, based on all cells within the sample. Right (h,i): cuts of dendrograms with optimal cluster numbers (magenta brackets, left). The five resulting regional enterocyte groups are shaded.
Fig. 2 |
Fig. 2 |. A progression of five distinct gene modules divides intestinal length.
a, Comparison of segment centres of mass for 6,191 homologous genes in mouse and human enterocytes, with mean sum-normalized levels of >1 × 10⁻⁵ in at least one point along intestinal length in both species. RSpearman = 0.29, n = 2 mice and 2 human donors. The top segmentally variable genes in each species are shown, with mouse domain signature genes colour-coded as indicated. Px and Di identify the proximal and distal ends of the mouse (x axis) and human (y axis) SI. b, Expression level by segment of select marker genes of each domain in mouse and human enterocytes. Human genes were domain-enriched in both donors, and representative plots from donor 1 are shown. c,d, Domain-defining gene expression scores for mouse (c) and human donor 2 (d), which represent the mean scaled expression of the top 20 domain-defining genes, coloured by domain, with surrounding grey standard error bounds, across intestinal segments. Segment positions are numbered (x axis), and the positions of domain boundaries calculated in Fig. 1h,i are noted with dotted lines and brackets. e,f, Cumulative expression of regionally variable mouse (e) and human donor 2 (f) NMF gene modules across intestinal segments. Gene modules that encode physiological functions associated with nutrient metabolism are displayed. Module lines are coloured according to the domain A–E they most closely resemble based on regional expression trajectory and signature gene expression. Segment positions are numbered (x axis), and the positions of the domain boundaries calculated in Fig. 1h,i are noted with dotted lines and brackets. NMF, non-negative matrix factorization.
Fig. 3 |
Fig. 3 |. Domain identity can be detected across samples and used for systematic classification of intestinal regions.
a, Full-length murine intestinal tissue coiled from the proximal (P, outside) to distal (D, inside) end, probed with single-molecule multiplexed ISH for select domain marker genes. White boxes mark the insets. Scale bars, 2 mm (main) and 100 μm (insets). Similar results were obtained with three mice. b,c, Images (b) of human tissue sections from the indicated domains, probed as in a for the indicated domain marker genes, and quantification (c) of the mean fluorescence per cell. Representative images and quantification from one donor are displayed. Similar results were obtained from four total donors. dA to dE indicate domains A to E. Scale bars, 100 μm. d,e, Predicted domain identities of enterocytes sequenced in mouse sequencing set two (test dataset, n = 2 mice; (d) and cells previously sequenced in published data (e), as assigned by computational transfer of domain labels from the training dataset. In d, the proportion of cells with the domain predictions at each segment position (x axis) is indicated by line colour, and the dotted vertical lines indicate domain boundaries in the training set in Fig. 1h. In e, the proportions of cells in the reported classic intestinal regions are indicated in each column. Mm, mouse; a.u., arbitrary units.
Fig. 4 |
Fig. 4 |. Domains are associated with distinct aspects of nutrient metabolism.
a, Summary of pathway enrichment in each mouse and human domain, represented as circles coloured according to adjusted P values and sized according to gene ratio (ratio of domain marker genes that are annotated with the pathway term). Selected domain-enriched, nutrient metabolism-associated pathways with adjusted P < 0.02 are shown. P values were adjusted for multiple comparisons using the Benjamini–Hochberg procedure. b, Predicted domain identities of sequenced enterocytes from mice administered a high-fat or high-carbohydrate diet for seven days (n = 3 mice per diet group), as assigned by computational transfer of domain labels from the mouse training dataset. The proportions of cells with the domain predictions in three mice per diet group are indicated by the colour of the best fit lines. Dots are data points from each mouse. Dotted vertical lines indicate domain boundary positions predicted for the chow diet group (top). c, Cumulative expression of regionally variable NMF gene modules associated with nutrient metabolism across intestinal segments in each diet group, indicated by line colour. 95% confidence intervals are indicated with grey bands. d, Expression levels of select genes from the indicated modules associated with lipid metabolism (modules 11 and 9) and carbohydrate absorption (module 6) in mice fed high-fat (purple) or high-carbohydrate (orange) diets. Similar results were obtained with three mice. Mm, mouse; Hs, human.
Fig. 5 |
Fig. 5 |. Three regional stem cell populations reside within the SI.
a, Average expression of the top 100 upregulated genes in murine ISCs in each segment, with segment order and hierarchical clustering based on expression distance between segments. Vertical white lines mark the three domains that divide the ISC compartment, based on gap statistics. b, Left: gap statistics for clusters of regional gene expression in regional ISCs, transit amplifying cells and enterocyte progenitors. Right: cuts of dendrograms (dashed magenta lines) with optimal cluster numbers (magenta brackets, left) for each cell type. Data bars present mean values ± confidence interval, based on all cells within the sample. c, Selected regional ISC subpopulation marker genes, represented as dots coloured according to the average expression level and sized according to the percent of ISCs expressing the marker. Orange marker labels were validated with ISH (d). d, Intestinal crypts probed with single-molecule ISH for select regional ISC marker genes as indicated. Scale bars, 20 μm. e, Comparison of segment centres of mass for 7,668 homologous genes in mouse and human crypt cells with mean sum-normalized levels >1 × 10⁻⁵ in at least one point along the intestinal length in both species. RSpearman = 0.18, n = 2 mice and two human donors. Top segmentally variable genes in each species are shown, and mouse regional ISC signature genes are colour-coded as indicated. Px and Di identify the proximal and distal ends of the mouse (x axis) and human (y axis) SI.
Fig. 6 |
Fig. 6 |. Transcriptional control of enterocyte regional identity.
a, mRNA levels of the top 20 domain A (left) and domain E (right) signature genes most highly differentially expressed in domain A- (n = 2 lines) or E-derived organoids (n = 3 lines), respectively, evaluated with mRNA-seq. Organoid lines represent biological replicates and were assessed 5–6 days after passaging in long-term (>5 week) culture. b, qPCR confirmation of selected domain A (Hmgcs2, Otop3) and domain E (Slc10a2, Fabp6) signature genes in domain A- (n = 2 lines) and E-derived (n = 2 lines) organoids, respectively. c, UMAP of murine absorptive cells (left) and expression trajectories of Cdx1 and Ppar-δ (right), in which all domain E cells are coloured according to inferred differentiation stage. d, Expression profiles of Cdx1 in crypts across ISC regions (Mm) or equal thirds of intestinal length (Hs), and Ppar-δ in enterocytes across domains (Mm) or equal fifths of intestinal length (Hs). Data are presented as mean expression levels of cells in each position from mouse scRNA-seq data (as in Fig. 1a). e, mRNA levels of Cdx1 and Ppar-δ in domain A- or E-derived organoids, as in a. f, Mean-difference plot of expression in Ppar-δ mutant organoids relative to controls. Dot colours are specified. Regionally variable differentially expressed genes that encode lipid metabolism are labelled and coloured by domain. n = 3 unique Ppar-δ mutant organoid lines and two control lines. g, Dotplot of in vivo expression levels of the domain A signature Ppar-δ mutant DEGs labelled in f. Dot size represents percent expressing enterocytes, and colour intensity represents average expression. DEG, differentially expressed gene. h, Heatmap showing mRNA levels of the domain A lipid metabolism signature in domain A- and E-derived organoids as in a, and in control and Ppar-δ knockout domain E organoids as in f. i, Summary of regional specialization of the SI. Within the absorptive lineage (schematized, top), we find three regional ISC populations, predicted to give rise to three TA cell populations, which produce four enterocyte progenitors that specialize into five mature enterocyte types that occupy absorption domains A–E. The estimated proportion of the intestinal length of each domain and our approximation of the corresponding traditional intestinal regions (gradient colours) are shown. Mm, mouse; Hs, human.

Update of

Similar articles

Cited by

References

    1. San Roman AK & Shivdasani RA Boundaries, junctions and transitions in the gastrointestinal tract. Exp. Cell. Res 317, 2711–2718 (2011). - PMC - PubMed
    1. Brown H & Esterhazy D Intestinal immune compartmentalization: implications of tissue specific determinants in health and disease. Mucosal Immunol. 14, 1259–1270 (2021). - PubMed
    1. Esterhazy D. et al. Compartmentalized gut lymph node drainage dictates adaptive immune responses. Nature 569, 126–130 (2019). - PMC - PubMed
    1. Altmann GG & Leblond CP Factors influencing villus size in the small intestine of adult rats as revealed by transposition of intestinal segments. Am. J. Anat 127, 15–36 (1970). - PubMed
    1. Bates MD et al. Novel genes and functional relationships in the adult mouse gastrointestinal tract identified by microarray analysis. Gastroenterology 122, 1467–1482 (2002). - PubMed