. 2024 Mar;30(3):670-674.
doi: 10.1038/s41591-024-02798-x. Epub 2024 Feb 6.

Severe disease during both primary and secondary dengue virus infections in pediatric populations

Affiliations

Severe disease during both primary and secondary dengue virus infections in pediatric populations

Charu Aggarwal et al. Nat Med. 2024 Mar.

Abstract

Dengue is a global epidemic causing over 100 million cases annually. The clinical symptoms range from mild fever to severe hemorrhage and shock, including some fatalities. The current paradigm is that these severe dengue cases occur mostly during secondary infections due to antibody-dependent enhancement after infection with a different dengue virus serotype. India has the highest dengue burden worldwide, but little is known about disease severity and its association with primary and secondary dengue infections. To address this issue, we examined 619 children with febrile dengue-confirmed infection from three hospitals in different regions of India. We classified primary and secondary infections based on IgM:IgG ratios using a dengue-specific enzyme-linked immunosorbent assay according to the World Health Organization guidelines. We found that primary dengue infections accounted for more than half of total clinical cases (344 of 619), severe dengue cases (112 of 202) and fatalities (5 of 7). Consistent with the classification based on binding antibody data, dengue neutralizing antibody titers were also significantly lower in primary infections compared to secondary infections (P ≤ 0.0001). Our findings question the currently widely held belief that severe dengue is associated predominantly with secondary infections and emphasizes the importance of developing vaccines or treatments to protect dengue-naive populations.


Conflict of interest statement

Competing interests

The authors declare no competing interests.

Figures
Extended Data Fig. 1
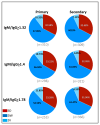
Extended Data Fig. 1. Similar frequency of severe disease in primary versus secondary cases that were distinguished using stringent IgM/IgG ratios.
Pie charts show the frequency of Severe Dengue (SD), Dengue with warning signs (DW) and Dengue infection without warning signs (DI) cases in primary versus secondary dengue infections that were distinguished using more stringent IgM/IgG ratios indicated on left. The number of patients in each group is indicated below the pie chart. For all three classification methods, the proportion of severe disease was not significantly different between primary and secondary cases (p > 0.78, two-sided Fisher’s exact test). The 95% confidence interval for the percentages indicated in the pie charts are as below: IgM/IgG >1.32, primary: DI- 5.4-11.6, DW-53.4-64.4, SD-27.9-38.5, Secondary: DI- 6.7-13.1, DW-52.8-63.6, SD-27.4-37.6; IgM/IgG >1.4: primary: DI- 5.7-12.1, DW-52.2-63.5, SD-28.5-39.3, secondary: DI- 6.4-12.6, DW-53.8-64.4, SD-26.9-36.9; IgM/IgG >1.78: primary: DI- 5.8-13.0, DW-50.5-62.9, SD-28.7-40.6 and secondary: DI- 6.3-12.0, DW-54.8-64.6, SD-27.0-36.3 (Wilson CI).
Extended Data Fig. 2
Extended Data Fig. 2. Frequency of severe disease in primary versus secondary dengue infections using WHO 1997 and WHO 2009 disease classification.
Data from a subset of the patients from the AIIMS Delhi site where disease severity was classified using both WHO 2009 and WHO 1997 criteria. a, Data shown by WHO 1997 disease classification. Pie charts show the frequency of the cases with dengue shock syndrome (DSS), dengue hemorrhagic fever (DHF); or dengue fever (DF) among a subset of dengue confirmed children that are recruited from AIIMS site among all cases (n = 171), primary dengue cases (n = 66) and secondary dengue cases (n = 105). DSS case frequency is not significantly different between the primary and secondary dengue infections, (p = 0.106, two-sided Fisher’s exact test). b, Data shown by WHO 2009 disease classification among the same group of the patients from panel a. Pie charts show the frequency of the cases with severe dengue (SD), dengue with warning signs (DW); or dengue infection without warning signs (DI) among all cases, primary dengue cases or secondary dengue cases. Severe dengue case frequency was not significantly different between the primary and secondary dengue infections, (p = 0.344, two-sided Fisher’s exact test).
Extended Data Fig. 3
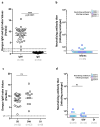
Extended Data Fig. 3. Dengue specific responses in infants (≤1-year-old).
a, Scatter plot shows dengue specific IgM and IgG index values by capture Elisa (Panbio) for dengue confirmed infants (n = 34). p values were calculated using two-sided Mann-Whitney U tests b, Neutralizing antibody titers to the indicated infecting virus serotype in dengue confirmed infants where the infecting serotype was determined (n = 26). c. Scatter plots show dengue specific IgM index values by Panbio Capture ELISA among the infants with different grades of disease severity. Severe dengue (SD, n = 22); Dengue with warning signs (DW, n = 12). Note that there are no Dengue infection without warning signs (DI) cases since all the hospitalized infants were either SD or DW cases. p values (p = 0.087) were calculated using two-sided Mann-Whitney U tests. Non-significant p values (>0.05) are indicated as n.s. d. Scatter plots show neutralizing activity against the indicated infecting dengue virus serotypes among the infants with different grades of disease severity. Severe dengue (SD, n = 15); Dengue with warning signs (DW, n = 11). Note that there are no DI cases since all of the hospitalized infants were either SD or DW cases. p values (p > 0.999) were calculated using two- sided Mann-Whitney U tests. Non-significant p values (>0.05) are indicated as n.s.
Extended Data Fig. 4
Extended Data Fig. 4. Neutralization responses were below detection or significantly lower for infecting serotype in the primary dengue cases compared to secondary dengue cases.
Neutralizing antibody titers against the infecting virus serotype in primary (n = 38) and secondary (n = 50) from a subset of the patients from 2b, where the infecting serotype was identified. p values were calculated using Mann-Whitney U test.
Fig. 1
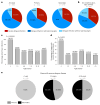
Fig. 1. Similar frequency of severe disease in pediatric patients with primary versus secondary dengue infections.
a, Frequency of severe dengue infection, dengue infection with warning signs or dengue infection without warning signs cases among children with confirmed dengue (all cases, n = 619) and among those classified as primary (n = 344) or secondary (n = 275) dengue infection as described in the Methods. Disease severity was not significantly different between primary and secondary cases (P = 0.53, Fisher’s exact test). Testing the frequency of severe dengue between primary and secondary cases also yielded nonsignificant result (P = 1.0, two-sided Fisher’s exact test). The 95% confidence intervals (CIs) for the percentages are: all cases, dengue infection without warning signs = 6.7–11.2, dengue infection with warning signs = 54.7–62.5, severe dengue infection = 29.1–36.4; primary, dengue infection without warning signs = 6.9–13.2, dengue with warning signs = 52.3–62.7, severe dengue infection = 28.1–38.0; secondary, dengue infection without warning signs = 5.0–11.4, dengue with warning signs = 54.1–65.6, severe dengue infection = 27.1–38.1 (Wilson score interval). b, Pie chart showing severe dengue infection, dengue infection with warning signs and dengue infection without warning signs case frequency among children with primary dengue infection who were recruited on or before day 4 after the onset of symptoms and were below detection for dengue-specific IgG using the Panbio Capture ELISA (n = 126). The 95% CIs for the percentages are: dengue infection without warning signs = 16.2–29.9, dengue infection with warning signs = 36.6–52.9, severe dengue infection = 25.8–41.3; (Wilson score interval). c, Disease severity and incidence of primary and secondary infections as a function of age. The bar graph shows the frequency of primary dengue infections according to age. The number of patients in each age group is indicated in the graph. Infants (1 year old or younger) were all primary infections, which is notably different from the approximately equal mix seen in the older groups (P ≤ 0.00001, two-sided Fisher’s exact test). d, Bar graph showing the frequency of severe disease cases in the different age groups. Patients aged 1 year or younger were more likely to have severe dengue compared to older patients (P ≤ 0.002, two-sided Fisher’s exact test). e, Pie charts showing the frequency of primary versus secondary infections among severe disease cases in the indicated age groups.
Fig. 2
Fig. 2. Comparison of neutralizing antibody responses between cases with primary and secondary dengue infection.
a, Neutralizing antibody titers against each of the four dengue virus serotypes (DENV-1, DENV-2, DENV-3 and DENV-4) in the plasma of a subset of patients from the AIIMS site with primary (n = 41) or secondary (n = 67) dengue infection. P values were calculated using a two-sided Mann–Whitney U-test. b, Breadth of neutralizing antibody response in individual cases with primary (left) and secondary (right) dengue infection from a. Individual patients were stratified from the highest neutralizing titer to any of the four serotypes. The infecting serotype, where known, is indicated by closed symbols. c, Neutralizing antibody titers against the infecting virus serotype and heterologous serotypes in primary (n = 35) and secondary (n = 41) dengue infection from a subset of patients in a, where the infecting serotype was DENV-2. P values were calculated using a two-sided Mann–Whitney U-test.

References

    1. Bhatt S, et al. The global distribution and burden of dengue. Nature. 2013;496:504–507. doi: 10.1038/nature12060. - DOI - PMC - PubMed
    1. World Health Organization. Dengue Guidelines for Diagnosis, Treatment, Prevention and Control. WHO; 2009. - PubMed
    1. Farrar JJ, et al. Dogma in classifying dengue disease. Am J Trop Med Hyg. 2013;89:198–201. doi: 10.4269/ajtmh.13-0157. - DOI - PMC - PubMed
    1. Srikiatkhachorn A, et al. Dengue—how best to classify it. Clin Infect Dis. 2011;53:563–567. - PMC - PubMed
    1. Halstead SB, et al. Dengue hemorrhagic fever in infants: research opportunities ignored. Emerg Infect Dis. 2002;8:1474–1479. doi: 10.3201/eid0812.020170. - DOI - PMC - PubMed

Substances

LinkOut - more resources