

Comparing the gut microbiota of Sichuan golden monkeys across multiple captive and wild settings: roles of anthropogenic activities and host factors
- PMID: 38321370
- PMCID: PMC10848473
- DOI: 10.1186/s12864-024-10041-7
Comparing the gut microbiota of Sichuan golden monkeys across multiple captive and wild settings: roles of anthropogenic activities and host factors
Abstract
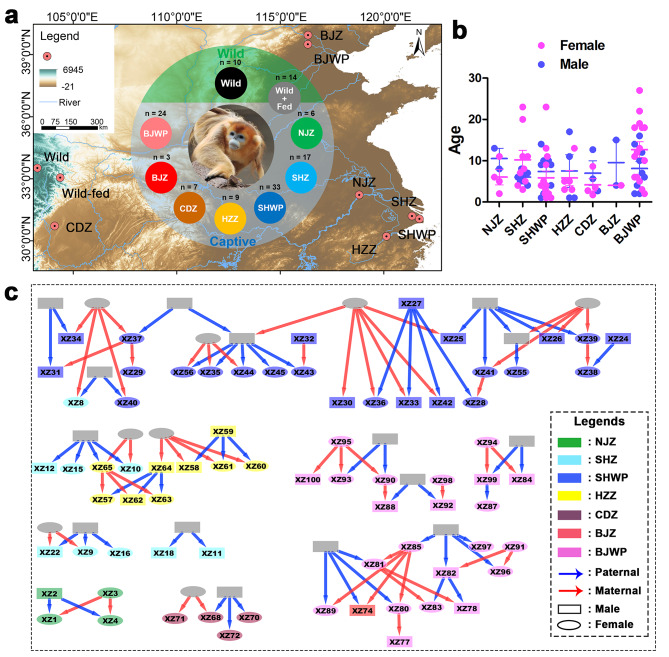
Background: Captivity and artificial food provision are common conservation strategies for the endangered golden snub-nosed monkey (Rhinopithecus roxellana). Anthropogenic activities have been reported to impact the fitness of R. roxellana by altering their gut microbiota, a crucial indicator of animal health. Nevertheless, the degree of divergence in gut microbiota between different anthropogenically-disturbed (AD) R. roxellana and their counterparts in the wild has yet to be elucidated. Here, we conducted a comparative analysis of the gut microbiota across nine populations of R. roxellana spanning China, which included seven captive populations, one wild population, and another wild population subject to artificial food provision.
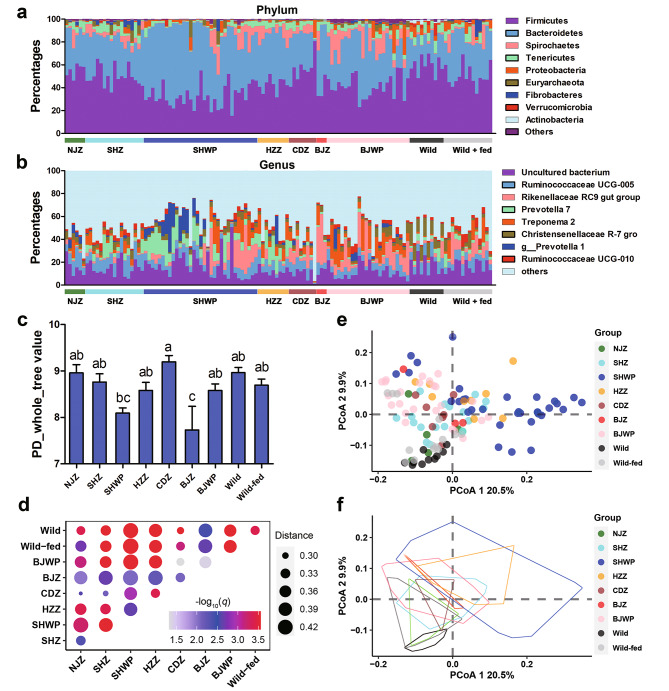
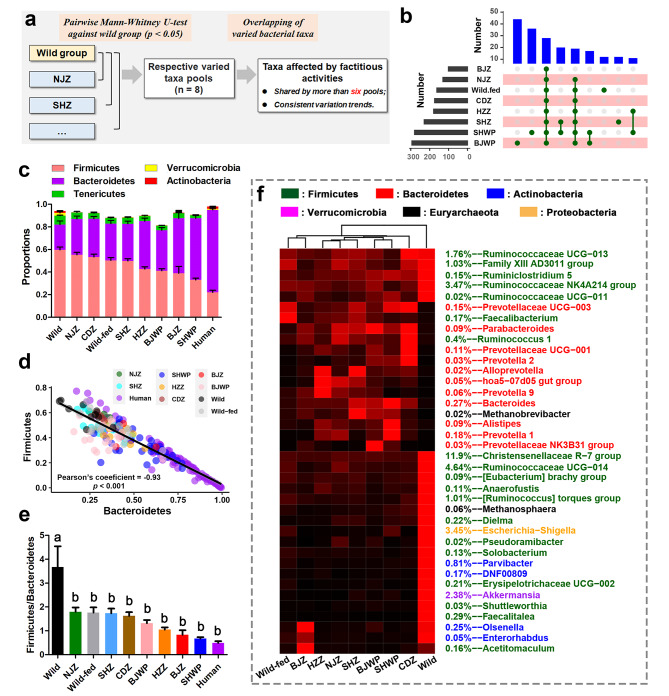
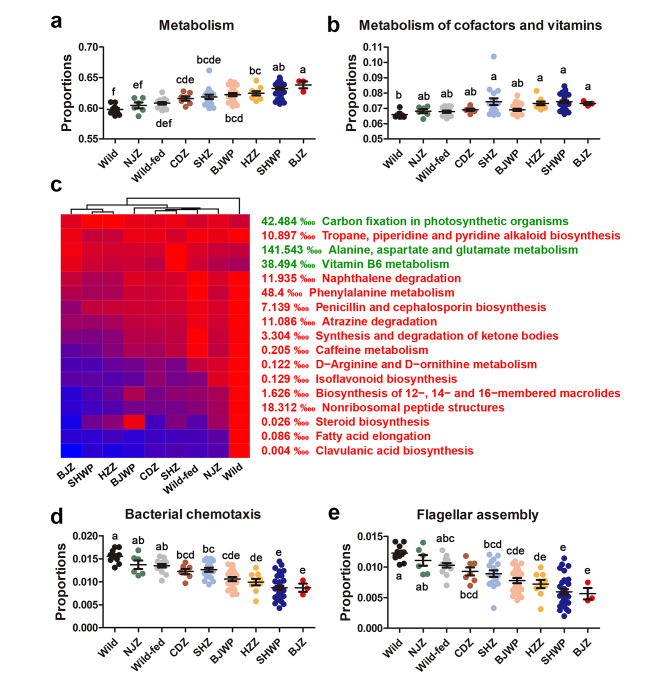
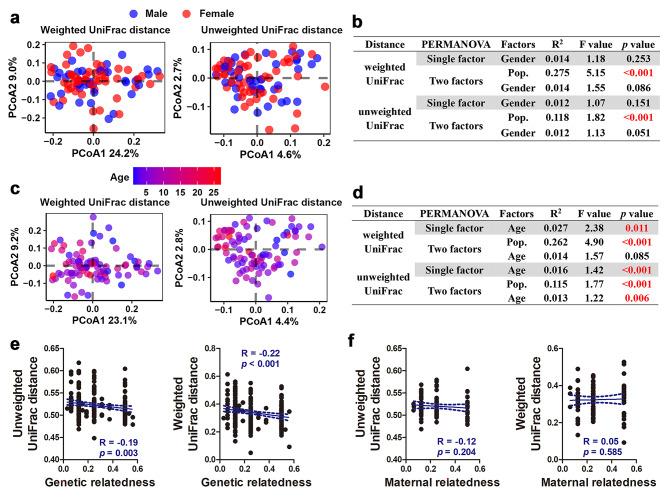
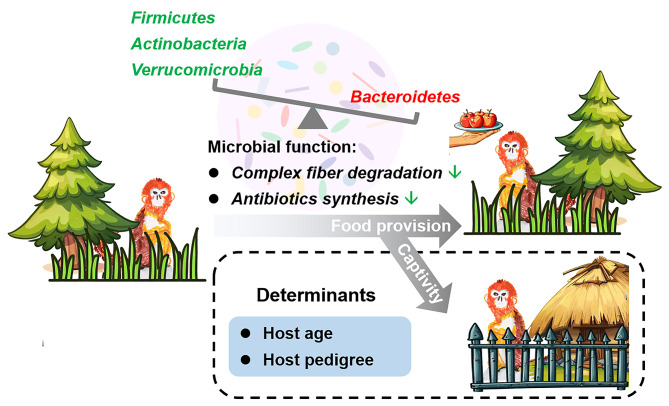
Results: Both captivity and food provision significantly altered the gut microbiota. AD populations exhibited common variations, such as increased Bacteroidetes and decreased Firmicutes (e.g., Ruminococcus), Actinobacteria (e.g., Parvibacter), Verrucomicrobia (e.g., Akkermansia), and Tenericutes. Additionally, a reduced Firmicutes/Bacteroidetes ratiosuggested diminished capacity for complex carbohydrate degradation in captive individuals. The results of microbial functional prediction suggested that AD populations displayed heightened microbial genes linked to vitamin and amino acid metabolism, alongside decreased genes associated antibiotics biosynthesis (e.g., penicillin, cephalosporin, macrolides, and clavulanic acid) and secondary metabolite degradation (e.g., naphthalene and atrazine). These microbial alterations implied potential disparities in the health status between AD and wild individuals. AD populations exhibited varying degrees of microbial changes compared to the wild group, implying that the extent of these variations might serve as a metric for assessing the health status of AD populations. Furthermore, utilizing the individual information of captive individuals, we identified associations between variations in the gut microbiota of R. roxellana and host age, as well as pedigree. Older individuals exhibited higher microbial diversity, while a closer genetic relatedness reflected a more similar gut microbiota.
Conclusions: Our aim was to assess how anthropogenic activities and host factors influence the gut microbiota of R. roxellana. Anthropogenic activities led to consistent changes in gut microbial diversity and function, while host age and genetic relatedness contributed to interindividual variations in the gut microbiota. These findings may contribute to the establishment of health assessment standards and the optimization of breeding conditions for captive R. roxellana populations.
Keywords: Antibiotics; Captivity; Firmicutes/Bacteroidetes; Microbiome; Non-human primate; Pedigree.
© 2024. The Author(s).
Conflict of interest statement
The authors declare that there are no competing financial interests in relation to the work described.
Figures
Similar articles
-
Comparative study of the gut microbiota in three captive Rhinopithecus species.BMC Genomics. 2023 Jul 14;24(1):398. doi: 10.1186/s12864-023-09440-z. BMC Genomics. 2023. PMID: 37452294 Free PMC article.
-
Species variations in the gut microbiota of captive snub-nosed monkeys.Front Endocrinol (Lausanne). 2023 Sep 13;14:1250865. doi: 10.3389/fendo.2023.1250865. eCollection 2023. Front Endocrinol (Lausanne). 2023. PMID: 37780618 Free PMC article.
-
Age-Based Variations in the Gut Microbiome of the Shennongjia (Hubei) Golden Snub-Nosed Monkey (Rhinopithecus roxellana hubeiensis).Biomed Res Int. 2021 Mar 12;2021:6667715. doi: 10.1155/2021/6667715. eCollection 2021. Biomed Res Int. 2021. PMID: 33778078 Free PMC article.
-
Profile of the gut microbiota of adults with obesity: a systematic review.Eur J Clin Nutr. 2020 Sep;74(9):1251-1262. doi: 10.1038/s41430-020-0607-6. Epub 2020 Mar 30. Eur J Clin Nutr. 2020. PMID: 32231226
-
The effects of time-restricted eating and Ramadan fasting on gut microbiota composition: a systematic review of human and animal studies.Nutr Rev. 2024 May 10;82(6):777-793. doi: 10.1093/nutrit/nuad093. Nutr Rev. 2024. PMID: 37528052 Free PMC article.
Cited by
-
Comparative Analysis of Gut Microbiota Between Wild and Captive Guizhou Snub-Nosed Monkey (Rhinopithecus brelichi).Ecol Evol. 2024 Dec 10;14(12):e70690. doi: 10.1002/ece3.70690. eCollection 2024 Dec. Ecol Evol. 2024. PMID: 39664719 Free PMC article.
-
What Can the Gut Microbiota of Animals Teach Us about the Relationship between Nutrition and Burden of Lifestyle Diseases?Nutrients. 2024 Jun 6;16(11):1789. doi: 10.3390/nu16111789. Nutrients. 2024. PMID: 38892721 Free PMC article. Review.
-
Gut microbiota alterations in golden snub-nosed monkeys during food shortage and parturition-nursing periods.Front Microbiol. 2025 Feb 27;16:1556648. doi: 10.3389/fmicb.2025.1556648. eCollection 2025. Front Microbiol. 2025. PMID: 40083783 Free PMC article.
-
Prevalence and diversity of Helicobacter species in captive wild carnivores, and their implications for conservation management of endangered species.BMC Vet Res. 2025 Jul 29;21(1):498. doi: 10.1186/s12917-025-04886-7. BMC Vet Res. 2025. PMID: 40731010 Free PMC article.
-
A combined treatment regimen for Trichuris rhinopiptheroxella infection in Rhinopithecus roxellana in southern China.Int J Parasitol Parasites Wildl. 2025 Jan 3;26:101036. doi: 10.1016/j.ijppaw.2025.101036. eCollection 2025 Apr. Int J Parasitol Parasites Wildl. 2025. PMID: 39867133 Free PMC article.
References
-
- Long Y, Richardson M. Rhinopithecus roxellana. The IUCN Red List of Threatened Species 2020, e.T1959A17943886:10.2305/IUCN.UK2020-2302.RLTS.T1959A17943886.en.
-
- Zeng Y. Host gastrointestinal tract, living environment and diet explain the gut microbiota of Rhinopithecus roxellana Chengdu. Sichuan Agriculture University; 2020.
-
- Yu Z, Xia Q, Fan X. Fertility and management of a captive population of golden monkey. Chin J Wildl. 2018;39(4):801–5.
-
- Wang J, Wang Q, Zeng D, Liu L-l, Jian P, Zhang Y, Ni X. Comparison of fecal microbiota from healthy and diarrhea Rhinopithecus roxellana. Chin J Veterinary Sci. 2015;2015(8):1232–8.
MeSH terms
Supplementary concepts
Grants and funding
LinkOut - more resources
Full Text Sources
