. 2024 Mar 21;52(5):2519-2529.
doi: 10.1093/nar/gkae063.

The origin of different bending stiffness between double-stranded RNA and DNA revealed by magnetic tweezers and simulations

Affiliations

The origin of different bending stiffness between double-stranded RNA and DNA revealed by magnetic tweezers and simulations

Hai-Long Dong et al. Nucleic Acids Res. .

Abstract

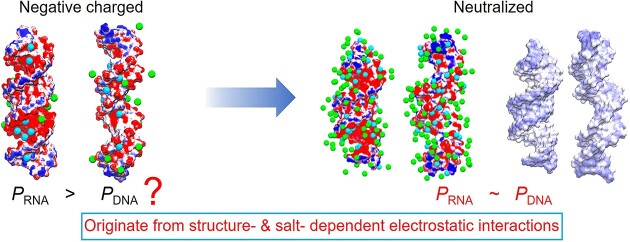
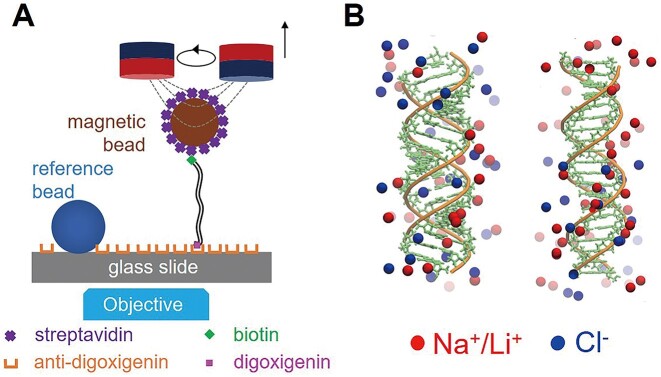
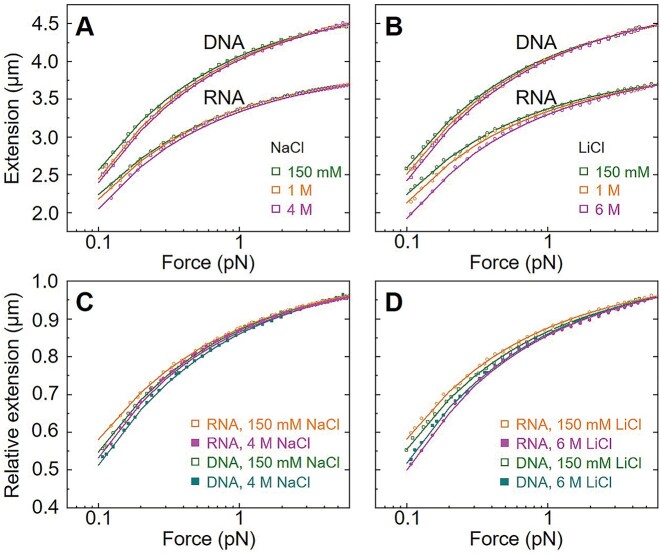
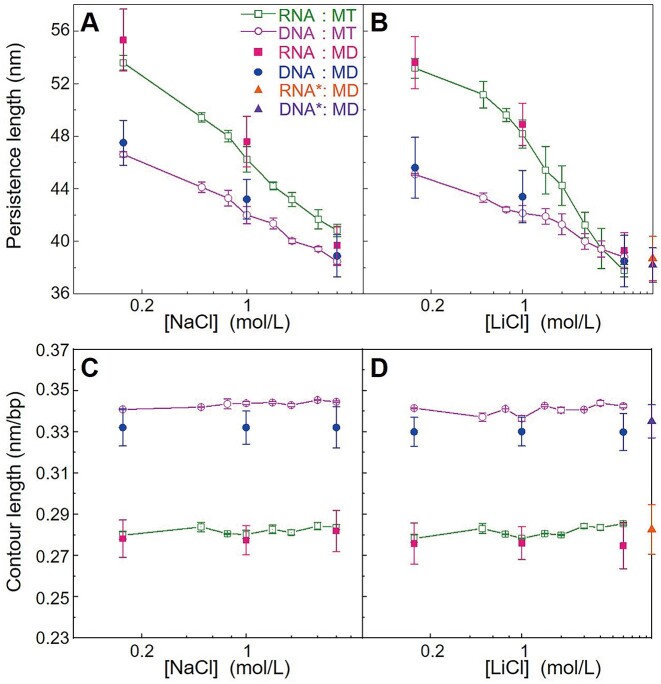
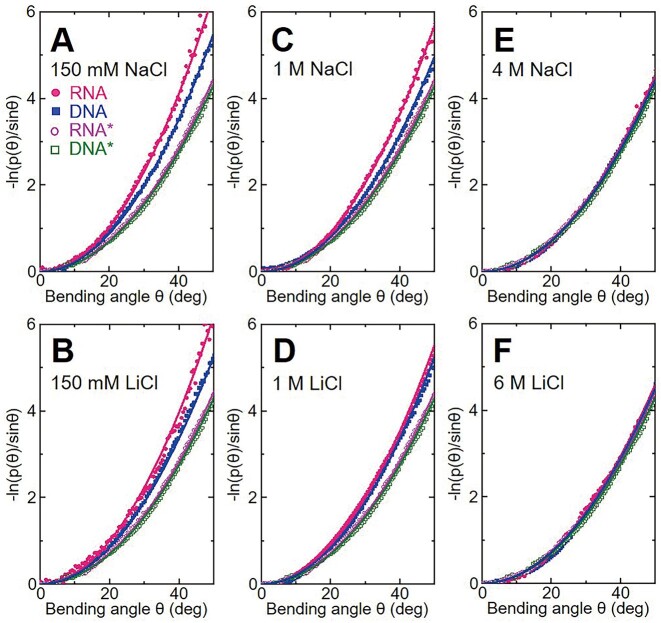
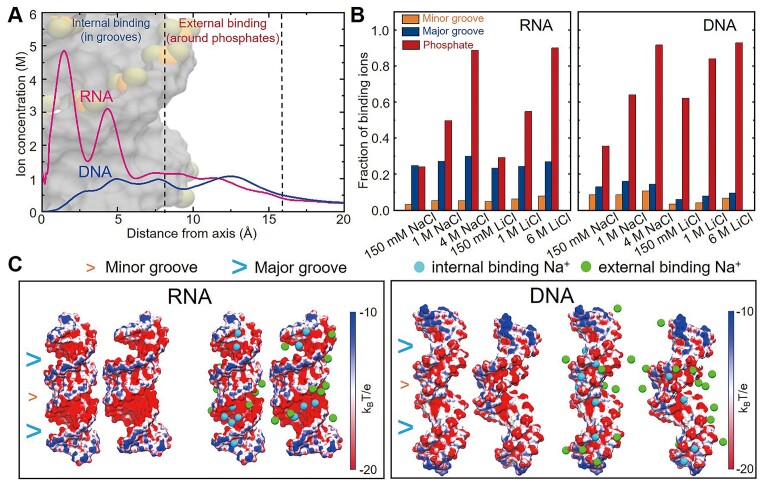
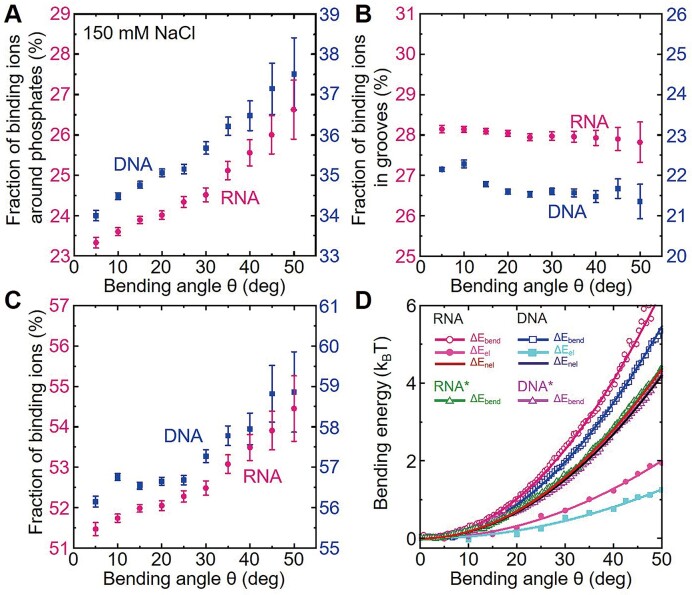
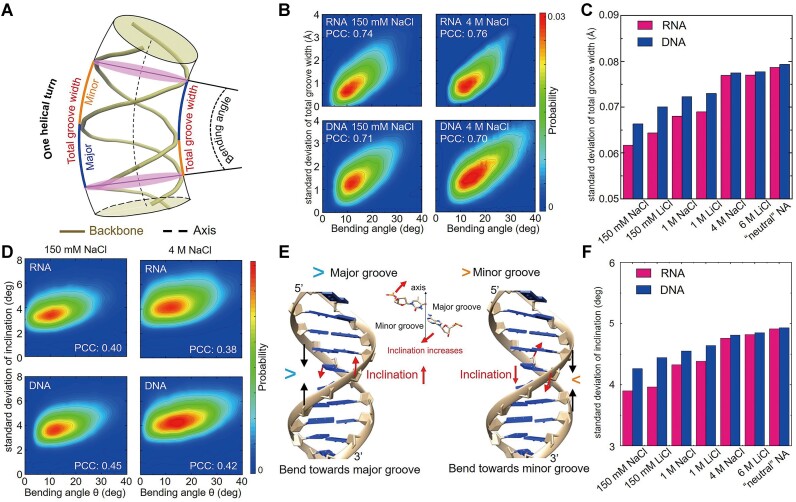
The subtle differences in the chemical structures of double-stranded (ds) RNA and DNA lead to significant variations in their biological roles and medical implications, largely due to their distinct biophysical properties, such as bending stiffness. Although it is well known that A-form dsRNA is stiffer than B-form dsDNA under physiological salt conditions, the underlying cause of this difference remains unclear. In this study, we employ high-precision magnetic-tweezer experiments along with molecular dynamics simulations and reveal that the relative bending stiffness between dsRNA and dsDNA is primarily determined by the structure- and salt-concentration-dependent ion distribution around their helical structures. At near-physiological salt conditions, dsRNA shows a sparser ion distribution surrounding its phosphate groups compared to dsDNA, causing its greater stiffness. However, at very high monovalent salt concentrations, phosphate groups in both dsRNA and dsDNA become fully neutralized by excess ions, resulting in a similar intrinsic bending persistence length of approximately 39 nm. This similarity in intrinsic bending stiffness of dsRNA and dsDNA is coupled to the analogous fluctuations in their total groove widths and further coupled to the similar fluctuation of base-pair inclination, despite their distinct A-form and B-form helical structures.


Figures

Graphical Abstract
Graphical Abstract
Figure 1.
Figure 1.
Our MT experiments and MD simulations to determine the elasticities of dsDNA and dsRNA. (A) The home-built magnetic tweezer. A pair of NdFeB magnets are used to stretch the molecule anchored between a glass slide and a microbead. (B) The initial structures of 20-bp dsRNA (left) and dsDNA (right) used in our MD simulations with added Na+/Li+ (red) and Cl (blue) ions.
Figure 2.
Figure 2.
Effects of ion concentration on the force-extension curves of the dsDNA and dsRNA from the MT measurements. (A) Representative F-x curves of dsRNA and dsDNA at typical NaCl concentrations. (B) Representative F-x curves of dsRNA and dsDNA at typical LiCl concentrations. (C) Representative relative F-x curves of dsDNA and dsRNA at typical NaCl solutions. (D) Representative relative F-x curves of dsDNA and dsRNA at typical LiCl solutions. Each F–x curve is fitted to Eq. (1) (solid line), yielding bending persistence length P and contour length Lc.
Figure 3.
Figure 3.
The persistence lengths of dsRNA and dsDNA are different at moderate salts but similar at very high salts with constant contour lengths. (A) The persistence length P as a function of NaCl concentrations. (B) The persistence length P as a function of LiCl concentrations. (C) The contour length Lc as a function of NaCl concentrations. (D) The contour length Lc as a function of LiCl concentrations. RNA* and DNA* denote the electrically ‘neutral’ dsRNA and dsDNA. The error bars denote the standard deviations around the mean values from the MT measurements using at least ten molecules or the values of four equal intervals in our MD trajectories.
Figure 4.
Figure 4.
The bending angle distributions of dsDNA and dsRNA are different at moderate salts but similar at very high salts. The bending angle distributions p(θ) versus bending angle θ over a given length Lc of the dsRNA and dsDNA. RNA* and DNA* denote the electrically ‘neutral’ dsRNA and dsDNA. Here, for convenience, the segments with 13-bp dsRNA and 11-bp dsDNA, which have a similar contour length of ∼3.3 nm, were used in our calculations for dsRNA and dsDNA, respectively. The bending persistence length P of dsRNA and dsDNA can be calculated by fitting p(θ) according to Eq. (2).
Figure 5.
Figure 5.
Fractions of binding ions around phosphates for dsRNA and dsDNA are different at moderate salts but similar at very high salts. (A) The radial concentration distributions of Na+ around the dsRNA and dsDNA obtained from our MD simulations (17,49). At a large radial distance, the Na+ concentrations converge to the desired concentration of 150 mM. (B) The charge fractions of binding cations (over anions) per nucleotide from our MD simulations at different ion conditions for dsRNA (left) and dsDNA (right). Please see Supplementary Table S4 for the details. (C) Representative straight and bent structures and their ion distributions of dsRNA (left) and dsDNA (right) showing the surface electrostatic potentials at 150 mM NaCl by the PB solver of APBS (70).
Figure 6.
Figure 6.
Ion binding around phosphates plays a major role in dsRNA and dsDNA bending. (A) Average charge fractions of (externally) binding ions around phosphates for dsRNA (red) and dsDNA (blue) as functions of bending angle. (B) Average charge fractions of (internally) binding ions in grooves for dsRNA (red) and dsDNA (blue) as functions of bending angle. (C) Average charge fractions of total binding ions for dsRNA (red) and dsDNA (blue) as functions of bending angle. (D) The bending energy ΔEbend, electrostatic bending energy ΔEel, and non-electrostatic bending energy ΔEnel versus bending angle θ of dsRNA and dsDNA. ΔEbend was calculated by Eq. (3); ΔEel was calculated by the APBS for the MD conformations (70); ΔEnel was calculated by Eq. (5) with the shown fitted lines for ΔEbend and ΔEel.
Figure 7.
Figure 7.
Different fluctuations of the total groove widths around axis and base-pair inclinations are the origin of the different bending stiffness of dsDNA and dsRNA at physiological monovalent salts. (A) An illustration of the axial grooves of a dsRNA or dsDNA. (B) The relationships between the standard deviation of the total groove width and bending angle θ at 150 mM and 4 M NaCl for dsRNA and dsDNA, where PCCs stand for the Pearson correlation coefficients; please see Supplementary Figure S17 for those at other salts. (C) The standard deviation of the axial total groove width per unit contour length at different ionic conditions, and the ‘neutral’ NA stands for the electrically ‘neutral’ dsRNA* and dsDNA*. (D) The relationships between the standard deviation of inclination and bending angle θ at 150 mM and 4 M NaCl for dsRNA and dsDNA, where PCCs stand for the Pearson correlation coefficients; please see Supplementary Figure S18 for the PCCs at other salts. (E) An illustration for that bending towards major groove and towards minor groove would lead to an increase and a decrease in inclination, respectively; see Supplementary Figure S20 for the relationships between base-pair inclination and bending angle for bending towards major grooves or minor grooves (79). (F) The standard deviation of inclination at different ionic conditions, and the ‘neutral’ NA stands for the electrically ‘neutral’ dsRNA* and dsDNA*.

Similar articles

Cited by

References

    1. Gee P., Lung M.S.Y., Okuzaki Y., Sasakawa N., Iguchi T., Makita Y., Hozumi H., Miura Y., Yang L.F., Iwasaki M. et al. . Extracellular nanovesicles for packaging of CRISPR-Cas9 protein and sgRNA to induce therapeutic exon skipping. Nat. Commun. 2020; 11:1334. - PMC - PubMed
    1. Lebrun A., Shakked Z., Lavery R. Local DNA stretching mimics the distortion caused by the TATA box-binding protein. Proc. Natl. Acad. Sci. U.S.A. 1997; 94:2993–2998. - PMC - PubMed
    1. Zhao X., Guo S., Lu C., Chen J., Le S., Fu H., Yan J. Single-molecule manipulation quantification of site-specific DNA binding. Curr. Opin. Chem. Biol. 2019; 53:106–117. - PubMed
    1. Peters J.P., Maher L.J. DNA curvature and flexibility in vitro and in vivo. Q. Rev. Biophys. 2010; 43:23–63. - PMC - PubMed
    1. Dietz H., Douglas S.M., Shih W.M. Folding DNA into twisted and curved nanoscale shapes. Science. 2009; 325:725–730. - PMC - PubMed