. 2024 Jan 23:11:1278968.
doi: 10.3389/fcell.2023.1278968. eCollection 2023.

Endothelial anthrax toxin receptor 2 plays a protective role in liver fibrosis

Affiliations

Endothelial anthrax toxin receptor 2 plays a protective role in liver fibrosis

Xiaojuan Huang et al. Front Cell Dev Biol. .

Abstract

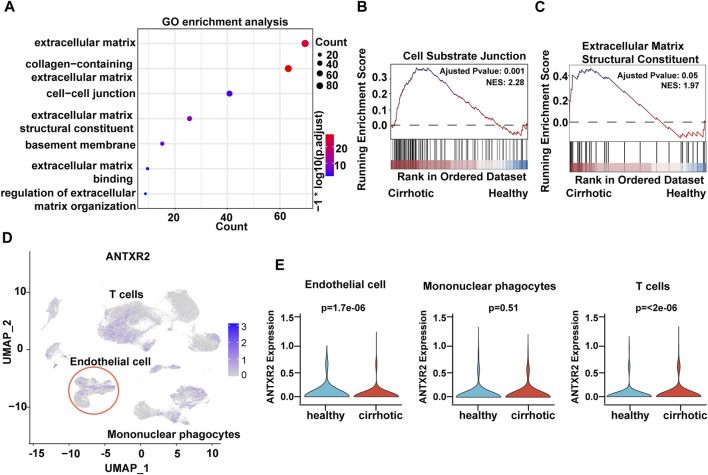
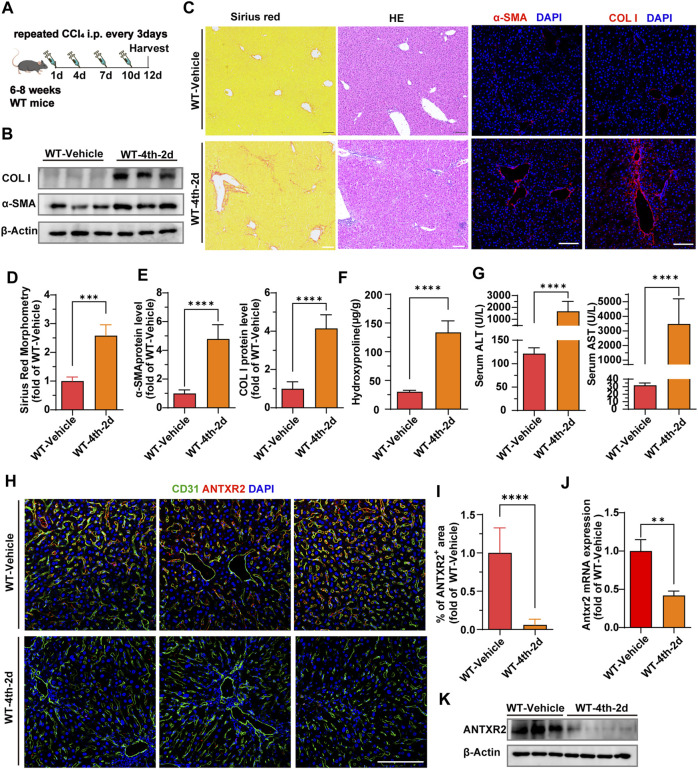
Hepatocellular carcinoma is one of the leading cancers worldwide and is a potential consequence of fibrosis. Therefore, the identification of key cellular and molecular mechanisms involved in liver fibrosis is an important goal for the development of new strategies to control liver-related diseases. Here, single-cell RNA sequencing data (GSE136103 and GES181483) of clinical liver non-parenchymal cells were analyzed to identify cellular and molecular mechanisms of liver fibrosis. The proportion of endothelial subpopulations in cirrhotic livers was significantly higher than that in healthy livers. Gene ontology and gene set enrichment analysis of differentially expressed genes in the endothelial subgroups revealed that extracellular matrix (ECM)-related pathways were significantly enriched. Since anthrax toxin receptor 2 (ANTXR2) interacts with the ECM, the expression of ANTXR2 in the liver endothelium was analyzed. ANTXR2 expression in the liver endothelium of wild-type (WT) mice significantly decreased after a 4-time sequential injection of carbon tetrachloride (CCl4) to induce liver fibrosis. Next, conditional knockout mice selectively lacking Antxr2 in endothelial cells were generated. After endothelial-specific Antxr2 knockout mice were subjected to the CCl4 model, the degree of liver fibrosis in the knockout group was significantly more severe than that in the control group. In addition, ANTXR2 in human umbilical vein endothelial cells promoted matrix metalloproteinase 2 (MMP2) activation to degrade the ECM in vitro. Finally, endothelial-specific overexpression of Antxr2 alleviated the development of liver fibrosis following adeno-associated virus treatment. Collectively, these results suggested that endothelial ANTXR2 plays a protective role in liver fibrosis. This function of ANTXR2 may be achieved by promoting MMP2 activation to degrade the ECM.

Keywords: ANTXR2; MMP2; endothelial cells; extracellular matrix; liver fibrosis.


Conflict of interest statement

The authors declare that the research was conducted in the absence of any commercial or financial relationships that could be construed as a potential conflict of interest.

Figures

FIGURE 1
FIGURE 1
The endothelial ratio of non-parenchymal cells (NPCs) in fibrotic liver is increased. (A) Clustering of 71,164 cells from 6 healthy and 5 cirrhotic human livers. (B) Cell types are annotated and split into two groups. Cell lineage is inferred from expression of marker gene signatures. ILC, innate lymphoid cell; MP, mononuclear phagocyte. (C) Heatmap of cluster marker genes, exemplar genes (right), and lineage annotation (bottom). Columns represent cells and rows represent genes. (D) Volcano plot depicting differences in cell type abundance in the cirrhotic group compared to that of the healthy group. Fold change (log2) is plotted against p-value (−log10) based on a Student’s t-test. (E) Distribution of cell types in human liver samples from healthy and cirrhotic groups.
FIGURE 2
FIGURE 2
Decreased expression of anthrax toxin receptor 2 (Antxr2) in human cirrhotic liver endothelial cells. (A) Gene ontology (GO) enrichment analysis of differentially expressed genes (DEGs) between cirrhotic and healthy endothelial cells. (B, C) Gene set enrichment analysis (GSEA) analysis of DEGs in cirrhotic and healthy endothelial cells. The basement membrane and extracellular matrix structural constituent pathways are shown. (D) UMAP visualization of ANTXR2 expression in non-parenchymal cells. (E) Violin plot showed ANTXR2 expression in endothelial cells, mononuclear phagocytes and T cells from healthy and cirrhotic human livers.
FIGURE 3
FIGURE 3
Decreased expression of anthrax toxin receptor 2 (Antxr2) in mice fibrosis liver endothelial cells. (A) Sequential injection of carbon tetrachloride (CCl4) to induce chronic liver injury in wild-type mice (WT). WT mice aged 6–8 weeks were intraperitoneally injected with 40% CCl4 every 3 days for 4-time consecutive injection, with samples harvested on the second day after the last injection (WT-4th-2d). The WT-vehicle group was intraperitoneally injected with oil (n = 6 animals per group). (B–E) Fibrotic responses in WT mice after fibrosis modeling. Levels of α-smooth muscle actin (α-SMA) and collagen I (B,C, E), Sirius red staining (C, D), and hematoxylin and eosin (H, E) staining (C) are measured to assess the degree of liver fibrosis (n = 6 animals per group). Scale bar = 100 μm. (F) Amounts of hydroxyproline in indicated mice (n = 5–10 animals per group). (G) Levels of serum alanine aminotransferase (ALT) and aspartate aminotransferase (AST) in WT-4th-2d group and WT-Vehicle group mice. (n = 9–10 animals per group). (H) Co-staining of endothelial marker CD31 (green) and ANTXR2 (red) in the liver of indicated mice groups. Scale bar = 100 μm. (I) Quantification of the area of the ANTXR2+ region in indicated mice. (n = 7 animals per group). (J, K) Antxr2 mRNA and protein expression in liver endothelial cells (ECs, CD45CD31+) from WT mice after fibrosis modeling (n = 3–6 animals per group). Student’s t-test was employed to determine significant differences. The results of all bar graphs are expressed as mean ± S.D. p < 0.01**, p < 0.001***; p < 0.0001****.
FIGURE 4
FIGURE 4
Liver fibrosis increases in endothelium-specific anthrax toxin receptor 2 (Antxr2) knockout mice after fibrosis modeling. (A, B) Generation of inducible endothelial cell (EC)-specific deletion of Antxr2 in adult mice. Floxed Antxr2 (Antxr2 loxP/loxP) mice are crossed with Cdh5-CreERT2 mice carrying tamoxifen response-Cre driven by an EC-specific Cdh5/vascular endothelial (VE)-cadherin promoter. To induce EC-specific genetic deletion of Antxr2, at approximately 6–8 weeks of age Antxr2 loxP/loxP mice and VE-cadherin-CreERT2 Antxr2 loxP/loxP mice are intraperitoneally treated with tamoxifen at a dose of 150 mg/kg for 6 days interrupted for 3 days after the third dose. Then, Antxr2 iΔEC/iΔEC mice and age-matched littermate mice undergo carbon tetrachloride (CCl4) liver injury modeling. (C) Inducible knockout efficiency of Antxr2 in liver ECs of Antxr2 iΔEC/iΔEC mice is quantified in sorted CD45CD31+ ECs using quantitative polymerase chain reaction (qPCR) (n = 3 animals per group). (D–G) Fibrotic responses in Antxr2 iΔEC/iΔEC and Antxr2 loxP/loxP mice after fibrosis modeling. Levels of α-smooth muscle actin (α-SMA) and collagen I (D, E, G), Sirius red staining (E), quantification of Sirius red staining (F) and hematoxylin and eosin (HE) staining (E) are measured to assess the degree of liver fibrosis (n = 7 animals per group). Scale bar = 100 μm. (H) Amounts of hydroxyproline in Antxr2 iΔEC/iΔEC and Antxr2 loxP/loxP mice after fibrosis modeling (n = 5–6 animals per group). (I) Levels of serum alanine aminotransferase (ALT), aspartate aminotransferase (AST), and alkaline phosphatase (ALP) in indicated mice (n = 5–6 animals per group). (J) mRNA expression levels of fibrosis-related genes in Antxr2 iΔEC/iΔEC and Antxr2 loxP/loxP mice after fibrosis modeling. (n = 6 animals per group). Student’s t-test was employed to determine significant differences. The results of all bar graphs are expressed as mean ± S.D. p < 0.05*; p < 0.01**, p < 0.001***.
FIGURE 5
FIGURE 5
Anthrax toxin receptor 2 (ANTXR2) promotes matrix metalloproteinase 2 (MMP2) activation to degrade the extracellular matrix (ECM). (A) Dot plots showing the percentage of CD45 CD31+ cell in primary human umbilical vein endothelial cells (HUVECs) as determined by flow cytometry. (B, C) Knockout efficiency of ANTXR2 in HUVECs using short hairpin RNA (shRNA) (shANTXR2) as quantified using quantitative polymerase chain reaction (qPCR) and immunoblotting (B, C). NC stands for negative control. Levels of activated MMP2 detected through western blot (C). I stands for inactive MMP2 and A stands for active MMP2 (n = 3 per group). Statistical analysis of difference is performed with one-way ANOVA and Tukey’s test as post hoc analysis. Data are shown as mean ± S.D. p < 0.0001****. (D) Schematic of the zymography assay. First, after seeding the same number of HUVECs into a well plate, the cells are cultured for 24 h. Then, the serum-free medium is replaced and the cells are cultured for another 17 h before the supernatant is collected. The collected supernatant is centrifuged at 300 g for 3 min to remove cellular debris, and then it is concentrated using a 3 kDa ultrafiltration tube by centrifugation at 4,000 g for 60 min. Finally, the concentrated samples are used to detect MMP2 activity. (E) Zymography analysis of serum-free conditioned media from HUVECs in indicated group. The upper panel shows a low contrast image and is aimed to show the protein marker molecule size. The selected area of the red box was adjusted to high contrast and presented in the lower panel, in order to show the changes in activated MMP2 levels more clearly. The left column is labeled with protein marker molecule sizes (kDa). (F,G) Overexpression efficiency of ANTXR2 in HUVECs (OE-ANTXR2), as quantified by qPCR and western blot (F, G). Levels of activated MMP2 have been detected using the same methods (G). (n = 3 per group). Student’s t-test is employed to determine significant differences. Data are expressed as mean ± S.D. p < 0.0001****. (H) Zymography analysis of serum-free conditioned media from HUVECs in OE-ANTXR2 and controls. The upper panel shows low contrast and the bottom shows high contrast, as in Figure 5E. The left column is labeled with protein marker molecule sizes (kDa).
FIGURE 6
FIGURE 6
The endothelial-specific overexpression of anthrax toxin receptor 2 (ANTXR2) is induced by splenic injection of adeno-associated virus (AAV-Antxr2-OE). (A) Schematic of the treatment of endothelium-specific AAV-Antxr2-OE through trans-splenic injection. To induce selective overexpression of Antxr2 in liver endothelial cells (ECs), AAV encoding EC-selective Tie1-driven Antxr2 (AAV-Antxr2-OE) is injected into mouse liver via the spleen. After 21 days of AAV-Tie1-Antxr2 injection, Antxr2 is specifically overexpressed in the liver endothelium of mice. AAV-NC is the negative control, which is the blank control group. After 14 days of AAV injection, mice are subjected to 40% carbon tetrachloride (CCl4) through intraperitoneal injection every 3 days. Samples are harvested on the second day after the 4th consecutive CCl4 injection. (B–E) Endothelial-specific overexpression of Antxr2 was verified at the mRNA (B, C) and protein (D) levels by qPCR and western blot. Quantification of ANTXR2 protein level in endothelial cells and hepatocytes by densitometric analysis (E). (n = 3–9 animals per group). Student’s t-test is employed to determine significant differences. Data are shown as mean ± S.D. **p < 0.01, ns = no significant difference. (F) AAV-green fluorescent protein (GFP, green) expression is co-stained with CD31 (white) in the liver sections from mice after AAV-Antxr2-OE or AAV-NC injection. Scale bar = 50 μm.
FIGURE 7
FIGURE 7
Specific overexpression of Antxr2 in ECs by adeno-associated virus (AAV-Antxr2-OE) treatment significantly improved liver fibrosis (A–D) Wild-type (WT) mice are subjected to fibrosis modeling, which improves fibrosis after AAV-Antxr2-OE treatment. Levels of α-smooth muscle actin (α-SMA), collagen I (A,B, D), and Sirius red staining (B, C) are measured to assess the degree of liver fibrosis. Hematoxylin and esosin (HE) staining (B) is used to observe the structure and morphology of tissues in described mice. Scale bar = 100 μm. (n = 4-6 animals per group). (E) Amounts of hydroxyproline in indicated mice (n = 8 animals per group). (F) Bar graph shows fibrosis-related genes mRNA expression level in AAV-NC group and AAV-Antxr2-OE group mice after fibrosis modeling (n = 6 animals per group). (G) Levels of serum alanine aminotransferase (ALT), aspartate aminotransferase (AST), and alkaline phosphatase (ALP) in indicated mice. (n = 7–9 animals per group). (H, I) A correlation analysis between the quantitative analysis of endothelial expression of Antxr2 and collagen I in described mice (n = 7–13 animals per group). p < 0.05 is significant. R = −0.9350 indicates a strong negative correlation. Student’s t-test is employed to determine significant differences. Data are shown as mean ± S.D. p < 0.05*, p < 0.01**. p < 0.001***.
FIGURE 8
FIGURE 8
Anthrax toxin receptor 2 may function as a switch in liver fibrosis.Anthrax toxin receptor 2 (ANTXR2) expression in endothelial cells promotes the conversion of matrix metalloproteinase 2 (MMP2) from the zymogen form to the active form and degrades the extracellular matrix. Endothelium-specific overexpression of Antxr2 in liver after adeno-associated virus treatment may alleviate the development of liver fibrosis.

Similar articles

References

    1. Asrani S. K., Devarbhavi H., Eaton J., Kamath P. S. (2019). Burden of liver diseases in the world. J. Hepatology 70 (1), 151–171. 10.1016/j.jhep.2018.09.014 - DOI - PubMed
    1. Augustin H. G., Kozian D. H., Johnson R. C. (1994). Differentiation of endothelial cells: analysis of the constitutive and activated endothelial cell phenotypes. BioEssays 16 (12), 901–906. 10.1002/bies.950161208 - DOI - PubMed
    1. Bataller R., Brenner D. A. (2005). Liver fibrosis. J. Clin. Investigation 115 (2), 209–218. 10.1172/JCI24282 - DOI - PMC - PubMed
    1. Bell S. E., Mavila A., Salazar R., Bayless K. J., Kanagala S., Maxwell S. A., et al. (2001). Differential gene expression during capillary morphogenesis in 3D collagen matrices: regulated expression of genes involved in basement membrane matrix assembly, cell cycle progression, cellular differentiation and G-protein signaling. J. Cell Sci. 114 (15), 2755–2773. 10.1242/jcs.114.15.2755 - DOI - PubMed
    1. Bonnans C., Chou J., Werb Z. (2014). Remodelling the extracellular matrix in development and disease. Nat. Rev. Mol. Cell Biol. 15 (12), 786–801. 10.1038/nrm3904 - DOI - PMC - PubMed