

Artemether regulates liver glycogen and lipid utilization through mitochondrial pyruvate oxidation in db/db mice
- PMID: 38322550
- PMCID: PMC10839377
- DOI: 10.62347/NEAS4467
Artemether regulates liver glycogen and lipid utilization through mitochondrial pyruvate oxidation in db/db mice
Abstract
Objectives: Diabetes is an important global health problem. The occurrence and development of type 2 diabetes (T2D) involves multiple organs, among which the liver is an important organ. Artemether is a methyl ether derivative of artemisinin and has displayed significant antidiabetic effects. However, its regulation of glucose metabolism is not clearly elucidated. This study explored the effect of artemether on liver mitochondrial pyruvate metabolism.
Methods: T2D db/db mice were used and grouped into db/db and db/db+Art groups. Lean wild type mice served as control. After artemether intervention for 12 weeks, the respiratory exchange ratio (RER), redox state, relevant serum lipid content, liver glycogen and lipid content, liver insulin and insulin-like growth factor 1 (IGF-1) signal transduction, mitochondrial pyruvate oxidation pathway, fatty acid and glycogen metabolic pathways were evaluated.
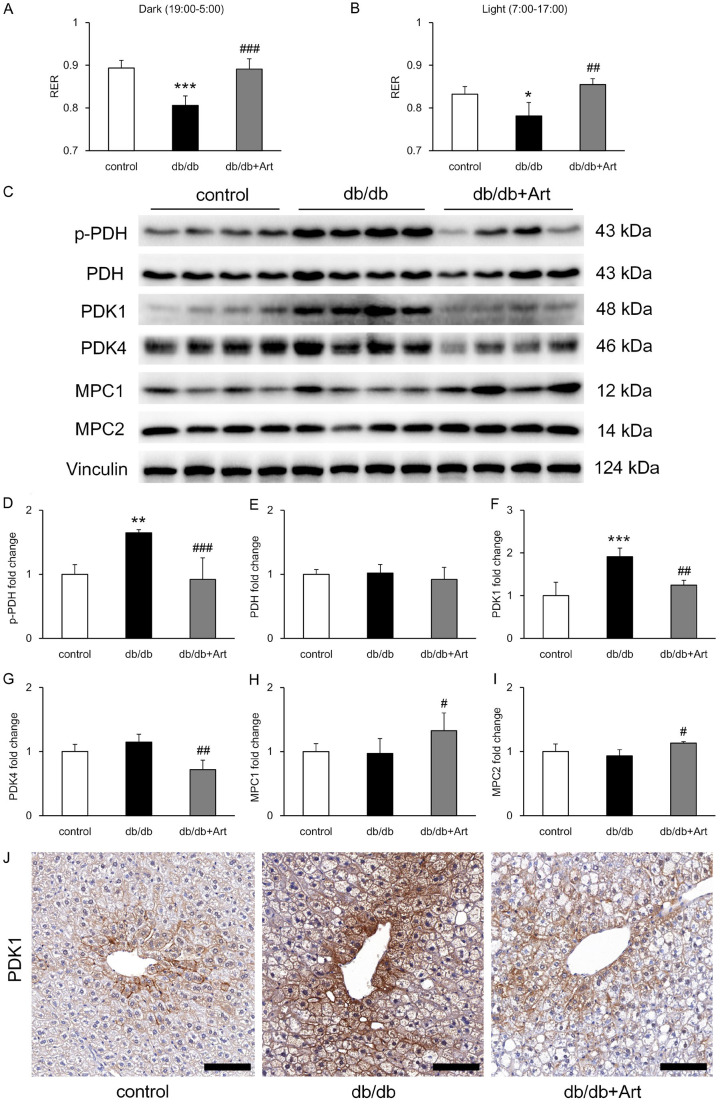
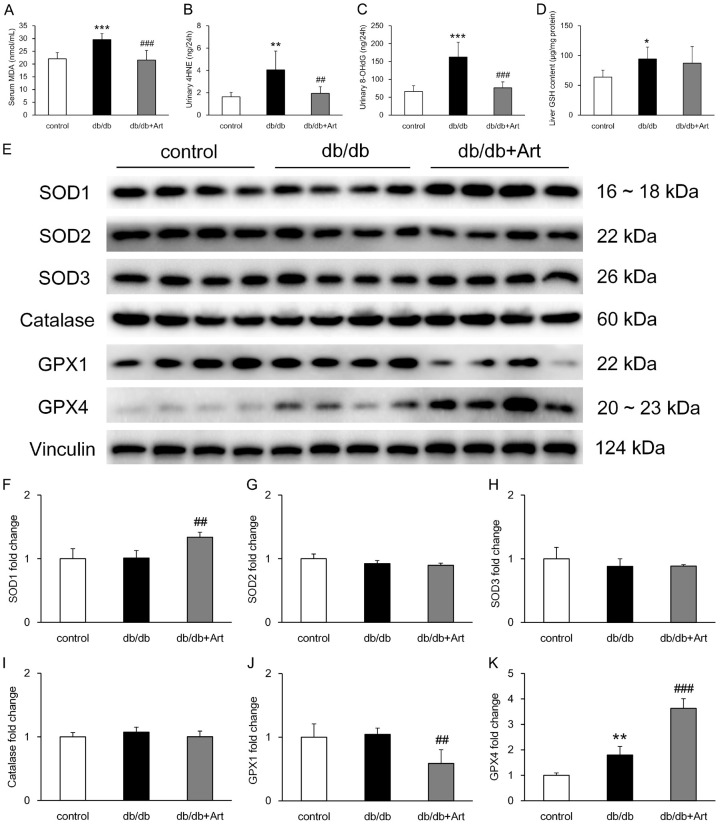
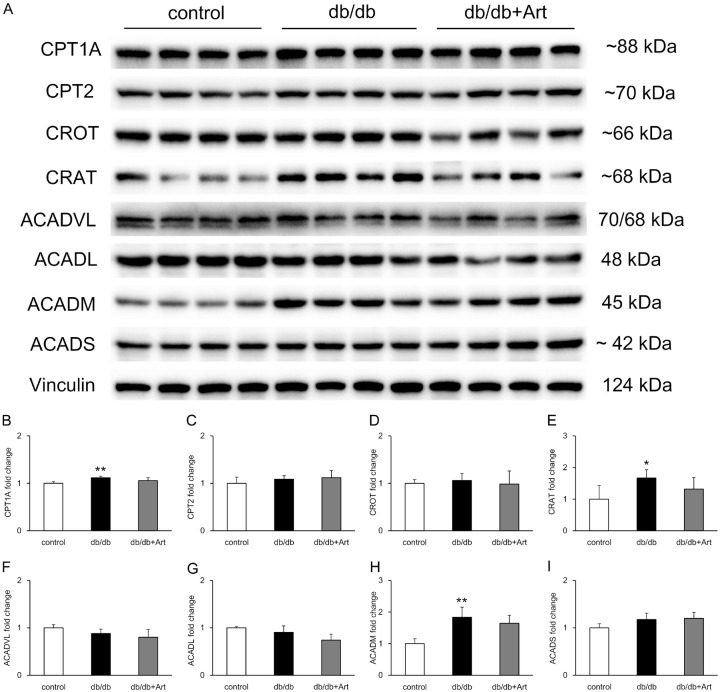
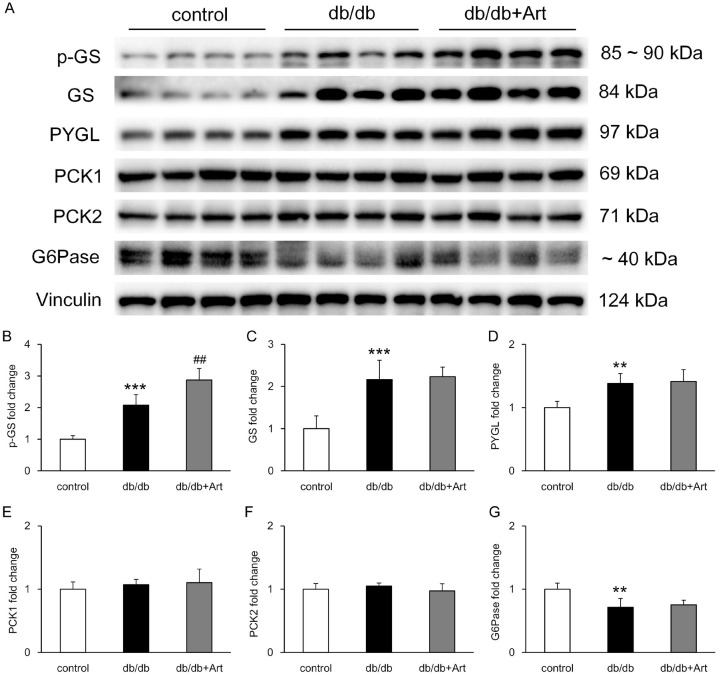
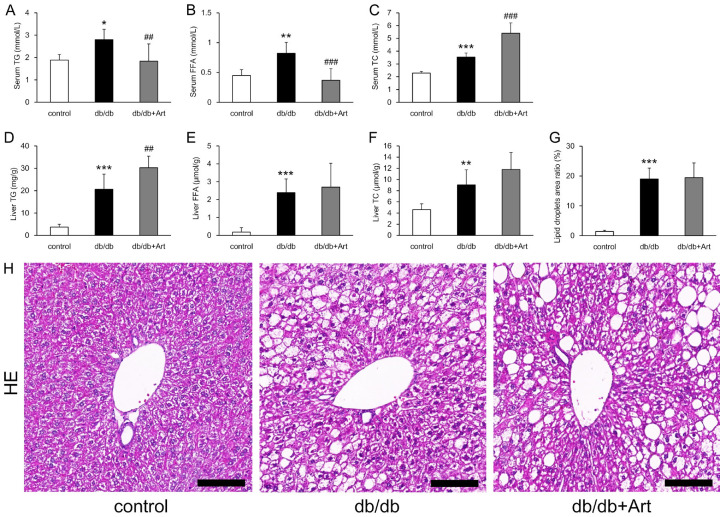
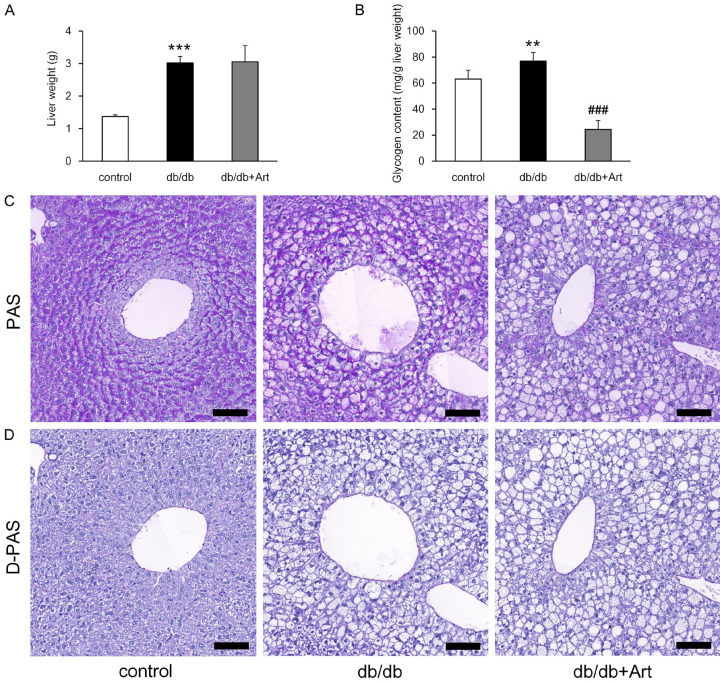
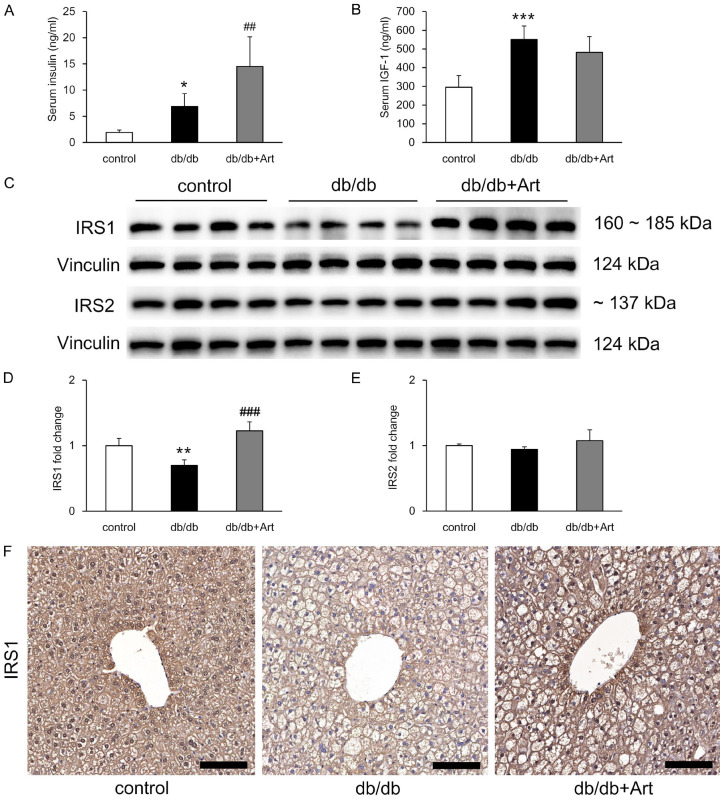
Results: This experiment demonstrated that artemether raised RER and enhanced liver mitochondrial pyruvate metabolism in db/db mice. Artemether also reduced serum and urinary lipid peroxidation products and regulated the redox status in liver. The accumulation of liver glycogen in diabetic mice was attenuated, the proportion of lipid content in serum and liver was changed by artemether. The signal pathway associated with liver glycogen metabolism was also regulated by artemether. In addition, artemether increased serum insulin and regulated insulin/IGF-1 signal pathway in liver.
Conclusions: The present study confirmed that artemether can regulate liver glycogen and lipid utilization in T2D mice, its biological mechanisms were associated with mitochondrial pyruvate oxidation in the liver.
Keywords: Artemether; glycogen; lipid; liver; pyruvate.
AJTR Copyright © 2024.
Conflict of interest statement
None.
Figures
Similar articles
-
Artemether ameliorates type 2 diabetic kidney disease by increasing mitochondrial pyruvate carrier content in db/db mice.Am J Transl Res. 2019 Mar 15;11(3):1389-1402. eCollection 2019. Am J Transl Res. 2019. PMID: 30972169 Free PMC article.
-
Antidiabetic Effect of Artemether in Db/Db Mice Involves Regulation of AMPK and PI3K/Akt Pathways.Front Endocrinol (Lausanne). 2020 Sep 25;11:568864. doi: 10.3389/fendo.2020.568864. eCollection 2020. Front Endocrinol (Lausanne). 2020. PMID: 33101203 Free PMC article.
-
Artemether Regulates Metaflammation to Improve Glycolipid Metabolism in db/db Mice.Diabetes Metab Syndr Obes. 2020 May 19;13:1703-1713. doi: 10.2147/DMSO.S240786. eCollection 2020. Diabetes Metab Syndr Obes. 2020. PMID: 32547132 Free PMC article.
-
Antidiabetic and Antiobesity Effects of Artemether in db/db Mice.Biomed Res Int. 2018 May 13;2018:8639523. doi: 10.1155/2018/8639523. eCollection 2018. Biomed Res Int. 2018. PMID: 29862294 Free PMC article.
-
Hepatic glycogen metabolism in the db/db mouse.Mol Cell Biochem. 1990 Feb 9;92(2):99-106. doi: 10.1007/BF00218127. Mol Cell Biochem. 1990. PMID: 2407941 Review.
Cited by
-
Exploring the glucose-lowering and anti-inflammatory immune mechanism of artemether by AMPK/mTOR pathway and microbiome based on multi-omics.Front Pharmacol. 2025 Feb 19;16:1520439. doi: 10.3389/fphar.2025.1520439. eCollection 2025. Front Pharmacol. 2025. PMID: 40046742 Free PMC article.
References
-
- Roden M, Shulman GI. The integrative biology of type 2 diabetes. Nature. 2019;576:51–60. - PubMed
-
- Stefan N, Cusi K. A global view of the interplay between non-alcoholic fatty liver disease and diabetes. Lancet Diabetes Endocrinol. 2022;10:284–296. - PubMed
-
- Watt MJ, Miotto PM, De Nardo W, Montgomery MK. The liver as an endocrine organ-linking NAFLD and insulin resistance. Endocr Rev. 2019;40:1367–1393. - PubMed
-
- Zhang H, Ma J, Tang K, Huang B. Beyond energy storage: roles of glycogen metabolism in health and disease. FEBS J. 2021;288:3772–3783. - PubMed
LinkOut - more resources
Full Text Sources
Miscellaneous