

Detecting wetland encroachment and urban agriculture land classification in Uganda using hyper-temporal remote sensing
- PMID: 38323139
- PMCID: PMC10521074
- DOI: 10.12688/aasopenres.13040.2
Detecting wetland encroachment and urban agriculture land classification in Uganda using hyper-temporal remote sensing
Abstract
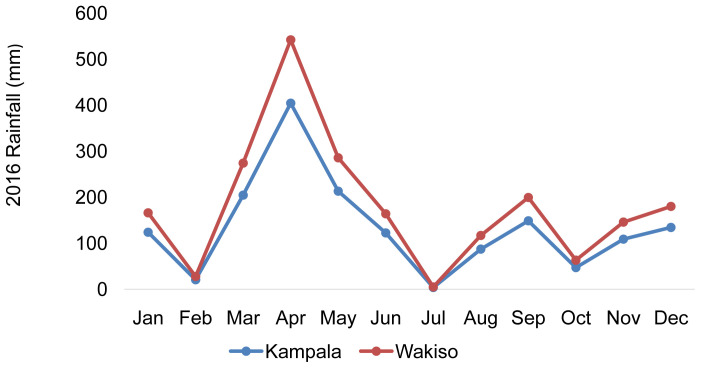
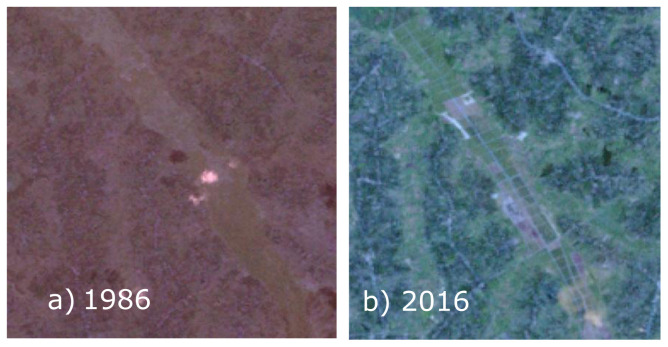
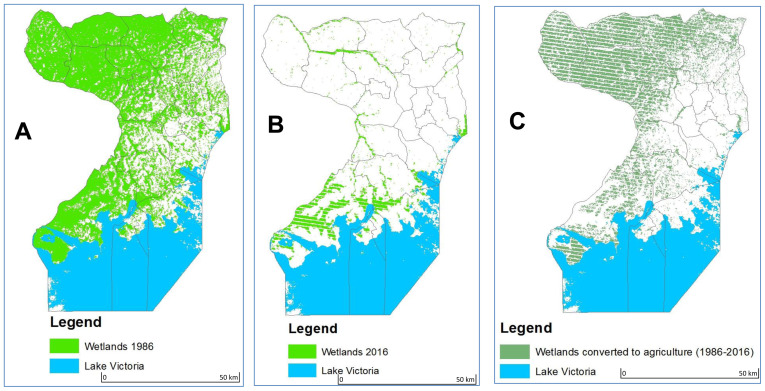
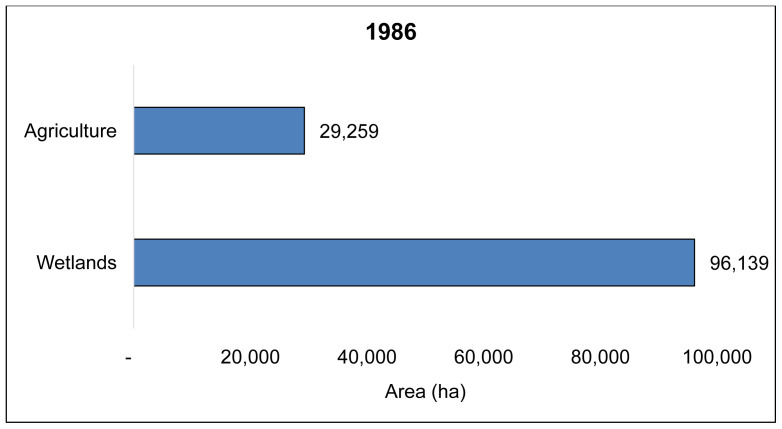
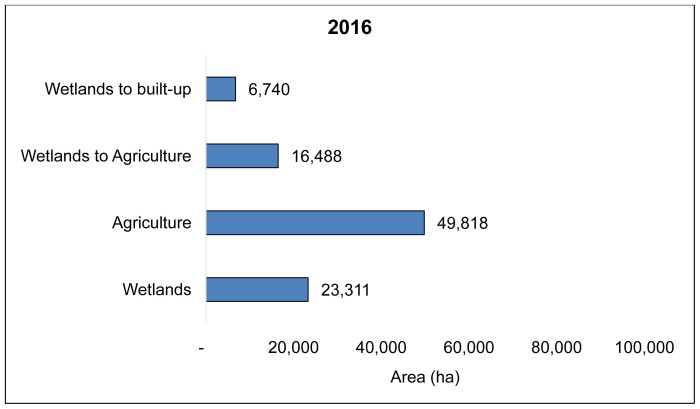
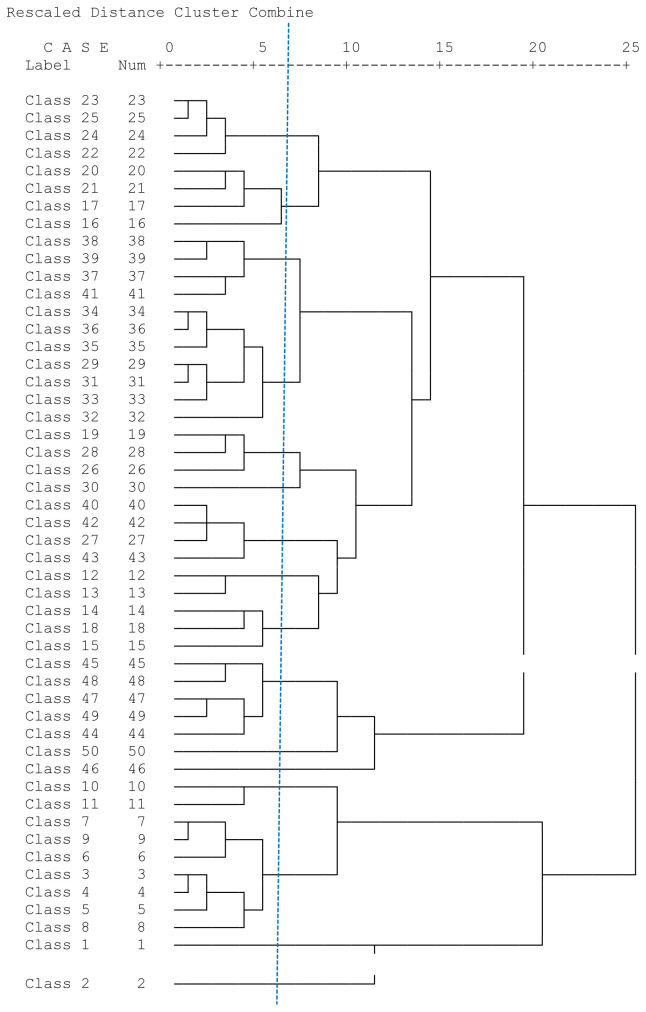
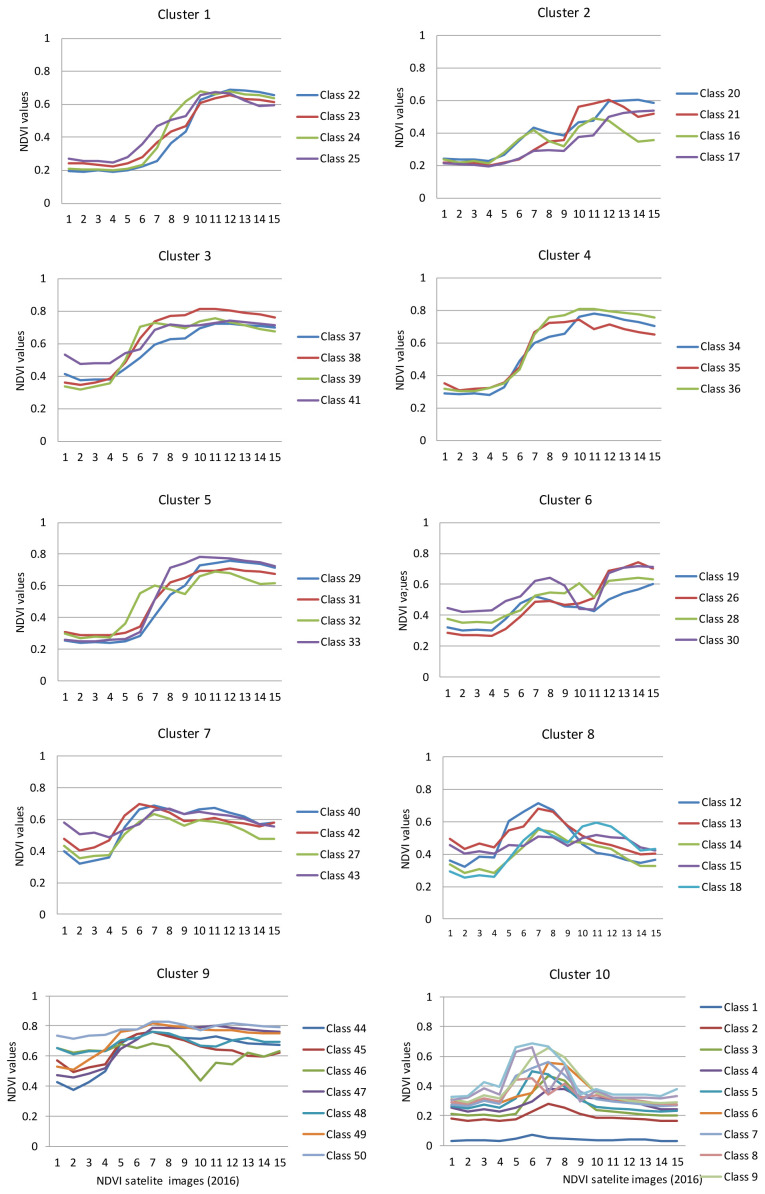
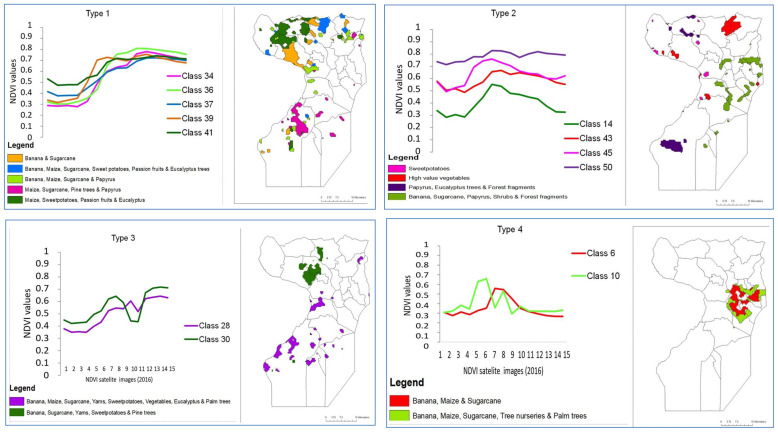
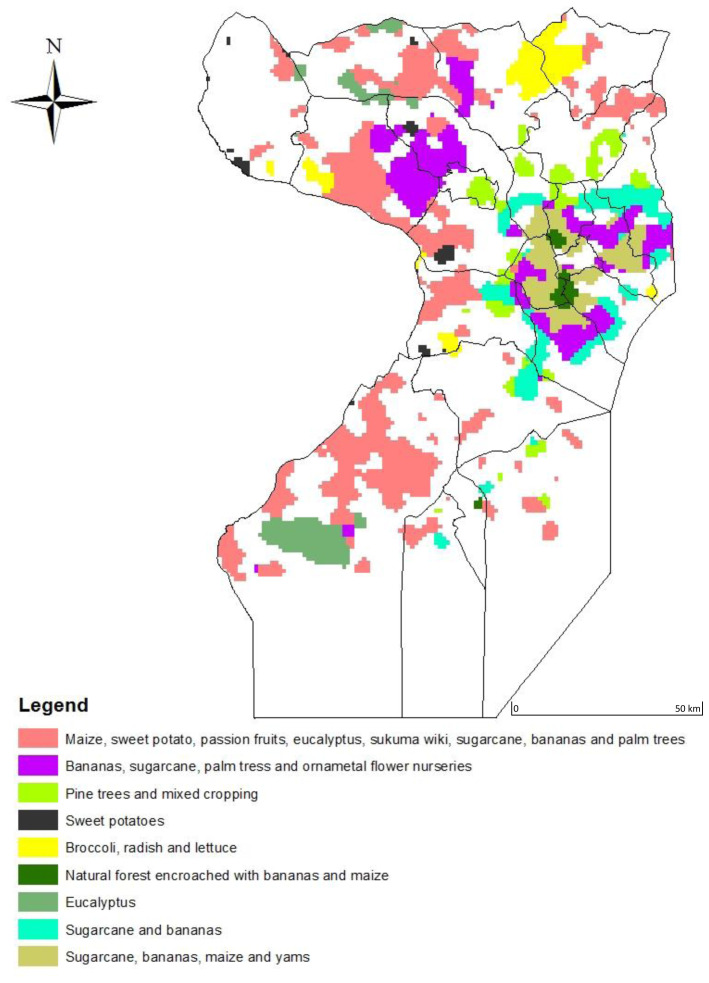
Background: Urbanization is an important indicator of economic growth and social change but is associated with environmental degradation, which threatens the sustainable growth of African cities. One of the most vulnerable ecosystems in urban areas are wetlands. In Uganda, wetlands cover an area of 11% of the country's land area. Half of the wetland areas in Ugandan cities have been converted to industrial and residential areas, and urban agriculture. There is limited information on the extent of wetland conversion or utilization for urban agriculture. The objective of this study was to investigate the extent of wetlands lost in two Ugandan cities, Wakiso and Kampala, in the last 30 years. Secondly, we extracted crop agriculture in the wetlands of Kampala and Wakiso from hyper-temporal satellite image analysis in an attempt to produce a spatial detail of wetland encroachment maps of urban agriculture using a reproducible mapmaking method. Methods: Using a field survey and free remote sensing data from Landsat TM 1986 and Landsat ETM 2016 we classified the rate of wetland loss and encroachment between the years 1986 and 2016. We used MODIS NDVI 16-day composites at a 500-meter spatial resolution to broaden the analysis to distinguish distinctive crops and crop mixtures in the encroached wetlands for urban agriculture using the ISODATA clustering algorithm. Results: Over 30 years, 72,828 ha (73%) of the Wakiso-Kampala wetlands have been lost meanwhile agriculture areas have doubled. Of this 16,488 ha (23%) were converted from wetlands. All cultivated agriculture in Kampala was in the wetlands while in Wakiso, 73% of crop agriculture was in the wetlands. The major crops grown in these urban wetlands were banana (20%), sugarcane (22%), maize (17%), Eucalyptus trees (12%), sweet potatoes (10%), while ornamental nurseries, pine trees, vegetables, and passion fruits were each at 5%.
Keywords: Environmental degradation; Lake Victoria; Papyrus wetlands; Sustainability; Urban growth.
Copyright: © 2022 Kabiri S et al.
Conflict of interest statement
No competing interests were disclosed.
Figures

Similar articles
-
Spatiotemporal analysis of encroachment on wetlands: a case of Nakivubo wetland in Kampala, Uganda.Environ Monit Assess. 2016 Apr;188(4):203. doi: 10.1007/s10661-016-5207-5. Epub 2016 Mar 2. Environ Monit Assess. 2016. PMID: 26935734
-
Monitoring spatio-temporal dynamics of urban and peri-urban land transitions using ensemble of remote sensing spectral indices-a case study of Chennai Metropolitan Area, India.Environ Monit Assess. 2019 Dec 7;192(1):15. doi: 10.1007/s10661-019-7986-y. Environ Monit Assess. 2019. PMID: 31811511
-
Land use pattern, socio-economic development, and assessment of their impacts on ecosystem service value: study on natural wetlands distribution area (NWDA) in Fuzhou city, southeastern China.Environ Monit Assess. 2013 Jun;185(6):5111-23. doi: 10.1007/s10661-012-2929-x. Epub 2012 Oct 10. Environ Monit Assess. 2013. PMID: 23054291
-
A Review of Wetland Remote Sensing.Sensors (Basel). 2017 Apr 5;17(4):777. doi: 10.3390/s17040777. Sensors (Basel). 2017. PMID: 28379174 Free PMC article. Review.
-
Agricultural use of wetlands: opportunities and limitations.Ann Bot. 2010 Jan;105(1):155-63. doi: 10.1093/aob/mcp172. Ann Bot. 2010. PMID: 19700447 Free PMC article. Review.
References
-
- Abebe GA: Quantifying urban growth pattern in developing countries using remote sensing and spatial metrics: A case study of Kampala, Uganda. MSc Thesis, University of Twente, Eschede, The Netherlands.2013;108. Reference Source
-
- African Development Fund and African Development Bank Group: Kampala Sanitation Programme: Environmental and Social Impact Assessment Summary (ESIA), Kampala. 2008. Reference Source
-
- Ali A, de Bie CAJM, Skidmore AK, et al. : Mapping land cover gradients through analysis of hyper-temporal NDVI imagery. Int J Appl Earth Obs Geoinf. 2013;23:301–312. 10.1016/j.jag.2012.10.001 - DOI
-
- Asilo S, de Bie K, Skidmore A, et al. : Complementarity of Two Rice Mapping Approaches: Characterizing Strata Mapped by Hypertemporal MODIS and Rice Paddy Identification Using Multitemporal SAR. Remote Sensing. 2014;6(12):12789–12814. 10.3390/rs61212789 - DOI
-
- Bikangaga S, Picchi MP, Focardi S, et al. : Perceived benefits of littoral wetlands in Uganda: a focus on the Nabugabo wetlands. Wetlands Ecol Manage. 2007;15(6):529–35. 10.1007/s11273-007-9049-3 - DOI
LinkOut - more resources
Full Text Sources