. 2024 Mar;134(5):482-501.
doi: 10.1161/CIRCRESAHA.123.323683. Epub 2024 Feb 7.

Integrated Stress Response Potentiates Ponatinib-Induced Cardiotoxicity

Affiliations

Integrated Stress Response Potentiates Ponatinib-Induced Cardiotoxicity

Gege Yan et al. Circ Res. 2024 Mar.

Abstract

Background: Mitochondrial dysfunction is a primary driver of cardiac contractile failure; yet, the cross talk between mitochondrial energetics and signaling regulation remains obscure. Ponatinib, a tyrosine kinase inhibitor used to treat chronic myeloid leukemia, is among the most cardiotoxic tyrosine kinase inhibitors and causes mitochondrial dysfunction. Whether ponatinib-induced mitochondrial dysfunction triggers the integrated stress response (ISR) to induce ponatinib-induced cardiotoxicity remains to be determined.

Methods: Using human induced pluripotent stem cells-derived cardiomyocytes and a recently developed mouse model of ponatinib-induced cardiotoxicity, we performed proteomic analysis, molecular and biochemical assays to investigate the relationship between ponatinib-induced mitochondrial stress and ISR and their role in promoting ponatinib-induced cardiotoxicity.

Results: Proteomic analysis revealed that ponatinib activated the ISR in cardiac cells. We identified GCN2 (general control nonderepressible 2) as the eIF2α (eukaryotic translation initiation factor 2α) kinase responsible for relaying mitochondrial stress signals to trigger the primary ISR effector-ATF4 (activating transcription factor 4), upon ponatinib exposure. Mechanistically, ponatinib treatment exerted inhibitory effects on ATP synthase activity and reduced its expression levels resulting in ATP deficits. Perturbed mitochondrial function resulting in ATP deficits then acts as a trigger of GCN2-mediated ISR activation, effects that were negated by nicotinamide mononucleotide, an NAD+ precursor, supplementation. Genetic inhibition of ATP synthase also activated GCN2. Interestingly, we showed that the decreased abundance of ATP also facilitated direct binding of ponatinib to GCN2, unexpectedly causing its activation most likely because of a conformational change in its structure. Importantly, administering an ISR inhibitor protected human induced pluripotent stem cell-derived cardiomyocytes against ponatinib. Ponatinib-treated mice also exhibited reduced cardiac function, effects that were attenuated upon systemic ISRIB administration. Importantly, ISRIB does not affect the antitumor effects of ponatinib in vitro.

Conclusions: Neutralizing ISR hyperactivation could prevent or reverse ponatinib-induced cardiotoxicity. The findings that compromised ATP production potentiates GCN2-mediated ISR activation have broad implications across various cardiac diseases. Our results also highlight an unanticipated role of ponatinib in causing direct activation of a kinase target despite its role as an ATP-competitive kinase inhibitor.

Keywords: GCN2; ISR; cardiotoxicity; mitochondria; ponatinib.


Conflict of interest statement

Disclosures None.

Figures

Figure 1.
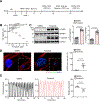
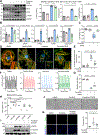
Figure 1.. Exposure of hiPSC-CMs to ponatinib leads to cardiotoxicity and impaired cardiomyocyte function.
A, Schematic of the differentiation protocol from hiPSCs to cardiomyocytes. B, Quantification of cell viability by PrestoBlue after 24 hours of treatment with DMSO vehicle (gray) or ponatinib (pink) (ranging from 0.5 to 10 μM). The viability was normalized to the vehicle control. n=9, data represent 3 individual hiPSC lines from 3 independent experiments per group. C, Western blot analysis of c-PARP and c-caspase 3 in hiPSC-CMs after DMSO or ponatinib (1 μM) treatment for 24 hours. GAPDH was used as the loading control. n=9, data represent 3 individual iPSC lines from 3 independent experiments per group. D, Representative images (left) and quantification (right) of immunostaining of the DNA damage marker γ-H2AX (green) in hiPSC-CMs after ponatinib treatment (1 μM) for 24 hours. Cardiomyocytes were counterstained with cardiac troponin T (cTnT) (red), a cardiac marker and DAPI (blue). Scale bar=10 μm. n=6, data represent 3 individual hiPSC lines from 2 independent experiments per group. At least 300 cells were counted in each group. E, Representative contractility traces (left) of hiPSC-CMs after ponatinib treatment (1 μM) for 24 hours. Quantification of hiPSC-CMs beating rates using high-speed video microscopy with motion vector analysis. n=6, data represent 3 individual hiPSC lines from 2 independent experiments per group. Data are presented as mean ± SEM. Data were analyzed using the Kruskal-Wallis test with the Dunn multiple comparisons test in B, and Mann-Whitney U test in C through E.
Figure 2.
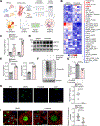
Figure 2.. Ponatinib significantly inhibits transcription and translation in hiPSC-CMs.
A, Schematic illustration of the RPPA workflow. B, Heatmap based on RPPA data from 2 hiPSC cell lines (n=4). C, mRNA expression analysis of ASCT2 and ASNS upon 24 hours of treatment with ponatinib (1 μM). n=6, data represent 3 individual hiPSC lines from 2 independent experiments per group. D, Western blot analysis showing the increased expression of ASCT2 and ASNS after 24 hours of ponatinib (1 μM) treatment. GAPDH was used as the loading control. E, Quantification of the western blot results in D. n=9, data represent 3 individual hiPSC lines from 3 independent experiments per group. F, hiPSC-CMs were treated with 10 μM puromycin after ponatinib or DMSO treatment. Puromycin is incorporated into new protein synthesis. Western blot analysis with an antibody against puromycin indicated that ponatinib treatment inhibited protein synthesis. GAPDH was used as the loading control. G, Quantification of puromycin incorporation in F. n=6, data represent 3 individual hiPSC lines from 2 independent experiments per group. H, Newly synthesized proteins were fluorescently labeled in hiPSC-CMs incubated with HPG (green) and DAPI (blue) after ponatinib or DMSO treatment. Representative images (left) and quantification (right) of fluorescent intensity showing a significant decrease in translation levels in ponatinib-treated hiPSC-CMs compared to DMSO-treated hiPSC-CMs. Scale bar=60 μm. n=9, data represent 3 individual hiPSC lines. At least 300 cells were counted in each group. I, Confocal images (left) and scatterplot (right) illustrating EU labeling (green) intensity in hiPSC-CMs 24 hours after ponatinib (1 μM) treatment. Nuclei of hiPSC-CMs were marked by DAPI (blue). Scale bars: 50 μm in the left panel, 10 μm in the right panel. n=21, data represent 3 individual hiPSC lines, from 7 independent experiments per group. At least 300 cells were counted in each group. Data are presented as mean ± SEM. Data were analyzed using the Mann-Whitney U test in C, E, G and H and two-tailed t test in I.
Figure 3.
Figure 3.. GCN2 is the eIF2α kinase responsible for ponatinib-induced ISR activation in hiPSC-CMs.
A, Western blot analysis of the levels of p-eIF2α, eIF2α and ATF4 upon treatment with ponatinib (1 μM) or DMSO for 24 hours. GAPDH was used as the loading control. n=9, data represent 3 individual hiPSC lines from 3 independent experiments per group. B, mRNA expression analysis of ATF4 after 24 hours of treatment with ponatinib (1 μM). n=6, data represent 3 individual hiPSC lines from 2 independent experiments per group. C, Schematic summarizing multiple stresses that activate the ISR via four eIF2α kinases (GCN2, PERK, PKR, and HRI) to phosphorylate eIF2α, leading to global inhibition of Cap-dependent mRNA translation while distinctly enhancing ATF4 levels. D, hiPSC-CMs were transduced with shGCN2, shPERK, shPKR and shHRI virus and a negative control (shNC) for 24 hours and then incubated with ponatinib and DMSO. Western blot analysis of GCN2, PERK, PKR, HRI and ATF4 levels. GAPDH was used as the loading control. E, Western blot analysis of p-GCN2 and GCN2 in hiPSC-CMs after DMSO or ponatinib (1 μM) treatment for 24 hours. n=6, data represent 3 individual hiPSC lines from 2 independent experiments per group. F, Western blot analysis of the levels of p-eIF2α, eIF2α and ATF4 upon treatment with DMSO or ponatinib (1 μM) or coadministration with GCN2iB (0.5 μM) for 24 hours. GAPDH was used as the loading control. n=4, data represent 2 individual hiPSC lines from 2 independent experiments. G, hiPSC-CMs were transduced with shGCN2 and the negative control (shNC) for 24 hours and then incubated with ponatinib (1 μM) and DMSO. mRNA expression analysis of ATF4 and its target genes (CHOP, ASNS, and ASCT2). n=3, data represent 3 individual hiPSC lines, each line is from an average of 4 independent experiments. Data are presented as mean ± SEM. Data were analyzed using the Mann-Whitney U test in A, B and E, and Kruskal-Wallis test with the Dunn multiple comparisons test in F and 2-way ANOVA followed by the Sidak’s post hoc test in G.
Figure 4.
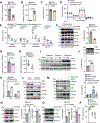
Figure 4.. Inhibition of complex V is responsible for GCN2-mediated ISR activation.
A, hiPSC-CMs were treated with DMSO or ponatinib (1 μM) for 24 hours. Mitochondrial membrane potential was measured using a tetramethylrhodamine methyl ester (TMRE) probe. n=9, data represent 3 individual hiPSC lines from 3 independent experiments per group. B, Intracellular hydrogen peroxide (H₂O₂) was measured in hiPSC-CMs. n=9, data represent 3 individual hiPSC lines from 3 independent experiments per group. C, NAD+/NADH was measured in hiPSC-CMs. n=9, data represent 3 individual hiPSC lines from 3 independent experiments per group. D, E, Representative oxygen consumption rate (OCR) and basal respiration, proton leak, maximal respiration and spare respiration capacity in DMSO- or ponatinib (0.5 and 1 μM)-treated hiPSC-CMs for 24 hours. n=12, data represent 3 individual hiPSC lines from 4 technical replicates per group. F, Mitochondria isolated from hiPSC-CMs treated with DMSO or ponatinib (1 μM) for 24 hours. Western blot analysis of mitochondrial respiratory complex subunits (NDUFA9, SDHA, UQCRC, MTCO1, and ATP5A). GAPDH was used as the loading control. n=3, data represent 3 individual hiPSC lines. G, Mitochondria isolated from hiPSC-CMs treated with DMSO or ponatinib (1 μM) for 24 hours. The complex V activity of mitochondria was measured. n=6, data represent 3 individual hiPSC lines from 2 independent experiments per group. H, The relative amount of ATP was measured in hiPSC-CMs following ponatinib or DMSO treatment. n=6, data represent 3 individual hiPSC lines from 2 independent experiments per group. I, hiPSC-CMs were treated with a mitochondrial electron transport chain (ETC) inhibitor for 24 hours, the complex I inhibitor rotenone (1 μM and 2.5 μM), the complex III inhibitor antimycin (1 μM and 2.5 μM) or the ATP synthase inhibitor oligomycin (1 μM and 2.5 μM). Western blot analysis of ATF4 and CHOP expression. GAPDH was used as the loading control. J, hiPSC-CMs were incubated with oligomycin (2.5 μM) and DMSO for 24 hours. Western blot analysis of the levels of p-GCN2 and GCN2. n=6, data represent 3 individual hiPSC lines from 2 independent experiments per group. K, hiPSC-CMs were transduced with shGCN2 and the negative control (shNC) for 24 hours and then incubated with oligomycin (2.5 μM) and DMSO for 24 hours. ATF4 mRNA expression analysis. n=3, data represent 3 individual hiPSC lines, each line is from an average of 4 independent experiments. L, hiPSC-CMs were transduced with shGCN2 and the negative control (shNC) for 24 hours and then incubated with oligomycin (2.5 μM) and DMSO for 24 hours. Western blot analysis of the levels of GCN2, ATF4, p-eIF2α and eIF2α. GAPDH was used as the loading control. M, Western blot analysis of p-GCN2, GCN2, ATF4, p-eIF2α and eIF2α after 24 hours of drug treatment in DMSO, oligomycin (2.5 μM), ISRIB (200 nM) or co-administration with ISRIB and oligomycin. GAPDH was used as the loading control. n=6, data represent 3 individual hiPSC lines from 2 independent experiments per group. N, O, hiPSC-CMs were transduced with shATP5A, shATP5MG or the negative control (shNC) for 7 days. Western blot analysis of the levels of pGCN2, GCN2, ATP5A and ATP5MG. GAPDH was used as the loading control. n=3, data represent 3 individual hiPSC lines. P, The relative amount of ATP was measured in hiPSC-CMs after transduction with shATP5A, shATP5MG, or the negative control (shNC). n=6, data represent 3 individual iPSC lines from 2 independent experiments. Data are presented as mean ± SEM. Data were analyzed using the Mann-Whitney U test in A through C, F through H, J, N and O, 1-way ANOVA followed by Tukey post hoc in E, 2-way ANOVA followed by the Sidak’s post hoc test in K, and Kruskal-Wallis test with the Dunn multiple comparisons test in M and P.
Figure 5.
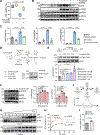
Figure 5.. Ponatinib directly binds to and activates GCN2.
A, Quantification of cell viability by PrestoBlue after 24 hours of DMSO, ponatinib (1 μM) or co-administration with an NAD+ precursor β nicotinamide nucleotide (β-NMN, 200 μM) treatment. The viability was normalized to the vehicle control. n=6, data represent 3 individual hiPSC lines from 2 independent experiments per group. B, C, Western blot analysis of p-eIF2α, eIF2α, ATF4 and c-PARP after 24 hours of drug treatment with DMSO, ponatinib (1 μM) or co-administration with β-NMN (200 μM). GAPDH was used as the loading control. n=3, data represent 3 individual hiPSC lines. D, Schematic of the ponatinib-binding ATP competition assay. Western blot analysis of GCN2 levels in avidin capture (ATP-bound) and eluate (ponatinib-bound) proteins. E, GCN2 activity assay showing autophosphorylation of GCN2 at T899 in the presence of ponatinib. n=3 biological samples. F, The activity assay demonstrates the autophosphorylation of GCN2 at T899 and the phosphorylation of eIF2α at S51, both induced by ponatinib. n=3, data represent 3 individual hiPSC lines. G, Immunoblots of p-GCN2 and GCN2 from in vitro kinase reactions with 7.5 nM GCN2 and indicated concentrations of ATP in the presence of DMSO or 1 μM ponatinib. H, Ratio of active (p-GCN2) to total (GCN2) GCN2 in the reactions fit to Michaelis-Menten nonlinear model. I, Velocity (Vmax) for GCN2 and ATP in presence of DMSO or 1 μM ponatinib derived from panel. n=3 biological samples. J, A model depicts the activation of GCN2 kinase at intermediate concentrations of ponatinib, while higher concentrations result in kinase inhibition. Data are presented as the mean ± SEM. Data were analyzed using Kruskal-Wallis test with the Dunn multiple comparisons test in A, C, E and F, and Mann-Whitney U test in I.
Figure 6.
Figure 6.. ISRIB is protective against ponatinib-induced cardiotoxicity in vitro.
A, hiPSC-CMs were cultured with or without ponatinib (1 μM) and ISRIB (200 nM) for 24 hours. Western blot analysis of p-eIF2α, eIF2α, ATF4 and c-PARP expression. GAPDH was used as the loading control. n=4, data represent 2 individual hiPSC lines from 2 independent experiments per group. B, mRNA expression analysis of the apoptosis markers PUMA and ATF4 and its targets (CHOP, TRIB3 and GADD34A). n=3, data represent 3 individual hiPSC lines, each line is from an average of 4 independent experiments. C, Quantification of cell viability by PrestoBlue after 24 hours of drug treatment. The viability was normalized to the vehicle control. n=9, data represent 3 individual hiPSC lines from 3 independent experiments per group. D, Representative immunostaining of α-actinin (green), cTnT (red) and DAPI (blue) to show sarcomere disorganization in ponatinib- or ISRIB-treated hiPSC-CMs for 24 hours. Scale bar=10 μm, inset scale bar=5 μm. E, Ratio of sarcomere disorganization in ponatinib- or ISRIB-treated hiPSC-CMs. n=12, data represent 3 individual hiPSC lines. At least 600 cells were counted in each group. F, Representative contractility traces of hiPSC-CMs after ponatinib (1 μM) or ISRIB (200 nM) treatment for 24 hours. G, Statistical results of beating rate using high-speed video microscopy with motion vector analysis in F. n=6, data represent 3 individual hiPSC lines from 2 independent experiments per group. H, hiPSC-CMs were transduced with shGCN2, shPERK, shPKR and shHRI virus and the negative control (shNC) for 24 hours and then incubated with ponatinib (1 μM) and DMSO. Quantification of cell viability by PrestoBlue, normalized to the vehicle control, 24 hours after of drug treatment. n=6, data represent 3 individual hiPSC lines from 2 independent experiments per group. I, Western blot analysis of the levels of c-PARP and c-caspase 3 upon treatment with DMSO or ponatinib (1 μM) or co-administration with GCN2iB (0.5 μM) for 24 hours. GAPDH was used as the loading control. J, Representative bright-field images illustrating the cellular morphology of hiPSC-CMs after DMSO, ponatinib (1 μM) or co-administration with GCN2iB (0.5 μM) for 24 hours. Scale bar=100 μm. K, Representative immunostaining of hiPSC-CMs stained with ImageiT dead green stain (green) and Hoechst stain (blue) after treatment with ponatinib (1 μM) or co-administration with GCN2iB (0.5 μM) for 24 hours. Scale bar=60 μm. n=6, data represent 3 individual hiPSC lines from 2 independent experiments per group. At least 300 cells were counted in each group. Data are presented as the mean ± SEM. Data were analyzed using the Kruskal-Wallis test with the Dunn multiple comparisons test in A, C, G, H and K, and 1-way ANOVA followed by Tukey post hoc in B and E.
Figure 7.
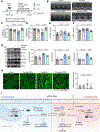
Figure 7.. ISRIB is protective against ponatinib-induced cardiotoxicity in vivo.
A, Experimental outline of ponatinib and ISRIB administration in 8-week-old ApoE−/− mice. Mice were subjected to HFD for 8 weeks, after that mice were received an intraperitoneal injection of ISRIB or vehicle at 2.5 mg/kg once every two days and oral administration of ponatinib or vehicle at 15 mg/kg daily for 2 weeks, followed by in vivo studies. B-F, Cardiac function was examined by echocardiography, and the percentage of left ventricle fractional shortening (LVFS), left ventricle ejection fraction (LVEF), left ventricular internal diameter at the end of diastole (LVID;d) and left ventricular internal diameter at the end of systole (LVID;s) n=10 mice. G, After treatment with ponatinib or ISRIB for 2 weeks, cardiomyocytes were isolated from the mice. Western blot analysis of the levels of p-GCN2, GCN2, p-eIF2α, eIF2α and ATF4. GAPDH was used as the loading control. n=6 biological samples. H, Confocal images (left) and scatterplot (right) illustrating TUNEL (red) intensity on cardiac tissue sections. Nuclei were marked by DAPI (blue). Cardiac myocytes were marked by α-actinin (green), Scale bars: 10 μm in the left panel. n=15, 5 biological samples. At least 600 cells were counted in each group. I, Proposed model of ponatinib-induced cardiotoxicity. Data are presented as the mean ± SEM. Data were analyzed using the 1-way ANOVA followed by Tukey post hoc in C through F and H, and Kruskal-Wallis test with the Dunn multiple comparisons test in G.

Comment in

References

    1. Global Burden of Disease Cancer C, Kocarnik JM, Compton K, Dean FE, Fu W, Gaw BL, Harvey JD, Henrikson HJ, Lu D, Pennini A, et al. Cancer Incidence, Mortality, Years of Life Lost, Years Lived With Disability, and Disability-Adjusted Life Years for 29 Cancer Groups From 2010 to 2019: A Systematic Analysis for the Global Burden of Disease Study 2019. JAMA Oncol. 2022;8:420–444. doi: 10.1001/jamaoncol.2021.6987 - DOI - PMC - PubMed
    1. Herrmann J Adverse cardiac effects of cancer therapies: cardiotoxicity and arrhythmia. Nat Rev Cardiol. 2020;17:474–502. doi: 10.1038/s41569-020-0348-1 - DOI - PMC - PubMed
    1. Omland T, Heck SL, Gulati G. The Role of Cardioprotection in Cancer Therapy Cardiotoxicity: JACC: CardioOncology State-of-the-Art Review. JACC CardioOncol. 2022;4:19–37. doi: 10.1016/j.jaccao.2022.01.101 - DOI - PMC - PubMed
    1. Zamorano JL, Gottfridsson C, Asteggiano R, Atar D, Badimon L, Bax JJ, Cardinale D, Cardone A, Feijen EAM, Ferdinandy P, et al. The cancer patient and cardiology. Eur J Heart Fail. 2020;22:2290–2309. doi: 10.1002/ejhf.1985 - DOI - PMC - PubMed
    1. O’Hare T, Zabriskie MS, Eiring AM, Deininger MW. Pushing the limits of targeted therapy in chronic myeloid leukaemia. Nat Rev Cancer. 2012;12:513–526. doi: 10.1038/nrc3317 - DOI - PubMed

Publication types