. 2024 Jul 29;16(2):mjae006.
doi: 10.1093/jmcb/mjae006.

Organization of microtubule plus-end dynamics by phase separation in mitosis

Affiliations

Organization of microtubule plus-end dynamics by phase separation in mitosis

Fengrui Yang et al. J Mol Cell Biol. .

Abstract

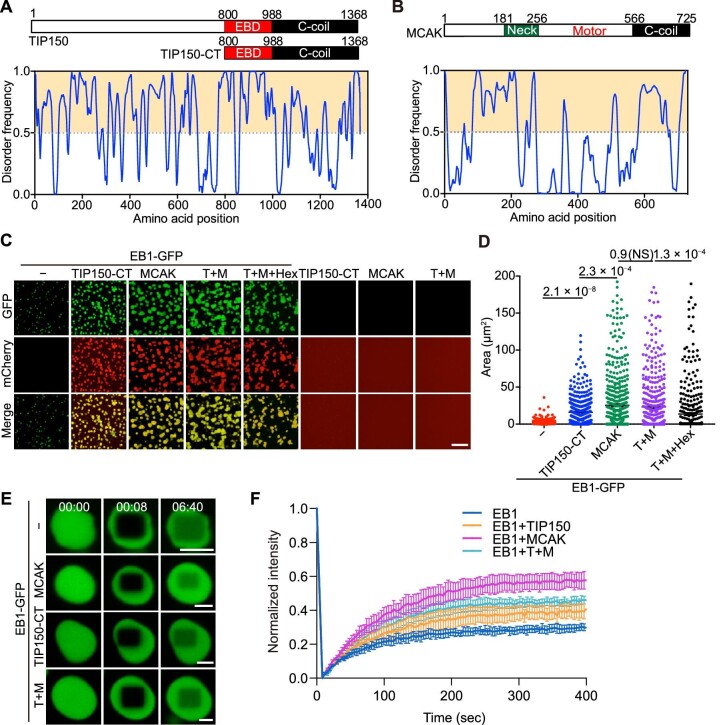
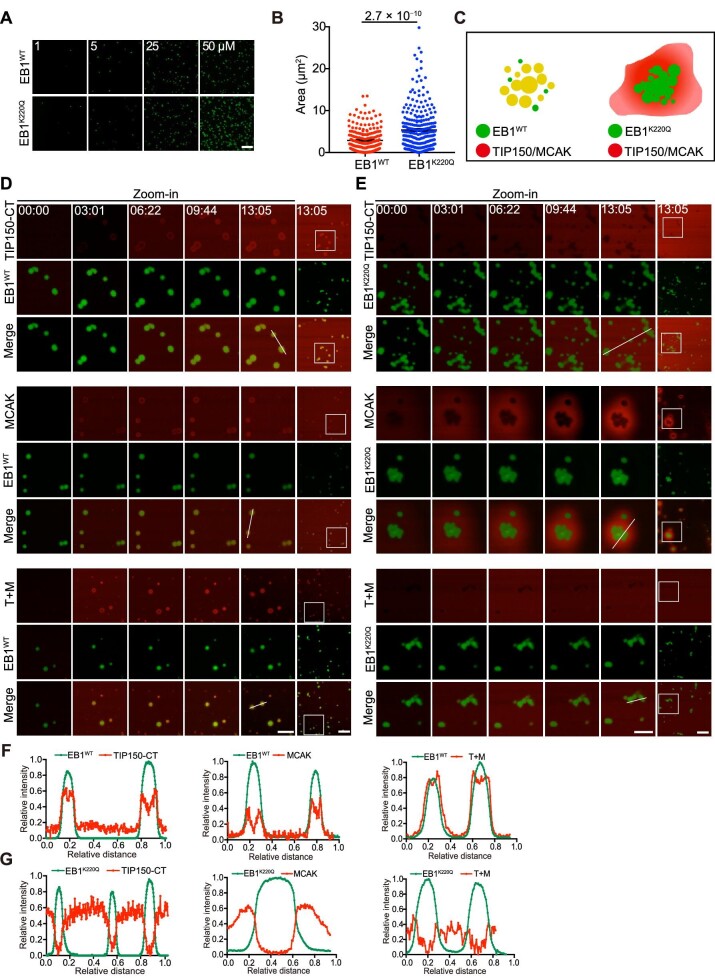
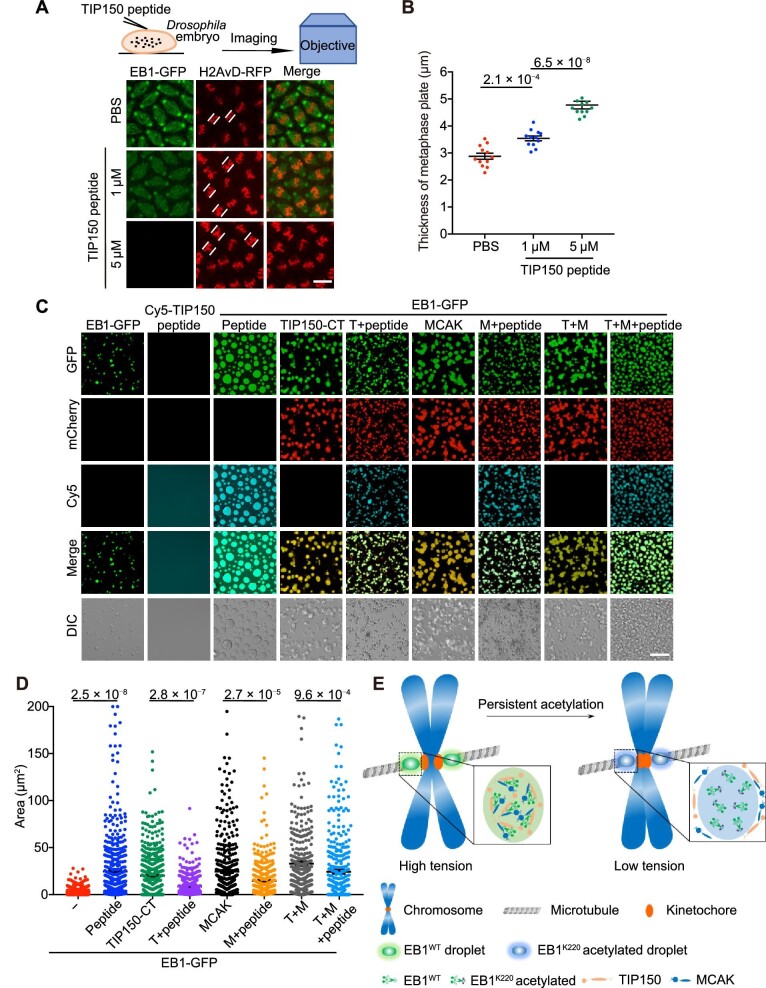
In eukaryotes, microtubule polymers are essential for cellular plasticity and fate decisions. End-binding (EB) proteins serve as scaffolds for orchestrating microtubule polymer dynamics and are essential for cellular dynamics and chromosome segregation in mitosis. Here, we show that EB1 forms molecular condensates with TIP150 and MCAK through liquid-liquid phase separation to compartmentalize the kinetochore-microtubule plus-end machinery, ensuring accurate kinetochore-microtubule interactions during chromosome segregation in mitosis. Perturbation of EB1-TIP150 polymer formation by a competing peptide prevents phase separation of the EB1-mediated complex and chromosome alignment at the metaphase equator in both cultured cells and Drosophila embryos. Lys220 of EB1 is dynamically acetylated by p300/CBP-associated factor in early mitosis, and persistent acetylation at Lys220 attenuates phase separation of the EB1-mediated complex, dissolves droplets in vitro, and harnesses accurate chromosome segregation. Our data suggest a novel framework for understanding the organization and regulation of eukaryotic spindle for accurate chromosome segregation in mitosis.

Keywords: EB1; acetylation; microtubule dynamics; mitosis; phase separation.


Figures

Figure 1
Figure 1
EB1 selectively forms coacervates with TIP150 and MCAK. (A and B) Schematic representations of the domain structures (upper) and sequence features (lower) of human TIP150 (A) and MCAK (B). TIP150-CT (aa 800–1368), containing the EBD and the C-coil domain, was used in this study. The line at 0.5 (y-axis) is the cut-off for disorder (>0.5) and order (<0.5) predictions. The VLXT predictor was used for disordered dispositions. (C) Representative micrographs showing enrichment of TIP150-CT and/or MCAK in EB1 droplets in BRB80 buffer. All protein concentrations were 20 μM. All groups are displayed using identical fluorescence image settings. TIP150-CT, TIP150-CT-mCherry; MCAK, MCAK-mCherry; T+M, TIP150-CT-mCherry + MCAK-mCherry. Hex, 1,6-hexanediol. Scale bar, 10 μm. (D) Statistical analyses of the droplet area shown in C (n = 560 droplets for each group). Data are presented as mean ± standard error of the mean (SEM) (n = 3 bilogical repeats) and were examined by one-way analysis of variance (ANOVA) with Tukey's multiple comparisons test. P-values are indicated. NS, not significant. (E) FRAP analysis of co-droplets formed by TIP150-CT and/or MCAK with EB1 (time shown as min:sec). All protein concentrations were 20 μM. Scale bar, 5 μm. (F) Quantitative analyses of the fluorescence inside the droplet over time shown in E. Data are presented as mean ± SEM at each time point (n = 6 droplets combined from three independent repeats).
Figure 2
Figure 2
Lys220 is important for LLPS-driven EB1 scaffold organization. (A) Phase separation assay of purified GFP-tagged EB1WT and EB1K220Q at different concentrations. Images were acquired at room temperature. Scale bar, 20 μm. (B) Statistical analyses of the droplet area shown in A (n = 217 and 274 droplets for EB1WT and EB1K220Q, respectively). Data are presented as mean ± SEM (n = 3 biological repeats) and were examined by two-tailed Student's t-test. The P-value is indicated. (C) Schematic representation illustrating the co-phase separation between EB1 (EB1WT and EB1K220Q) and other +TIPs. (D and E) Time-lapse co-phase separation assay of GFP-tagged EB1WT (D) and EB1K220Q (E) with TIP150-CT and/or MCAK, observed by confocal microscopy (time is shown as min:sec). The left panels (scale bar, 5 μm) are enlarged views of the boxed area in the rightmost image (scale bar, 10 μm). TIP150-CT, TIP150-CT-mCherry; MCAK, MCAK-mCherry; T+M, TIP150-CT-mCherry + MCAK-mCherry. (F and G) Plot profiles of droplet fluorescence intensity along the indicated white lines shown in D and E, respectively.
Figure 3
Figure 3
The EB1–TIP150 interaction is essential for coacervate stability in vivo. (A) COS-7 cells transfected with EB1-mCherry-Cry2 were incubated with PBS or FITC-TIP150-TAT peptide (TIP150 peptide; at a final concentration of 10 μM) for 30 min and subjected to blue light opto-activation. Then, the light was switched off for droplet release (time is shown as min:sec). The rightmost panel (scale bar, 5 μm) shows the enlarged image of the boxed area in the left panels (scale bar, 10 μm) in each row. (B) Quantification of the number of OptoEB1 droplets during opto-activation and the subsequent release shown in A. (C) HeLa cells transfected with mCherry-H2B were treated with thymidine for 16 h and released from thymidine for 8 h. Then, the cells were treated with PBS or TIP150 peptide for 30 min before live cell imaging for 2 h. The paired white lines and arrows indicate the thickness of the metaphase plate and misaligned chromosomes, respectively. Scale bar, 10 μm. (D) Statistical analyses of the thickness of the metaphase plate shown in C. Data are presented as mean ± SEM (n = 3 biological repeats) and were examined by two-tailed Student's t-test. The P-value is indicated. For each group, 22 mitotic cells were quantified.
Figure 4
Figure 4
Phase separation of EB1 coacervates is functionally and evolutionarily conserved. (A) Schematic of the microinjection of EB1-GFP and Cy5-TIP150-TAT peptide (TIP150 peptide) into Drosophila embryos. Images show EB1-GFP and chromosome morphology in the absence or presence of TIP150 peptide at the indicated concentrations. The paired white lines indicate the thickness of the metaphase plate. Scale bar, 5 μm. (B) Statistical analyses of the thickness of the metaphase plate shown in A. For each group, 12 mitotic cells were quantified. (C) Representative micrographs showing the enrichment of TIP150-CT and/or MCAK in EB1-GFP droplets in the presence or absence of Cy5-TIP150-TAT peptide (peptide; 10 μM). All protein concentrations were 10 μM. TIP150-CT, TIP150-CT-mCherry; MCAK, MCAK-mCherry; T+M, TIP150-CT-mCherry + MCAK-mCherry. DIC, differential interference contrast. Scale bar, 10 μm. (D) Statistical analyses of the droplet area shown in C (n = 678, 503, 503, 539, 455, 471, 405, and 450 droplets, respectively). In B and D, data are presented as mean ± SEM (n = 3 biological repeats) and were examined by one-way ANOVA with Tukey's multiple comparisons test. P-values are indicated. (E) This model illustrates how EB1 dynamically organizes compartmentalization to precisely distribute microtubule plus-end regulators, including MCAK and TIP150.

References

    1. Adams G. Jr, Zhou J., Wang W.et al. (2016). The microtubule plus end tracking protein TIP150 interacts with cortactin to steer directional cell migration. J. Biol. Chem. 291, 20692–20706. - PMC - PubMed
    1. Akhmanova A., Steinmetz M.O. (2008). Tracking the ends: a dynamic protein network controls the fate of microtubule tips. Nat. Rev. Mol. Cell Biol. 9, 309–322. - PubMed
    1. Akhmanova A., Steinmetz M.O. (2015). Control of microtubule organization and dynamics: two ends in the limelight. Nat. Rev. Mol. Cell Biol. 16, 711–726. - PubMed
    1. Askham J.M., Vaughan K.T., Goodson H.V.et al. (2002). Evidence that an interaction between EB1 and p150Glued is required for the formation and maintenance of a radial microtubule array anchored at the centrosome. Mol. Biol. Cell 13, 3627–3645. - PMC - PubMed
    1. Bergeron-Sandoval L.P., Safaee N., Michnick S.W. (2016). Mechanisms and consequences of macromolecular phase separation. Cell 165, 1067–1079. - PubMed

Publication types