. 2024 Apr;20(4):2469-2484.
doi: 10.1002/alz.13691. Epub 2024 Feb 7.

Using blood transcriptome analysis for Alzheimer's disease diagnosis and patient stratification

Affiliations

Using blood transcriptome analysis for Alzheimer's disease diagnosis and patient stratification

Huan Zhong et al. Alzheimers Dement. 2024 Apr.

Abstract

Introduction: Blood protein biomarkers demonstrate potential for Alzheimer's disease (AD) diagnosis. Limited studies examine the molecular changes in AD blood cells.

Methods: Bulk RNA-sequencing of blood cells was performed on AD patients of Chinese descent (n = 214 and 26 in the discovery and validation cohorts, respectively) with normal controls (n = 208 and 38 in the discovery and validation cohorts, respectively). Weighted gene co-expression network analysis (WGCNA) and deconvolution analysis identified AD-associated gene modules and blood cell types. Regression and unsupervised clustering analysis identified AD-associated genes, gene modules, cell types, and established AD classification models.

Results: WGCNA on differentially expressed genes revealed 15 gene modules, with 6 accurately classifying AD (areas under the receiver operating characteristics curve [auROCs] > 0.90). These modules stratified AD patients into subgroups with distinct disease states. Cell-type deconvolution analysis identified specific blood cell types potentially associated with AD pathogenesis.

Discussion: This study highlights the potential of blood transcriptome for AD diagnosis, patient stratification, and mechanistic studies.

Highlights: We comprehensively analyze the blood transcriptomes of a well-characterized Alzheimer's disease cohort to identify genes, gene modules, pathways, and specific blood cells associated with the disease. Blood transcriptome analysis accurately classifies and stratifies patients with Alzheimer's disease, with some gene modules achieving classification accuracy comparable to that of the plasma ATN biomarkers. Immune-associated pathways and immune cells, such as neutrophils, have potential roles in the pathogenesis and progression of Alzheimer's disease.

Keywords: Alzheimer's disease; blood; co‐expression; deconvolution; diagnosis; neutrophil; stratification; transcriptome.


Conflict of interest statement

Y.J., F.C.I., A.K.F., and N.Y.I. are inventors of the protein biomarker‐related technology licensed to Cognitact. Y.J. and F.C.I. are co‐founders of Cognitact. The remaining authors declare no competing interests. Author disclosures are available in the supporting information.

Figures

FIGURE 1
FIGURE 1
Schematic diagram of the study design. (A) Samples and data collected. (B) Types of analyses performed. (C) Proposed applications of blood transcriptomic data for Alzheimer's disease classification, patient stratification, and cell‐type analysis. AD, Alzheimer's disease; ATN, amyloid/tau/neurodegeneration; RNA‐seq, RNA sequencing
FIGURE 2
FIGURE 2
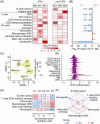
Dysregulation of genes and pathways in the blood of patients with AD. (A) Heatmap of the normalized expressions of genes that were differentially expressed between patients with AD (n = 214) and NCs (n = 208) in the discovery cohort (FDR < 0.1). Rows represent individual genes (n = 7736 and 5101 up‐ and downregulated genes, respectively), and columns represent individual participants. Colors denote the levels of gene expression (TPM). (B) Representative gene ontology terms enriched by genes that were up‐ (red) or downregulated (blue) in patients with AD versus NCs. (C) Correlations between the log2(fold‐change) of differentially expressed genes in the discovery cohort (n = 422) and validation cohort (n = 64). (D) Heatmap showing the differential expressions of AD genes identified by GWASs in the discovery and validation cohorts. (E) Dot plot of the transcript levels of representative AD genes that were differentially expressed in the blood of patients with AD versus NCs in the discovery cohort. Data are mean ± SEM. (D, E) Log2(fold‐change) calculated by negative binomial generalized linear models from DESeq2; *p < 0.05, **p < 0.01, ***p < 0.001. AD, Alzheimer's disease; FDR, false discovery rate; GWAS, genome‐wide association study; NC, normal control; Norm., normalized; SEM, standard error of the mean; TPM, transcripts per million
FIGURE 3
FIGURE 3
Gene modules with distinct biological functions identified by co‐expression network analysis. (A) Heatmap showing the co‐expression (i.e., correlation coefficients) among differentially expressed genes in the blood of patients with AD. Colors along the left side and top represent the 15 gene modules defined by weighted correlation network analysis. (B) Detailed information about the 15 identified gene modules, including (from left to right) the correlations between the modules and the presence of AD, gene count, and associated biological functions inferred from Gene Ontology analysis (Pearson correlation analysis; *p < 0.05, **p < 0.01, ***p < 0.001). AD, Alzheimer's disease
FIGURE 4
FIGURE 4
Classification of AD status according to the ATN and non‐ATN gene modules. (A) AD classification accuracy of individual gene modules in the discovery and validation cohorts. The auROCs > 0.9 are highlighted in red. (B) The correlations between modules with a auROC > 0.9 in the two analyzed cohorts and the levels of the ATN biomarkers in all participants were examined. Modules correlated with any ATN biomarker are underlined (Pearson correlation analysis; *p < 0.05, **p < 0.01, ***p < 0.001). (C) AD classification accuracy for selected modules grouped according to their association with the ATN biomarkers. Data are the mean ± SEM auROCs obtained using each module score within the group (one‐sample t‐test). ROC curves showing the discriminatory accuracy of selected modules and the plasma ATN biomarkers in (D) the discovery cohort and (E) validation cohort. AD, Alzheimer's disease; ATN, amyloid/tau/neurodegeneration; auROC, area under the receiver operating characteristic curve; NC, normal control
FIGURE 5
FIGURE 5
Stratification of participants based on the ATN and non‐ATN gene modules (A) UMAP plots of participants stratified according to phenotype group (left panel) and subgroups (right panel: C1–C5). Colors denote the indicated group phenotypes (AD and NC, left panel) or indicated subgroups classified by k‐means unsupervised clustering (right panel). (B) Comparison of plasma ATN biomarker levels among subgroups (generalized linear regression; *p < 0.05, **p < 0.01, ***p < 0.001 vs. C1; # p < 0.05, ## p < 0.01, ### p < 0.001 vs. C2). Data are mean ± SEM. (C) Heatmap comparing module scores from six modules that closely associated with AD among subgroups (generalized liner regression; *p < 0.05, ***p < 0.001 vs. C1). (D) Radar plot showing the relative differences in average module scores among C1, C3, and C5. Aβ, amyloid‐beta; AD, Alzheimer's disease; ATN, amyloid/tau/neurodegeneration; NC, normal control; NfL, neurofilament light polypeptide; p‐tau181, tau phosphorylated at threonine 181; UMAP, uniform manifold approximation and projection
FIGURE 6
FIGURE 6
Changes in blood cell subtypes are implicated in AD. (A) Heatmap showing the associations among the selected gene modules and enrichment scores for individual cell types estimated by cell‐type deconvolution analysis (NCs; one‐tailed robust regression; *p < 0.05, **p < 0.01, ***p < 0.001). (B) Associations between disease phenotypes and enrichment scores for individual cell types from cell‐type deconvolution analysis (generalized liner regression; *p < 0.05, **p < 0.01, ***p < 0.001). (C) UMAP plot showing the scores of the M15 module in the blood single‐cell dataset. (D) Module scores for M15 in distinct blood cell types classified according to the blood single‐cell RNA sequencing data. (E) Heatmap displaying cell‐type enrichment scores among subgroups of participants (i.e., C1–C5) (generalized liner regression; *p < 0.05, **p < 0.01, ***p < 0.001 vs. C1). (F) Radar plot displaying the relative differences in cell‐type enrichment scores among C1, C3, and C5. AD, Alzheimer's disease; NC, normal control; UMAP, uniform manifold approximation and projection

References

    1. 2021 Alzheimer's disease facts and figures. Alzheimers Dement. 2021;17(3):327‐406. doi:10.1002/alz.12328 - DOI - PubMed
    1. Hampel H, O'Bryant SE, Molinuevo JL, et al. Blood‐based biomarkers for Alzheimer disease: mapping the road to the clinic. Nat Rev Neurol. 2018;14(11):639‐652. doi:10.1038/s41582-018-0079-7 - DOI - PMC - PubMed
    1. Zetterberg H. Blood‐based biomarkers for Alzheimer's disease‐An update. J Neurosci Methods. 2019;319:2‐6. doi:10.1016/j.jneumeth.2018.10.025 - DOI - PubMed
    1. Teunissen CE, Verberk IMW, Thijssen EH, et al. Blood‐based biomarkers for Alzheimer's disease: towards clinical implementation. Lancet Neurol. 2022;21(1):66‐77. doi:10.1016/S1474-4422(21)00361-6 - DOI - PubMed
    1. Hansson O, Edelmayer RM, Boxer AL, et al. The Alzheimer's Association appropriate use recommendations for blood biomarkers in Alzheimer's disease. Alzheimers Dement. doi:10.1002/ALZ.12756. Published online 2022. - DOI - PMC - PubMed

Publication types