Randomized Controlled Trial
. 2024 Apr 1;326(4):E443-E453.
doi: 10.1152/ajpendo.00301.2023. Epub 2024 Feb 7.

Effects of exogenous lactate on lipid, protein, and glucose metabolism-a randomized crossover trial in healthy males

Affiliations
Randomized Controlled Trial

Effects of exogenous lactate on lipid, protein, and glucose metabolism-a randomized crossover trial in healthy males

Mette G B Pedersen et al. Am J Physiol Endocrinol Metab. .

Abstract

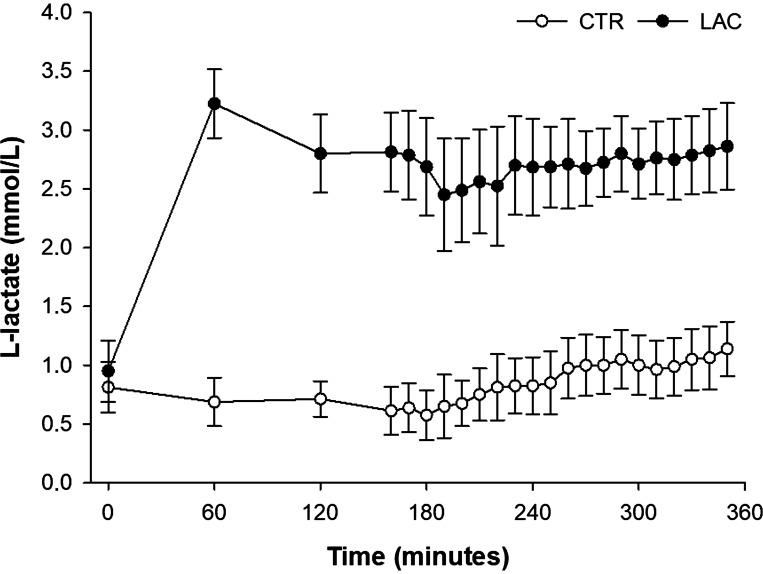
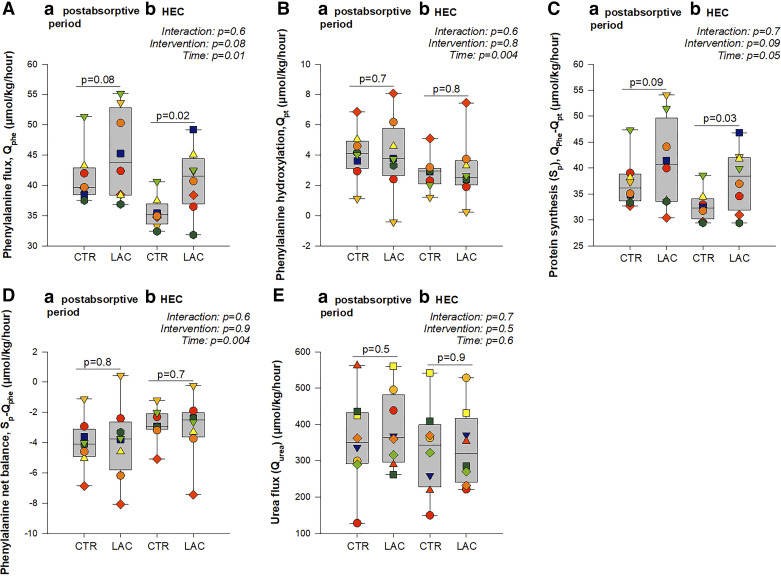
Lactate may inhibit lipolysis and thus enhance insulin sensitivity, but there is a lack of metabolic human studies. This study aimed to determine how hyperlactatemia affects lipolysis, glucose- and protein metabolism, and insulin sensitivity in healthy men. In a single-blind, randomized, crossover design, eight healthy men were studied after an overnight fast on two occasions: 1) during a sodium-lactate infusion (LAC) and 2) during a sodium-matched NaCl infusion (CTR). Both days consisted of a 3-h postabsorptive period followed by a 3-h hyperinsulinemic-euglycemic clamp (HEC). Lipolysis rate, endogenous glucose production (EGP), and delta glucose rate of disappearance (ΔRdglu) were evaluated using [9,10-3H]palmitate and [3-3H]glucose tracers. In addition, whole body- and forearm protein metabolism was assessed using [15N]phenylalanine, [2H4]tyrosine, [15N]tyrosine, and [13C]urea tracers. In the postabsorptive period, plasma lactate increased to 2.7 ± 0.5 mmol/L during LAC vs. 0.6 ± 0.3 mmol/L during CTR (P < 0.001). In the postabsorptive period, palmitate flux was 30% lower during LAC compared with CTR (84 ± 32 µmol/min vs. 120 ± 35 µmol/min, P = 0.003). During the HEC, palmitate flux was suppressed similarly during both interventions (P = 0.7). EGP, ΔRdglu, and M value were similar during LAC and CTR. During HEC, LAC increased whole body phenylalanine flux (P = 0.02) and protein synthesis (P = 0.03) compared with CTR; LAC did not affect forearm protein metabolism compared with CTR. Lactate infusion inhibited lipolysis by 30% under postabsorptive conditions but did not affect glucose metabolism or improve insulin sensitivity. In addition, whole body phenylalanine flux was increased. Clinical trial registrations: NCT04710875.NEW & NOTEWORTHY Lactate is a decisive intermediary metabolite, serving as an energy substrate and a signaling molecule. The present study examines the effects of lactate on substrate metabolism and insulin sensitivity in healthy males. Hyperlactatemia reduces lipolysis by 30% without affecting insulin sensitivity and glucose metabolism. In addition, hyperlactatemia increases whole body amino acid turnover rate.

Keywords: energy expenditure; insulin sensitivity; lactate; lipolysis; protein metabolism.


Conflict of interest statement

No conflicts of interest, financial or otherwise, are declared by the authors.

Figures

None
Graphical abstract
Figure 1.
Figure 1.
Study day flowchart. CTR, control (sodium-matched NaCl infusion); LAC, lactate (sodium-lactate infusion). Created with BioRender.com
Figure 2.
Figure 2.
Lactate concentration. Mean plasma l-lactate concentrations ±SD (n = 8). CTR, control (sodium-matched NaCl infusion); LAC, lactate (sodium-lactate infusion).
Figure 3.
Figure 3.
Palmitate flux. Palmitate flux (μmol/min) in the postabsorptive state (A) (n = 7, due to technical issues with the palmitate infusion in one volunteer) and during the hyperinsulinemic-euglycemic clamp (HEC, B) (n = 8). CTR, control (sodium-matched NaCl infusion); LAC, lactate (sodium-lactate infusion).
Figure 4.
Figure 4.
Glucose kinetics and insulin sensitivity. A: endogenous glucose production by the end of the postabsorptive period and the hyperinsulinemic-euglycemic clamp (HEC). Postabsorptive, n = 7; HEC, n = 6. B: glucose rate of disappearance (Rdglu) by the end of the postabsorptive period and the hyperinsulinemic-euglycemic clamp (HEC). Postabsorptive, n = 7, HEC, n = 7. C: ΔRdglu between the postabsorptive period and the HEC, n = 6. D: insulin sensitivity (M value), n = 8. All missing data were due to technical issues with the [3-3H]glucose infusion. In A and B, P values are based on the mixed model with time, intervention, and interaction between the two as fixed effects and participants as random effect. “Interaction, P” indicates the P value for the interaction between time and intervention, “intervention, P” indicates the P value for the effect of the intervention, “time, P” indicates the P value for the effect of time. P values between boxplots within a and b represent post hoc pairwise comparisons based on the model. In C and D, P values represent paired t tests as there was only one ΔRdglu and M value from each study day. CTR, control (sodium-matched NaCl infusion); LAC, lactate (sodium-lactate infusion).
Figure 5.
Figure 5.
Whole body amino acid and urea kinetics. Phenylalanine flux (A), phenylalanine hydroxylation to tyrosine (B), protein synthesis (C), phenylalanine net balance (D), urea flux (E). P values are based on the mixed model with time, intervention, and interaction between the two as fixed effects and participants as random effect. “Interaction, P” indicates the P value for the interaction between time and intervention, “intervention, P” indicates the P value for the effect of the intervention, and “time, P” indicates the P value for the effect of time. P values between boxplots within a and b represent post hoc pairwise comparisons based on the model. n = 8. CTR, control (sodium-matched NaCl infusion); HEC, hyperinsulinemic-euglycemic clamp; LAC, lactate (sodium-lactate infusion); Qphe, phenylalanine flux; Qpt, phenylalanine to tyrosine hydroxylation; Qurea, urea flux; Sp, protein synthesis.
Figure 6.
Figure 6.
Forearm phenylalanine kinetics. Phenylalanine rate of appearance (A), phenylalanine rate of disappearance (B), phenylalanine net balance (C). P values are based on the repeated-measures mixed model with time, intervention, and interaction between the two as fixed effects and participants as random effect. “Interaction, P” indicates the P value for the interaction between time and intervention, “intervention, P” indicates the P value for the effect of the intervention, and “time, P” indicates the P value for the effect of time. P values between boxplots within a and b represent post hoc pairwise comparisons based on the model. All measures in the postabsorptive period, n = 8; measures during hyperinsulinemic-euglycemic clamp (HEC) with control (CTR, sodium-matched NaCl infusion), n = 7, because of saline sample dilution at the time of sample drawing for n = 1. LAC, lactate (sodium-lactate infusion); Ra, rate of appearance; Rd, rate of disappearance.
Figure 7.
Figure 7.
HCO3 concentration. Mean HCO3 concentrations ± SD [n = 7 for lactate (LAC, sodium-lactate infusion) and n = 8 for control (CTR, sodium-matched NaCl infusion)].
Figure A1.
Figure A1.
Consort flow diagram.

Similar articles

Cited by

References

    1. Ahmed K, Tunaru S, Tang C, Müller M, Gille A, Sassmann A, Hanson J, Offermanns S. An autocrine lactate loop mediates insulin-dependent inhibition of lipolysis through GPR81. Cell Metab 11: 311–319, 2010. doi:10.1016/j.cmet.2010.02.012. - DOI - PubMed
    1. Cai TQ, Ren N, Jin L, Cheng K, Kash S, Chen R, Wright SD, Taggart AK, Waters MG. Role of GPR81 in lactate-mediated reduction of adipose lipolysis. Biochem Biophys Res Commun 377: 987–991, 2008. doi:10.1016/j.bbrc.2008.10.088. - DOI - PubMed
    1. Achten J, Gleeson M, Jeukendrup AE. Determination of the exercise intensity that elicits maximal fat oxidation. Med Sci Sports Exerc 34: 92–97, 2002. doi:10.1097/00005768-200201000-00015. - DOI - PubMed
    1. Martin WH 3rd, Klein S. Use of endogenous carbohydrate and fat as fuels during exercise. Proc Nutr Soc 57: 49–54, 1998. doi:10.1079/pns19980008. - DOI - PubMed
    1. Achten J, Jeukendrup AE. Relation between plasma lactate concentration and fat oxidation rates over a wide range of exercise intensities. Int J Sports Med 25: 32–37, 2004. doi:10.1055/s-2003-45231. - DOI - PubMed

Publication types

LinkOut - more resources