

Genotype-Phenotype Associations in an X-Linked Retinoschisis Patient Cohort: The Molecular Dynamic Insight and a Promising SD-OCT Indicator
- PMID: 38324300
- PMCID: PMC10854265
- DOI: 10.1167/iovs.65.2.17
Genotype-Phenotype Associations in an X-Linked Retinoschisis Patient Cohort: The Molecular Dynamic Insight and a Promising SD-OCT Indicator
Abstract
Purpose: This study investigated a three-dimensional indicator in spectral-domain optical coherence tomography (SD-OCT) and established phenotype-genotype correlation in X-linked retinoschisis (XLRS).
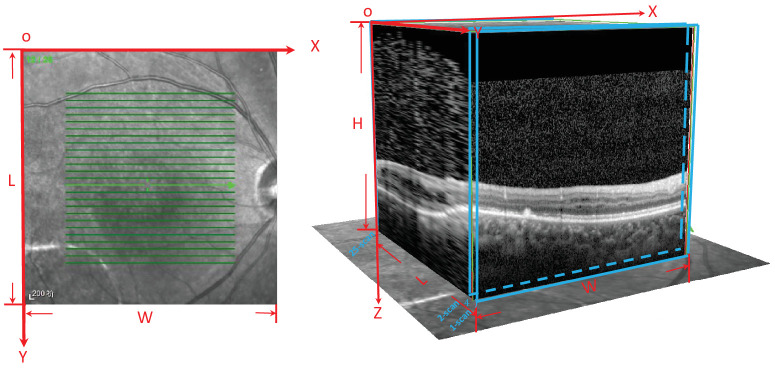
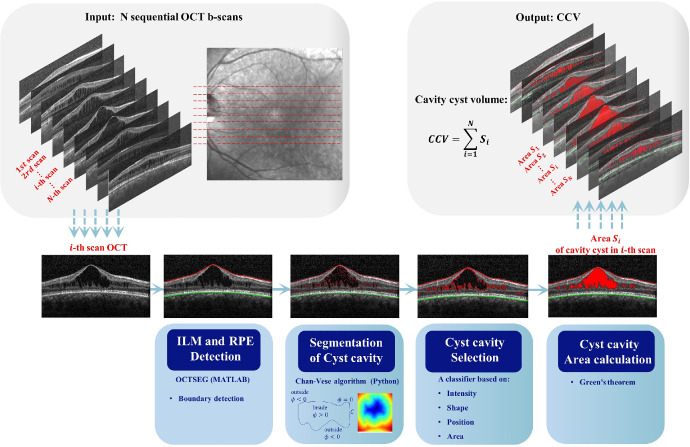
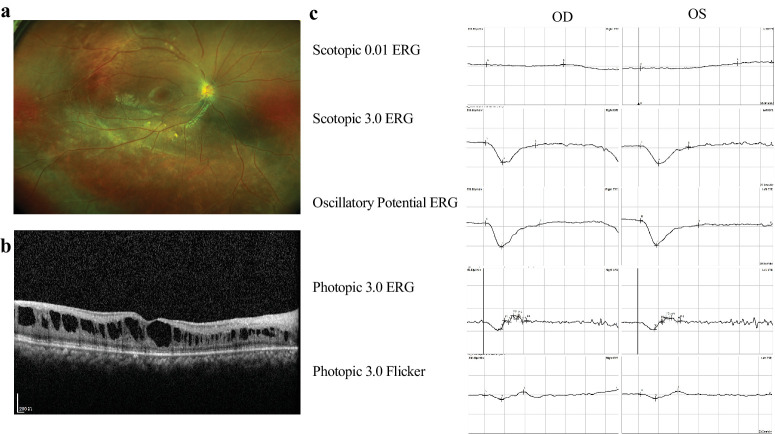
Methods: Thirty-seven patients with XLRS underwent comprehensive ophthalmic examinations, including visual acuity (VA), fundus examination, electroretinogram (ERG), and SD-OCT. SD-OCT parameters of central foveal thickness (CFT), cyst cavity volume (CCV), and photoreceptor outer segment length were assessed. CCV was defined as the sum of the areas of cyst cavities in uential B-scans, measured automatically by self-developed software (OCT-CCSEG). Structural changes of the protein associated with missense variants were quantified by molecular dynamics (MD). The correlation between genotype and phenotype was analyzed.
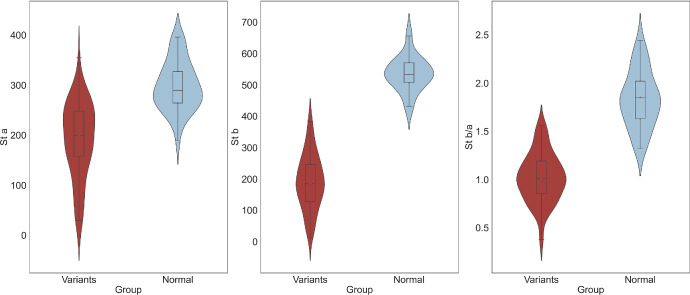
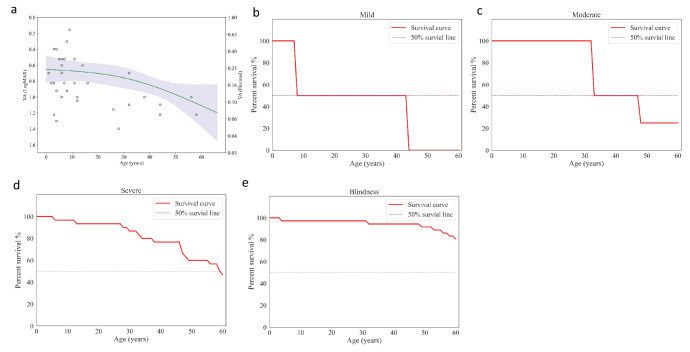
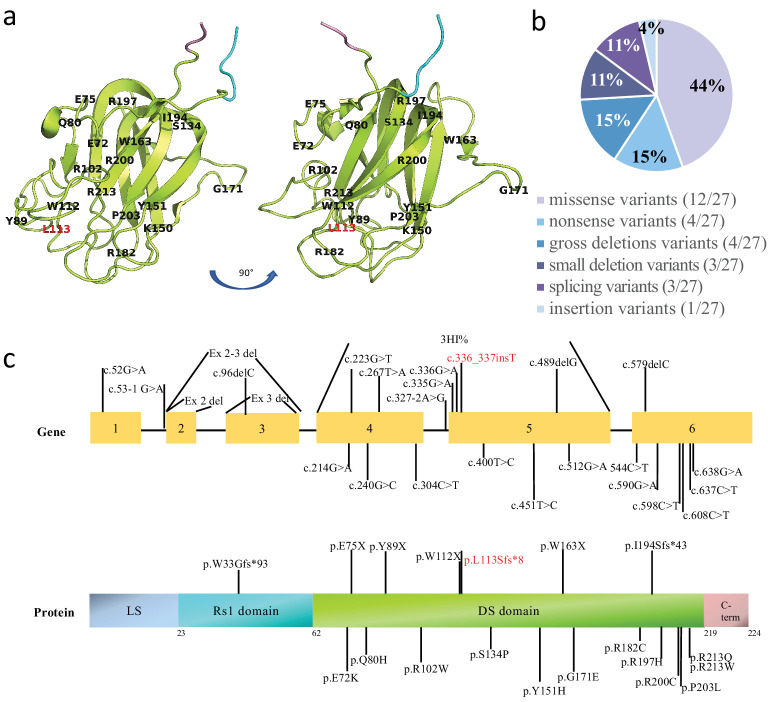
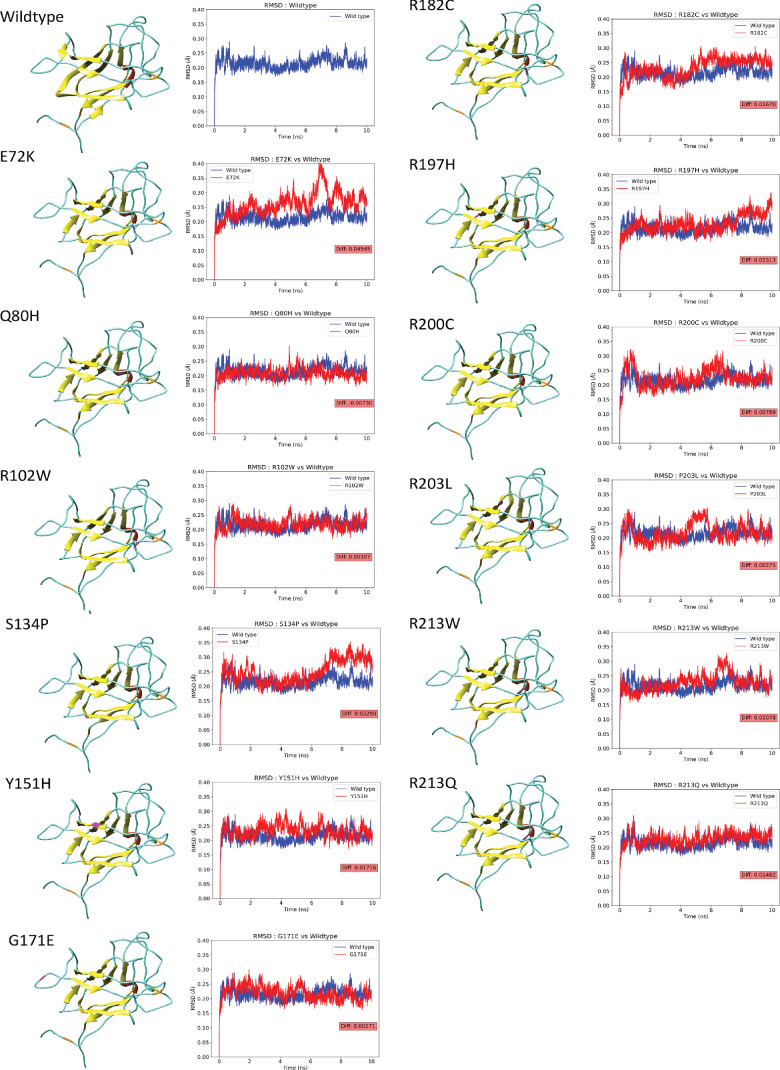
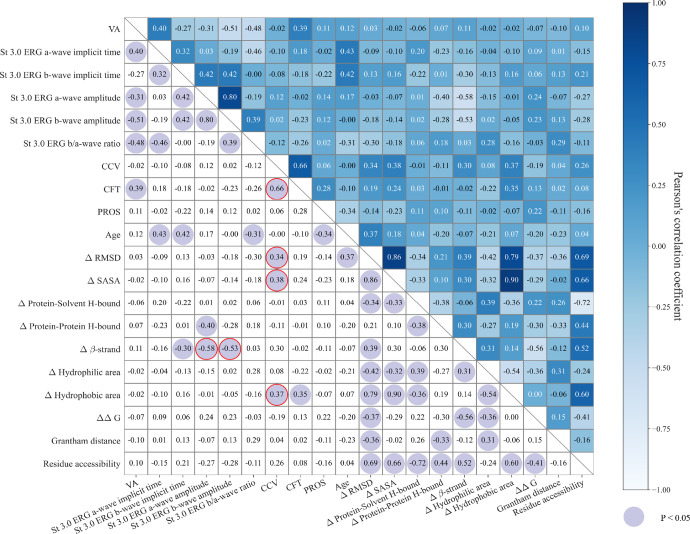
Results: Twenty-seven different RS1 variants were identified, including a novel variant c.336_337insT(p.L113Sfs*8). The average age of onset was 14.76 ± 15.75 years, and the mean VA was 0.84 ± 0.43 logMAR. The mean CCV was 1.69 ± 1.87 mm3, correlating significantly with CFT (R = 0.66; P < 0.01). In the genotype-phenotype analysis of missense variants, CCV significantly correlated with the structural effect on the protein of mutational changes referred to as wild type, including root-mean-square deviation (R = 0.34; P = 0.04), solvent accessible surface area (R = 0.38; P = 0.02), and surface hydrophobic area (R = 0.37; P = 0.03). The amplitude of scotopic 3.0 ERG a-waves and b-waves significantly correlated with the percentage change of the β-strand in the secondary structure (a-wave: R = -0.58, P < 0.01; b-wave: R = -0.53, P < 0.01).
Conclusions: CCV is a promising indicator to quantify the structural disorganization of XLRS retina. The OCT-CCSEG software calculated CCV automatically, potentially facilitating prognosis assessment and development of personalized treatment. Moreover, MD-involved genotype-phenotype analysis suggests an association between protein structural alterations and XLRS severity measured by CCV and ERG.
Conflict of interest statement
Disclosure:
Figures
References
-
- Sieving PA, MacDonald IM, Hoang S, et al. .. X-linked congenital retinoschisis. In: GeneReviews. Seattle, WA: University of Washington, Seattle; 1993. - PubMed
-
- Tantri A, Vrabec TR, Cu-Unjieng A, Frost A, Annesley WH Jr, Donoso LA. X-linked retinoschisis: a clinical and molecular genetic review. Surv Ophthalmol. 2004; 49: 214–230. - PubMed
-
- Sieving PA, Traboulsi E.. Juvenile Retinoschisis. Genetic Diseases of the Eye. New York: Oxford University Press; 1998: 347–355.
-
- Apushkin M, Fishman G.. Fundus findings and longitudinal study of visual acuity loss in patients with X-linked retinoschisis. Invest Ophthalmol Vis Sci. 2004; 45: 4026–4026. - PubMed
MeSH terms
LinkOut - more resources
Full Text Sources
