. 2024 Feb 7;20(2):e1011373.
doi: 10.1371/journal.pcbi.1011373. eCollection 2024 Feb.

Stochastic model of vesicular stomatitis virus replication reveals mutational effects on virion production

Affiliations

Stochastic model of vesicular stomatitis virus replication reveals mutational effects on virion production

Connor R King et al. PLoS Comput Biol. .

Abstract

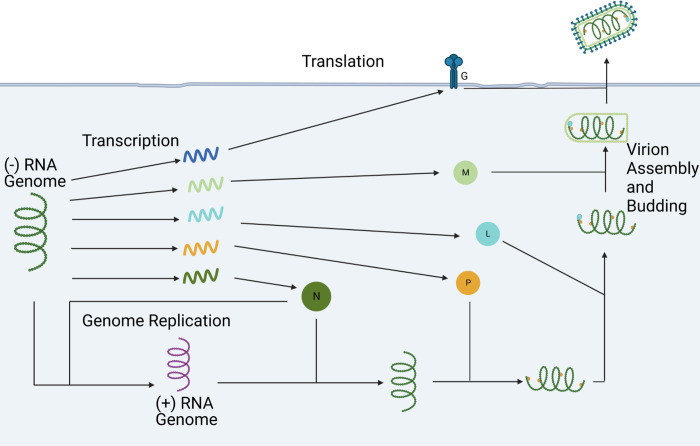
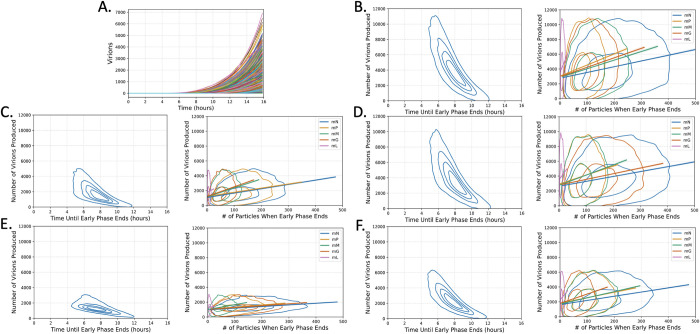
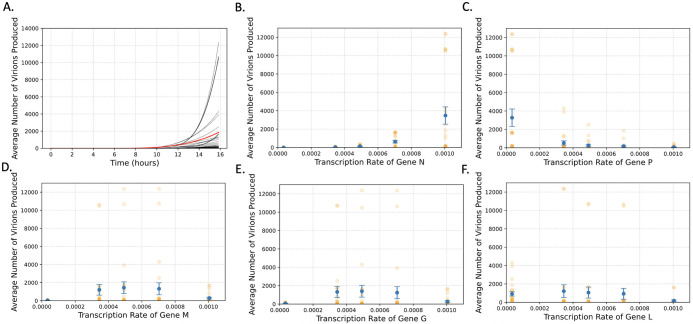
We present the first complete stochastic model of vesicular stomatitis virus (VSV) intracellular replication. Previous models developed to capture VSV's intracellular replication have either been ODE-based or have not represented the complete replicative cycle, limiting our ability to understand the impact of the stochastic nature of early cellular infections on virion production between cells and how these dynamics change in response to mutations. Our model accurately predicts changes in mean virion production in gene-shuffled VSV variants and can capture the distribution of the number of viruses produced. This model has allowed us to enhance our understanding of intercellular variability in virion production, which appears to be influenced by the duration of the early phase of infection, and variation between variants, arising from balancing the time the genome spends in the active state, the speed of incorporating new genomes into virions, and the production of viral components. Being a stochastic model, we can also assess other effects of mutations beyond just the mean number of virions produced, including the probability of aborted infections and the standard deviation of the number of virions produced. Our model provides a biologically interpretable framework for studying the stochastic nature of VSV replication, shedding light on the mechanisms underlying variation in virion production. In the future, this model could enable the design of more complex viral phenotypes when attenuating VSV, moving beyond solely considering the mean number of virions produced.


Conflict of interest statement

The authors have declared that no competing interests exist.

Figures

Fig 1
Fig 1. Simplified Model of Vesicular Stomatitis Virus.
Visual representation of the simplified model used in this paper. Every molecule depicted has a degradation reaction associated with it that is not represented here.
Fig 2
Fig 2. VSV infections that exit the early phase of infection earlier with more mRNA present produce more virions.
(A) 1000 stochastic simulations of wild-type VSV showing the number of virions produced over time. (B-F) Left: Kernel density estimate (KDE) plots of the number of virions produced vs. the time until the early phase ends. Right: KDE plots of the quantity of each mRNA species present when the early phase ends, along with the 99% CI line of best fit, for variants (B) NMGPL, (C) NGMPL, (D) NMPGL, (E) NPMGL (wild-type), and (F) NGPML. All mRNA species show a weakly positive correlation (0.2 < r < .39) with the number of virions produced, except for mL which has a very weak correlation (0 < r < .19) in all variants.
Fig 3
Fig 3. N and P gene position most strongly influence virion production in gene shuffled VSV variants.
(A) The average number of virions produced over time for all 120 variants. The trajectory of the wild-type variant is in red. (B-F) The average number of virions produced as a function of gene position (which determines the transcription rate) for genes (B) N, (C) P, (D) M, (E) G, and (F) L. The error bars represent the standard error of the mean, and the orange dots represent the individual variants.
Fig 4
Fig 4. N gene position most strongly influences the percentage of infections that are aborted.
The average percent of infections aborted as a function of the gene position of genes (A) N, (B) P, (C) M, (D) G, and (E) L for all 120 variants. The gene position is directly related to transcription rate of each gene. The error bars are the standard error of the mean and the orange dots represent the individual variants.
Fig 5
Fig 5. Parameter scans reveal the influence of L, M, and G genes on virion production.
These graphs show how adjusting the transcription rates of each gene by a percentage of the value of the parameter in (A) WT and (B) the optimal variant (NMGLP) influences the number of virions produced. The black dotted line shows the mean number of virions produced by those variants.

References

    1. Liu G, Cao W, Salawudeen A, Zhu W, Emeterio K, Safronetz D, et al.. Vesicular Stomatitis Virus: From Agricultural Pathogen to Vaccine Vector. Pathogens. 2021;10(9). Epub 20210827. doi: 10.3390/pathogens10091092 ; PubMed Central PMCID: PMC8470541. - DOI - PMC - PubMed
    1. Lichty BD, Power AT, Stojdl DF, Bell JC. Vesicular stomatitis virus: re-inventing the bullet. Trends Mol Med. 2004;10(5):210–6. doi: 10.1016/j.molmed.2004.03.003 . - DOI - PubMed
    1. Overend C, Yuan LJ, Peccoud J. The synthetic futures of vesicular stomatitis virus. Trends in Biotechnology. 2012;30(10):497–8. doi: 10.1016/j.tibtech.2012.06.002 WOS:000309946600001. - DOI - PMC - PubMed
    1. Piedra FA, Henke D, Rajan A, Muzny DM, Doddapaneni H, Menon VK, et al.. Modeling nonsegmented negative-strand RNA virus (NNSV) transcription with ejective polymerase collisions and biased diffusion. Front Mol Biosci. 2022;9:1095193. Epub 20230109. doi: 10.3389/fmolb.2022.1095193 ; PubMed Central PMCID: PMC9868645. - DOI - PMC - PubMed
    1. Banerjee AD, Abraham G, Colonno RJ. Vesicular stomatitis virus: mode of transcription. J Gen Virol. 1977;34(1):1–8. doi: 10.1099/0022-1317-34-1-1 - DOI - PubMed