. 2024 Feb 7;16(733):eadh8162.
doi: 10.1126/scitranslmed.adh8162. Epub 2024 Feb 7.

Exonic knockout and knockin gene editing in hematopoietic stem and progenitor cells rescues RAG1 immunodeficiency

Affiliations

Exonic knockout and knockin gene editing in hematopoietic stem and progenitor cells rescues RAG1 immunodeficiency

Maria Carmina Castiello et al. Sci Transl Med. .

Abstract

Recombination activating genes (RAGs) are tightly regulated during lymphoid differentiation, and their mutations cause a spectrum of severe immunological disorders. Hematopoietic stem and progenitor cell (HSPC) transplantation is the treatment of choice but is limited by donor availability and toxicity. To overcome these issues, we developed gene editing strategies targeting a corrective sequence into the human RAG1 gene by homology-directed repair (HDR) and validated them by tailored two-dimensional, three-dimensional, and in vivo xenotransplant platforms to assess rescue of expression and function. Whereas integration into intron 1 of RAG1 achieved suboptimal correction, in-frame insertion into exon 2 drove physiologic human RAG1 expression and activity, allowing disruption of the dominant-negative effects of unrepaired hypomorphic alleles. Enhanced HDR-mediated gene editing enabled the correction of human RAG1 in HSPCs from patients with hypomorphic RAG1 mutations to overcome T and B cell differentiation blocks. Gene correction efficiency exceeded the minimal proportion of functional HSPCs required to rescue immunodeficiency in Rag1-/- mice, supporting the clinical translation of HSPC gene editing for the treatment of RAG1 deficiency.


Conflict of interest statement

Competing interests: MCC, A. Villa, LN, SF, SP, NS, PG, DC and AJ are inventors of patents (“Polynucleotides useful for correcting mutations in the RAG1 gene”, International Publication No. WO2023062030A1, Inventors: A. Villa, LN, SF, MCC, SP, DC. “Replacement of RAG1 for use in therapy”, International Publication No. WO2022079054A1, Inventors: A. Villa, PG, LN, NS, MCC, SF. “Enhancing efficiency and tolerability of gene editing in primary cells”, International Publication No. WO2020002380A1, Inventors: PG, LN, AJ, SF.) pertaining to the results presented in the paper owned and managed by the San Raffaele Scientific Institute and Telethon Foundation. LN is a founder, equity owner consultant of GeneSpire, a biotechnology startup developing LV-based liver gene transfer and hematopoietic cell gene editing. The other authors declare that they have no competing interests.

Figures

Figure 1.
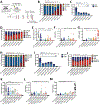
Figure 1.. Immune reconstitution in competitive transplant experiments
A. Schematics\ of competitive transplant of CD45.1 WT Lineage negative (Lin) cells admixed at different ratio with CD45.2 Rag1−/− (Rag1-KO) cells in conditioned Rag1-KO mice. Immune reconstitution was assessed over time in peripheral blood and at termination by collecting bone marrow (BM), thymus and spleen. In vivo T-cell dependent response was evaluated by TNP-KHL challenge. B. Live double-negative (DN) CD4CD8, double-positive (DP) CD4+CD8+, single positive (SP) CD4+CD8 and CD8+CD4 cells were analyzed at termination by flow cytometry and shown as proportion of live thymocytes (WT untreated n=10; 70–100% WT n=32; 15–30% WT n=4; 10–15% WT n=7; 5–10% WT n=14; 0–5% WT n=18; 100% KO n=20). C. Splenic CD3+CD4+ and CD3+CD8+ T-cell counts are shown (WT untreated n=7; 70–100% WT n=30; 15–30% WT n=4; 10–15% WT n=7; 5–10% WT n=14; 0–5% WT n=17; 100% KO n=9). D. B-cell differentiation was analyzed by flow cytometry and shown as proportion of live BM B cells according to the following immunophenotype: PreProB cells B220+CD43+CD24, ProB cells B220+CD43+CD24+, PreB cells B220+CD43IgM, Immature cells B220+CD43IgMhi, Mature recirculant cells (Mature rec.) B220hiCD43IgMint/high (WT untreated n=10; 70–100% WT n=33; 15–30% WT n=4; 10–15% WT n=7; 5–10% WT n=15; 0–5% WT n=19; 100% KO n=24). E. Splenic B-cell counts. F-G. Immunoglobulin G (IgG, F) and B-cell activating factor (BAFF, G) concentrations were analyzed in plasma 16 weeks after the transplant. H. Thymopoiesis in Rag1-KO mice transplanted with CD45.1/2 Rag+/ (HETERO) Lin- cells admixed at different ratio with CD45.2 KO Lin cells (WT untreated n=10; 70–100% WT n=32; 70–100% HETERO n=14; 50–60% HETERO n=5; 35–50% HETERO n=2; 7–15% HETERO n=4; 0–5% HETERO n=5; 100% KO n=20). I. Splenic CD4+ and CD8+ T-cell counts in Rag1-KO mice transplanted with HETERO Lin cells (WT untreated n=10; 70–100% WT n=30; 70–100% HETERO n=14; 50–60% HETERO n=6; 35–50% HETERO n=3; 7–15% HETERO n=4; 0–5% HETERO n=5; 100% KO n=9). J. B-cell differentiation in BM of Rag1-KO mice transplanted with HETERO Lin cells (WT untreated n=10; 70–100% WT n=30; 70–100% HETERO n=14; 50–60% HETERO n=6; 35–50% HETERO n=3; 7–15% HETERO n=4; 0–5% HETERO n=5; 100% KO n=24). K. Splenic B-cell counts in Rag1-KO mice transplanted with HETERO Lin cells. L and M. Immunoglobulin G (IgG, L) and B-cell activating factor (BAFF, M) concentrations were analyzed in plasma of Rag1-KO mice transplanted with HETERO Lin cells 16 weeks after the transplant. B-M. One-way ANOVA, Kruskal-Wallis test was used to assess statistically significant differences; asterisks were colored according to the legend; n.p., statistical analysis not performed when sample size was <5; arrows at the end of bars indicate the group to which all comparisons are statistically significant. P values are showed as: *≤0.05; **≤0.01; ***≤0.001; ****≤0.0001.
Figure 2.
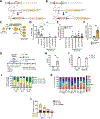
Figure 2.. Development and impact of intronic gene editing strategies on human HSPCs
A and B. Schematics of GE strategies exploiting the hRAG1 intronic target site and two distinct corrective donor templates: the SA-co.hRAG1-BGHpA, including the polyA sequence derived from Bovine Growth Hormone gene (BGH) (A), and the SA-co.hRAG1-SD which allows the use of the endogenous 3’ UTR sequence (B). Panels were created using www.BioRender.com. C. Schematic of the GE protocol in NALM6-RAG1.KO cells edited by gRNA 9 and SA-co.hRAG1-BGHpA or SA-co.hRAG1-SD AAV6 donor. Bulk edited cells were single-cell sorted and mono- and bi-allelic edited clones were identified by ddPCR. D. RAG1 recombination activity was measured as proportion of GFP+ cells gated on transduced CD4+ cells in edited and unedited NALM6 cells (as bulk and single clones) assessed 7 days after serum-starvation by flow cytometry. One-way ANOVA, Kruskal-Wallis test was used to assess statistically significant differences. E and F. Expression of co.hRAG1 CDS in edited NALM6-RAG1.KO clones and controls (unedited bulk NALM6-RAG1.KO cells) (E) and endogenous hRAG1 in unedited NALM6-WT cells (F) were assessed 4 days after serum-starvation. Wilcoxon matched-pair test was used to assess statistically significant differences. G. Schematic of the GE protocol in human HSPCs. H. Percentage of HDR-edited alleles in untreated (UT) and gene edited (GE) HD mPB-HSPCs measured by ddPCR 4 days after editing. Mann-Whitney test was used to assess statistically significant differences. I. Percentage of HDR-edited alleles was measured by ddPCR 4 days after editing in untreated (UT) and gene edited (GE) mPB-HSPCs derived from HDs and patients with RAG1 deficiency (RAG1-PTs). J. Analysis of culture composition of mPB-HSPCs derived from HDs (n=3) and patient cells was performed by flow-cytometry four days after editing. K. Multiparametric dissection analysis of HSPC composition was performed before the prestimulation phase (d-3) and 1 day after the GE procedure (d+1) in unedited (UT) and edited (GE) cells. Graphs show 20 subtypes analysed in the Lineage negative (Lin) CD34+ gate including: hematopoietic stem cells (HSC), multipotent progenitors (MPP), multi-lymphoid progenitors (MLP), early T progenitors (ETP), B and NK cell precursors (Pre-B/NK), common myeloid progenitors (CMP), granulocyte-monocyte progenitors (GMP), megakaryo-erythroid progenitors (MEP), megakaryocyte progenitors (MKp) and erythroid progenitors (EP). L. Number of colonies belonging to erythroid burst forming units (BFU-E), granulocyte-macrophage colony forming units (CFU-GM), and granulocyte, erythroid, macrophage, megakaryocyte units (CFU-GEMM). P values are showed as: *≤0.05; **≤0.01; ***≤0.001; ****≤0.0001.
Figure 3.
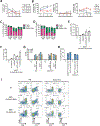
Figure 3.. Suboptimal correction efficiency of intronic gene editing strategy in HD and RAG1-patient HSPCs
A. Kinetics of human CD45+ engraftment in peripheral blood of NSG mice transplanted with HD and RAG1-patient mPB-HSPCs unedited (UT) or edited (GE) by g9/Cas9 RNP and SA-co.hRAG1-BGHpA AAV6 donor in presence of GSE56. B. Kinetics of human B cell (hCD19+), T cell (hCD3+) and Myeloid cell (hCD13+) reconstitution in peripheral blood shown as proportion of total human CD45+ cells. C and D. Immune cell composition in BM (C) and spleen (D) of NSG mice transplanted with unedited or edited HD and RAG1-patient mPB-HSPCs; sample size is shown in the legend of panel A. E. Number of live cells harvested 4 weeks after ATOs seeding with HD mPB-HSPCs edited by g9/Cas9 RNP and SA-co.hRAG1-BGHpA AAV6 donor in presence of different HDR-enhancers. F. Percentage of HDR-edited alleles measured in ATO-derived cells 4 weeks after ATOs seeding with mPB HD-HSPCs. G-H. Percentage of HDR-edited alleles measured in ATO-cells (6 weeks after ATOs seeding (G)) or in mPB-HSPCs (4 days after GE, H) derived from HD and patients with RAG1 deficiency and edited by g9/Cas9 RNP and SA-co.hRAG1-BGHpA or SA-co.hRAG1-SD AAV6 donor in presence of GSE56 and Ad5-E4orf6/7. I. Representative plots of T-cell differentiation in ATOs (gated on live CD45+CD56 cells) 6 weeks after the seeding with HD and RAG1-patients mPB-HSPCs untreated or edited by g9 and SA-co.hRAG1-BGHpA or SA-co.hRAG1-SD AAV6 donor in presence of GSE56 and Ad5-E4orf6/7.
Figure 4.
Figure 4.. Functional correction of hRAG1 expression and function mediated by exonic gene editing strategies
A and B. Schematic representation of the targeting (A) and replacement (B) gene editing strategies targeting hRAG1 exon 2. Panels were created using www.BioRender.com. C. Graph shows proportion of GFP+ cells measured 7 days after serum starvation by flow cytometry as surrogate of RAG1 recombination activity in unedited bulk NALM6-WT (Bulk WT), unedited bulk NALM6-RAG1.KO (Bulk RAG1.KO) cells and in NALM6-RAG1.KO clones edited by g6ex/Cas9 RNP and targeting (Targ) or replacement AAV6 donor (Repl). Square with dot is for bi-allelic clone; full-colored square symbols indicate samples assayed in parallel. One-way ANOVA, Kruskal-Wallis test was used to assess statistically significant differences. D. Expression of co.hRAG1 assessed before and 4 days after starvation in edited NALM6-RAG1.KO clones in parallel to unedited WT and NALM6-RAG1.KO controls. Wilcoxon matched-pair test was used to assess statistically significant differences. E. Editing efficiency in terms of percentage of NHEJ- and HDR- edited alleles was evaluated in HD mPB-HSPCs edited by g6ex/Cas9 RNP alone or transduced with targeting (Targ) or replacement (Repl) corrective AAV6 donors. Mean values are shown into the columns (n of independent HDs = 3,4,4). F. Functional correction of RAG1 recombinase activity in NALM6-RAG1.KO clones edited by g11ex/Cas9 RNP and g13ex/Cas9 RNP with targeting or replacement AAV6 donors measured by GFP+ cells 7 days after starvation induced by CDK4/6i. Square with dot is for bi-allelic clone; full-colored square symbols indicate samples assayed in parallel. One-way ANOVA, Kruskal-Wallis test was used to assess statistically significant differences. G. Expression of co.hRAG1 CDS assessed before and 4 days after starvation in edited NALM6-RAG1.KO clones. H. Editing efficiency in terms of percentage of NHEJ- and HDR- edited alleles evaluated in HD mPB-HSPCs edited by g11ex/Cas9 RNP or g13ex/Cas9 RNP alone or transduced with targeting (Targ) or replacement (Repl) corrective AAV6 donors. Mean values are shown into the columns (n of independent HDs: g11ex n=4, g11ex/Targ n=2, g11ex/Repl n=2, g13ex n=5, g13ex/Targ n=3, g13ex/Repl 3). P values are showed as: *≤0.05; **≤0.01; ***≤0.001; ****≤0.0001.
Figure 5.
Figure 5.. Functional rescue of hRAG1 defects by exonic gene editing of RAG1-patient HSPCs
A. Percentage of HDR-edited alleles measured by ddPCR 4 days after editing in HD and RAG1-patient mPB-HSPCs edited by g11ex/Cas9 or g13ex/Cas9 RNP and targeting (Targ) or replacement (Repl) AAV6 donor in the presence of editing enhancers (GSE56 and Ad5-E4orf6/7). B. Composition of unedited and edited HD and patient-derived HSPCs evaluated by flow cytometry 4 days after editing. C. Kinetics of human CD45+ engraftment in peripheral blood of NSG mice transplanted with HD and RAG1-patient (Pt_1) mPB-HSPCs unedited (UT) or edited by g13ex/Cas9 RNP and targeting (Targ) or replacement (Repl) AAV6 donor in presence of editing enhancers. D. Kinetics of human B cell (hCD19+), T cell (hCD3+) and myeloid cell (hCD13+) reconstitution in peripheral blood shown as proportion of total human CD45+ cells. E. Hematopoietic cell composition in BM of transplanted NSG mice. F. Differentiation stages of B-cell lymphopoiesis in BM of transplanted NSG mice was evaluated by flow cytometry according to the following immunophenotype: Pro-B, CD34+CD19CD22+; Pre-BI, CD34+CD19+; large Pre-BII, CD34CD19+CD10+CD20; small Pre-BII, CD34CD19+CD10+CD20int; immature, CD34CD19+CD10+CD20+; mature circulant, CD34CD19+CD10CD20+. G. Proportion of live CD3+TCRα/β+ cells gated on single positive CD4+ cells (SP4) was measured by flow cytometry in thymocytes isolated from transplanted NSG mice. H and I. Proportion of differentiated live CD3+TCRα/β+ T cells was measured at indicated weeks (wks) in ATOs seeded with HD (H) and RAG1-patient (RAG1 Pt_1, I) mPB-HSPCs edited with g11ex or g13ex and targeting (/T) or replacement (/R) AAV6 donors in presence of editing enhancers. J. Percentage of HDR-edited alleles in sorted T-cell subsets harvested from ATOs 6 weeks after seeding. Analysis was not done in samples indicated by § asterisk because of few cell numbers. K. Packcircle plots displaying abundance of TCRB rearrangements in bulk cells harvested 7.5 weeks after ATO seeding with HD and RAG1-patient mPB-HSPCs edited by g13ex/Cas9 RNP and Replacement (Repl) AAV6 donor. L. Simpson complexity index measuring the sample clonality (ranging from 0 for a properly diverse population, to 1 for a monoclonal population) in CD3+TCRα/β+ cells sorted 6.5 weeks upon ATO-seeding or in bulk ATO cells 7.5 weeks upon ATO-seeding.
Figure 6.
Figure 6.. Comparison of AAV6 and IDLV as delivery platforms for RAG1 GE in HSPCs
A. Schematic representation of AAV6 and IDLV deliveries for the GE strategies targeting the hRAG1 exon 2. B. Editing efficiency in terms of percentage of NHEJ- and HDR- edited alleles evaluated in HD mPB-HSPCs edited by g13ex/Cas9 RNP alone or transduced with AAV6 and IDLV targeting (Targ) or replacement (Repl) corrective donors evaluated 4 days after editing. Mean values are shown into the columns (n. of independent HDs: g13ex n6, AAV6 Targ n=6, AAV6 Repl n=4, IDLV Targ n=6, IDLV Repl n=4). C. Percentage of HDR-edited alleles measured in sorted HSPC subsets, from the most committed (CD34) to the most primitive subpopulation (CD34+CD133+CD90+). Mean values are shown into the columns (n of independent HDs: AAV6 Targ,n=3, AAV6 Repl n=1, IDLV Targ n=3, IDLV Repl n=1). D. Composition of unedited and edited HD HSPCs evaluated by flow cytometry 4 days after editing (n. of independent HDs: UT n=3, g13ex n=4, AAV6 Targ n=4, AAV6 Repl n=3, IDLV Targ n=4, IDLV Repl n=2. E. Number of colonies belonging to erythroid burst forming units (BFU-E), granulocyte-macrophage colony forming units (CFU-GM), and granulocyte, erythroid, macrophage, megakaryocyte units (CFU-GEMM). Mean values are shown into the columns (n. of independent HDs: UT n=4, g13ex n=4, AAV6 Targ n=4, AAV6 Repl n=4, IDLV Targ n=4, IDLV Repl n=3. F. Graph shows proportion of GFP+ cells measured 7 days after serum starvation by flow cytometry as surrogate of RAG1 recombination activity in unedited bulk NALM6-WT (Bulk WT), unedited bulk NALM6-RAG1.KO (Bulk RAG1.KO) cells and in NALM6-RAG1.KO clones edited by g13ex/Cas9 RNP and targeting (Targ) or replacement IDLV donor (Repl). One-way ANOVA, Kruskal-Wallis test was used to assess statistically significant differences. G. Expression of co.hRAG1 assessed before and 4 days after starvation in edited NALM6-RAG1.KO clones in parallel to unedited WT and NALM6-RAG1.KO controls. Wilcoxon matched-pair test was used to assess statistically significant differences. P values are showed as: *≤0.05; **≤0.01; ***≤0.001; ****≤0.0001.

References

    1. Schatz DG, Swanson PC, V(D)J Recombination: Mechanisms of Initiation. Annu Rev Genet 45, 167–202 (2011). - PubMed
    1. Dvorak CC, Haddad E, Heimall J, Dunn E, Cowan MJ, Pai S-Y, Kapoor N, Satter LF, Buckley RH, O’Reilly RJ, Chandra S, Bednarski JJ, Williams O, Rayes A, Moore TB, Ebens CL, Davila Saldana BJ, Petrovic A, Chellapandian D, Cuvelier GDE, vander Lugt MT, Caywood EH, Chandrakasan S, Eissa H, Goldman FD, Shereck E, Aquino VM, Desantes KB, Madden LM, Miller HK, Yu L, Broglie L, Gillio A, Shah AJ, Knutsen AP, Andolina JP, Joshi AY, Szabolcs P, Kapadia M, Martinez CA, Parrot RE, Sullivan KE, Prockop SE, Abraham RS, Thakar MS, Leiding JW, Kohn DB, Pulsipher MA, Griffith LM, Notarangelo LD, Puck JM, The diagnosis of severe combined immunodeficiency: Implementation of the PIDTC 2022 Definitions. Journal of Allergy and Clinical Immunology 151, 547–555.e5 (2023). - PMC - PubMed
    1. Villa A, Notarangelo LD, RAG gene defects at the verge of immunodeficiency and immune dysregulation. Immunol Rev 287, 73–90 (2019). - PMC - PubMed
    1. Delmonte OM, Schuetz C, Notarangelo LD, RAG Deficiency: Two Genes, Many Diseases. J Clin Immunol 38, 646–655 (2018). - PMC - PubMed
    1. Notarangelo LD, Kim M-S, Walter JE, Lee YN, Human RAG mutations: biochemistry and clinical implications. Nat Rev Immunol 16, 234 (2016). - PMC - PubMed

Publication types