. 2024 Mar 5;36(3):484-497.e6.
doi: 10.1016/j.cmet.2024.01.008. Epub 2024 Feb 6.

Itaconate impairs immune control of Plasmodium by enhancing mtDNA-mediated PD-L1 expression in monocyte-derived dendritic cells

Affiliations

Itaconate impairs immune control of Plasmodium by enhancing mtDNA-mediated PD-L1 expression in monocyte-derived dendritic cells

Theresa Ramalho et al. Cell Metab. .

Abstract

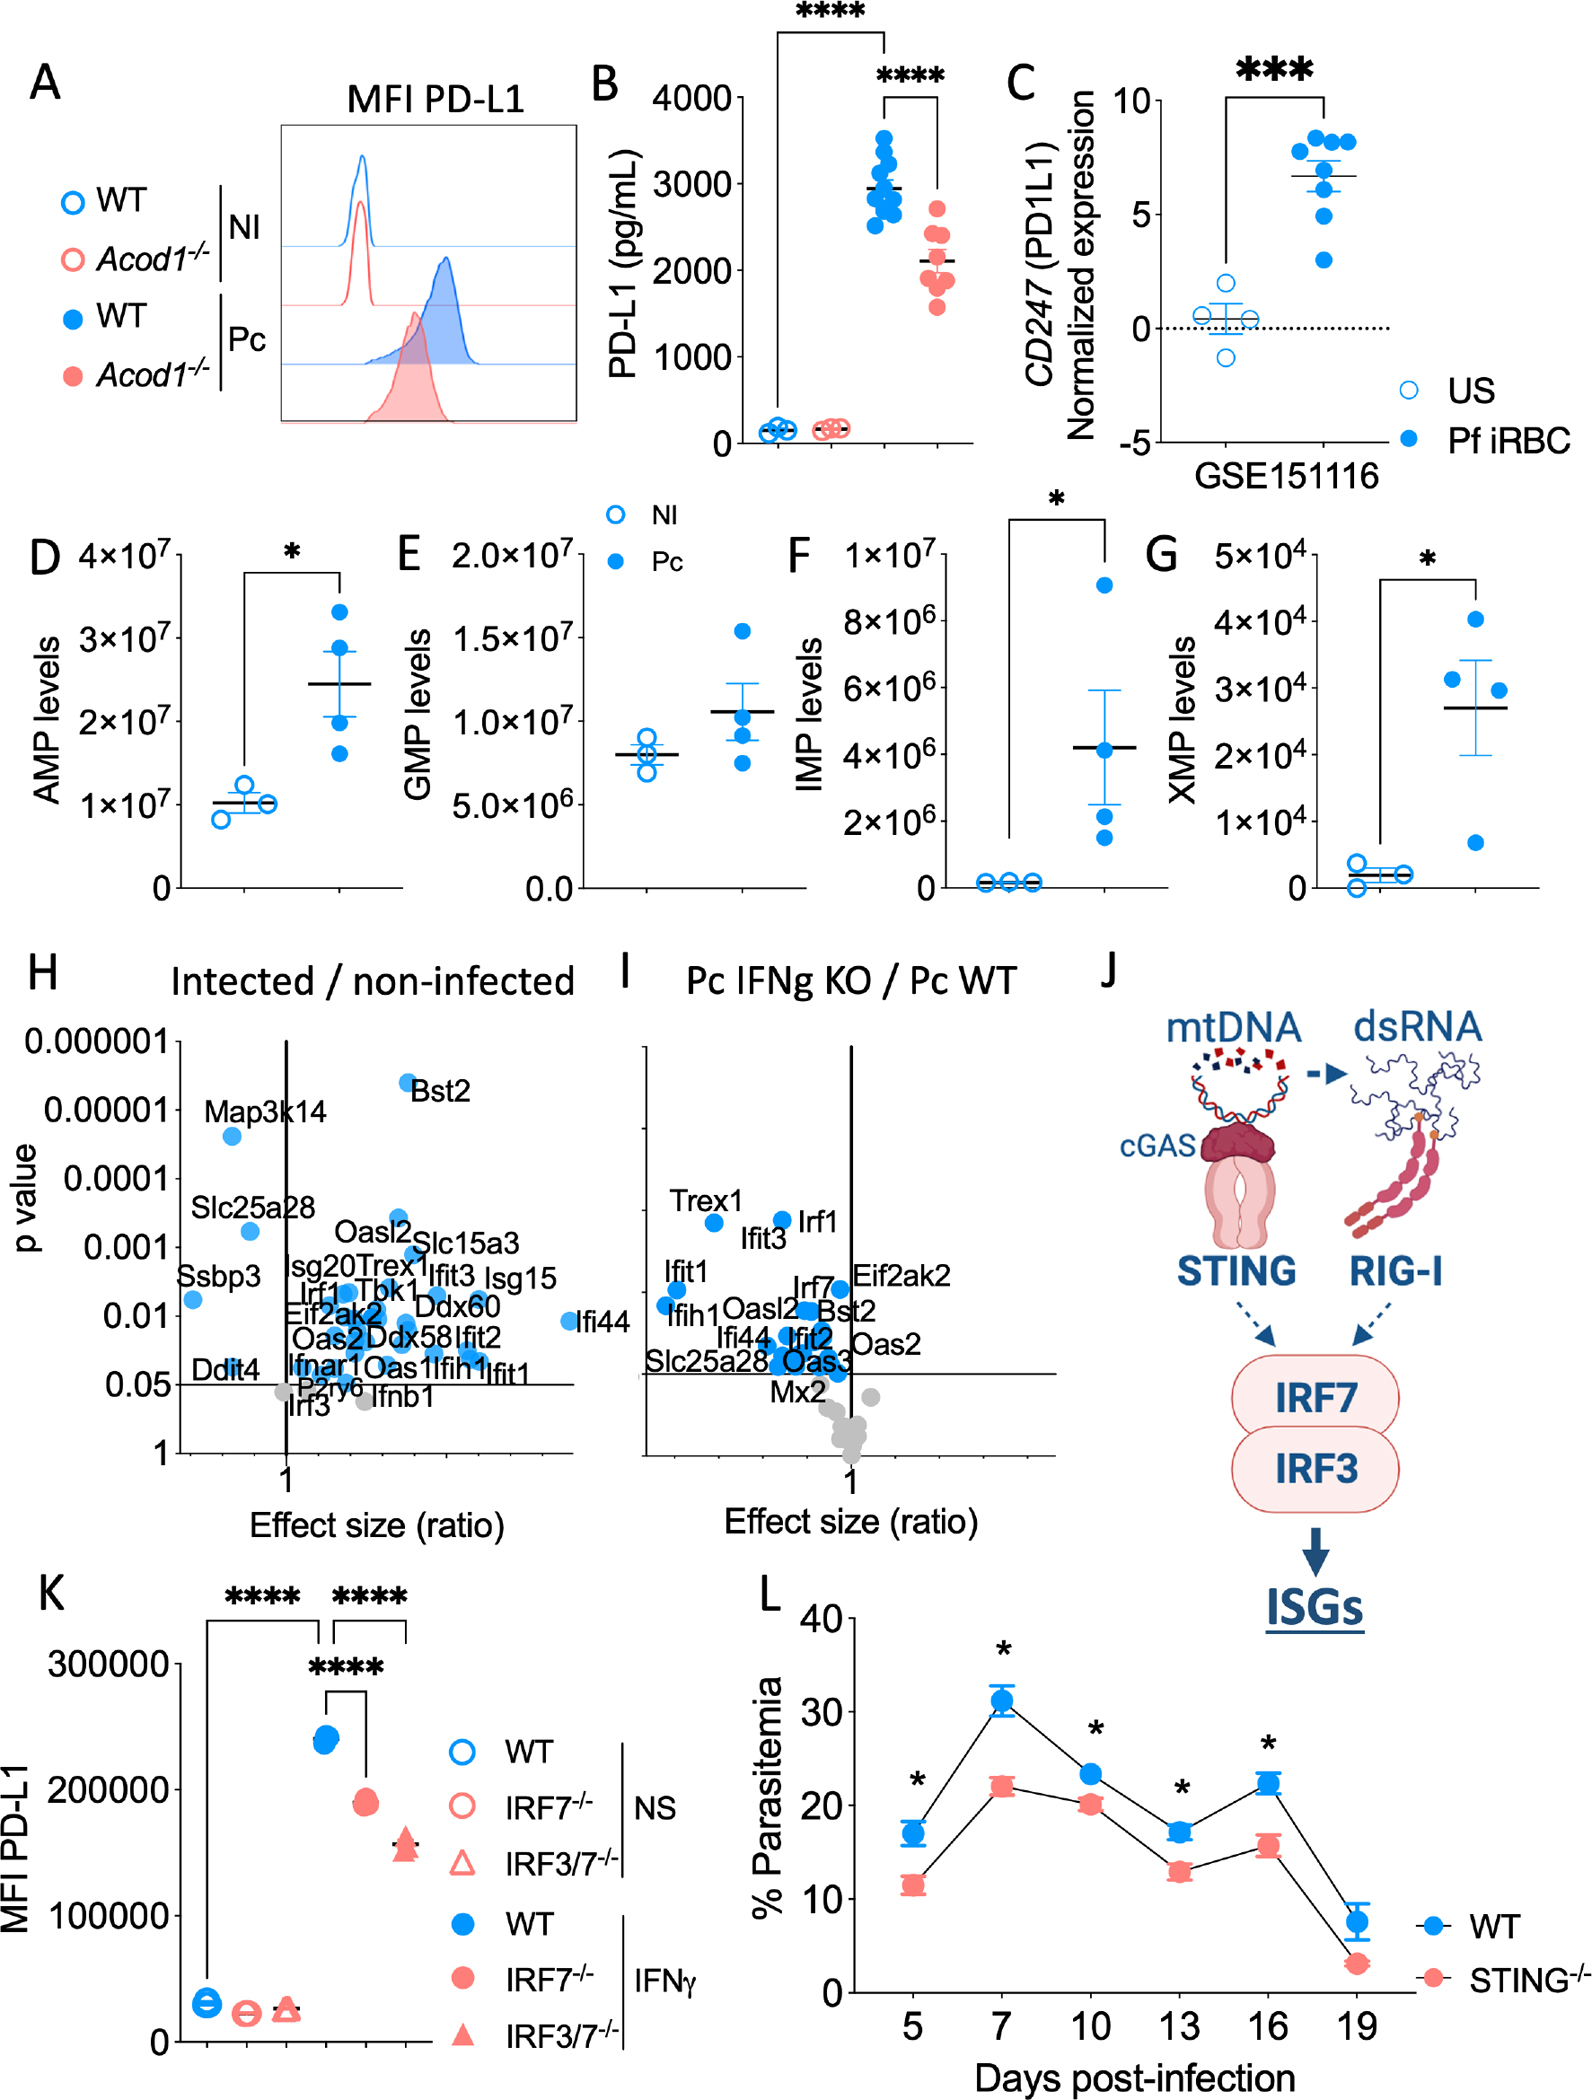
Severe forms of malaria are associated with systemic inflammation and host metabolism disorders; however, the interplay between these outcomes is poorly understood. Using a Plasmodium chabaudi model of malaria, we demonstrate that interferon (IFN) γ boosts glycolysis in splenic monocyte-derived dendritic cells (MODCs), leading to itaconate accumulation and disruption in the TCA cycle. Increased itaconate levels reduce mitochondrial functionality, which associates with organellar nucleic acid release and MODC restraint. We hypothesize that dysfunctional mitochondria release degraded DNA into the cytosol. Once mitochondrial DNA is sensitized, the activation of IRF3 and IRF7 promotes the expression of IFN-stimulated genes and checkpoint markers. Indeed, depletion of the STING-IRF3/IRF7 axis reduces PD-L1 expression, enabling activation of CD8+ T cells that control parasite proliferation. In summary, mitochondrial disruption caused by itaconate in MODCs leads to a suppressive effect in CD8+ T cells, which enhances parasitemia. We provide evidence that ACOD1 and itaconate are potential targets for adjunct antimalarial therapy.

Keywords: PD-1; PD-L1; Plasmodium chabaudi; TCA cycle; cGAS-STING; immuno checkpoint markers; inate immunity; itaconate; itaconic acid; lymphocytes; malaria; metabolism; methylenesuccinic acid; mitochondria; mitochondrial DNA; monocyte-derived dendritic cells; mtDNA.


Conflict of interest statement

Declaration of interests The authors declare no competing interests.

Figures

Figure 1.
Figure 1.. IFNγ enhances glucose metabolism during differentiation of monocyte-derived dendritic cells in P. chabaudi-infected mice.
Schematic of techniques used to assess MODCs in the mouse spleen (A). Glucose uptake with 2DG radioisotope in total splenocytes of Pc-infected and non-infected (NI) mice (B); data are from three experiments with a pool of 3 animals per group in each experiment. Extracellular acidification rate (ECAR) in CD11b+ splenocytes from Pc-infected mice compared to NI mice ex vivo (C); data are from a pool of two experiments with n=5 NI mice and n=10 infected mice. Detection of MODC frequency (D), MFI of dendritic cell (DC) markers DCSign (E), MHCII (F), and GLUT1 (G) expression in total spleen of WT or IFNγRLysMCre mice, Pc-infected or NI; data are from a pool of two experiments with n=3 NI mice and n=5 infected mice. GLUT1 expression in CD11b+ splenocytes from Pc-infected and NI mice (H); the uncropped image is in Data S1. Detection of DC markers DCSign and MHCII (I) for determination of MODC frequency (J), and GLUT1 MFI (K) under IFNγ stimuli; data are from a pool of two experiments with n=4 uninfected mice. All experiments were repeated 2 or 3 times yielding similar results. * p < 0.001–0.05 by Student’s t-test performed between two groups; One-way ANOVA followed by Tukey’s post-hoc test was performed among three or more groups.
Figure 2.
Figure 2.. Glucose oxidation disrupts the TCA cycle in monocyte-derived dendritic cells of P. chabaudi-infected mice.
Schematic of techniques used to assess metabolites and transcripts in MODCs from infected mice (A). Fold change of differentially expressed genes (DGEs) in Pc-infected WT mice relative to non-infected (NI) WT mice (B), and fold change of DGEs in Pc-infected IFNγ−/− mice relative to Pc-infected WT mice (C); data are from two experiments pooled with n=3 mice in each group. Volcano plot showing the fold change and p-values in metabolite intensity values of Pc-infected WT mice relative to NI WT mice; data are from two experiments pooled with n=3 samples in NI mice, and n=4 samples in the infected group, with 5 mice pooled per sample (D). A cross-analysis of the metabolome and transcriptome established the metabolic phenotype of MODCs (E). Itaconate levels in the plasma of Pc-infected mice; two experiments pooled with n=5 mice in the infected group (F). The ratio of itaconate/fumarate was calculated from intensity values of each metabolite in the metabolome of Pc-infected or NI mice (G); data are from two experiments pooled with n=3 samples from the NI group and n=4 samples from the infected group, with 5 mice pooled per sample. Experiments in B–D, F, and G were repeated 2 or 3 times yielding similar results. RNA-seq performed in monocytes from NI individuals (n=5) or individuals infected with P. vivax (n=5). Fold change in gene expression of P. vivax-infected relative to NI individuals (H). Identification of the itaconate signature in the plasma from P. vivax-infected individuals (I) n=15 in each experimental group, or ACOD1 expression in monocytes stimulated or not with P. falciparum-infected erythrocytes; data are from n=4 samples in non-stimulated monocytes and n=8 samples in monocytes stimulated with iRBCs (J). * p < 0.001–0.05 by Student’s t-test performed between two groups.
Figure 3.
Figure 3.. Mitochondria functionality is compromised in monocyte-derived dendritic cells from P. chabaudi-infected mice.
Volcano plot of the fold change and p-values of lipid intensity values of Pc-infected (Pc) WT mice relative to non-infected (NI) WT mice (A). Intensity values of ADP (B) and ATP (C) in the metabolome of MODCs from infected or NI WT mice. Results from the lipidome and metabolome were pooled from two experiments with n=3 samples in the NI group and n=4 samples in the infected group, with five mice pooled per sample. SDHB expression in CD11b+ splenocytes selected from Pc-infected or NI mice; uncropped images are in Data S1 (D). Mitochondrial functionality in MODCs of Pc-infected or MO (monocytes) in NI mice (E). Maximal respiration (G) and aconitate levels (H) in CD11b+ splenocytes isolated from Pc-infected mice treated with UK5099 or DMSO from two experiments pooled with n=7 mice per group. Maximal respiration and aconitate levels in CD11b+ splenocytes isolated from Pc-infected mice treated with Etomoxir (G) or DMSO (H) from two experiments pooled with n=6 mice per group. Itaconate levels in the supernatant of CD11b+ splenocytes treated with UK5099 or Etomoxir from two experiments pooled with n=7 mice per group* p < 0.001–0.05 by Student’s t-test performed between two groups. Experiments were repeated 2 or 3 times yielding similar results.
Figure 4.
Figure 4.. PPARγ activation sustains the differentiation and metabolic state of monocyte-derived dendritic cells.
Heatmap showing the relative expression of markers of the PPARγ pathway in MODCs from Plasmodium berghei Anka (PbA)-infected or non-infected (NI) mice (A); results shown were pooled from two experiments with n=2 NI mice and n=3 infected mice. Western blots to analyze PPARγ in CD11b+ splenocytes from WT or IFNγRLysMCre mice that were Pc-infected or NI (B, C). GLUT (D) and ACOD1 (E) expression in CD11b+ splenocytes from NI or Pc-infected WT or PPARγLysMCre mice; uncropped images are in Data S1. Aconitate (F) and itaconate (G) levels in CD11b+ splenocytes from Pc-infected mice treated ex vivo with GW9662; data are from two experiments pooled with n=7 mice per group. Frequency of MODCs in CD11b+ splenocytes from NI or Pc-infected WT or PPARγLysMCre mice (H); data are from two experiments pooled with n=8 mice in each group. Expression of PD-L1 in MODCs (I) from two experiments pooled with n=3 NI mice and n=6 infected mice, and systemic levels of IFNγ in WT or PPARγLysMCre mice that were NI or Pc-infected (J); data are from two experiments pooled with n=4 mice per group. Parasitemia in WT or PPARγLysMCre mice (K) from two experiments pooled with n=6 mice per group. Model showing IFNγ-induced differentiation of MODCs in vivo and in vitro leads to enhanced PPARγ expression and function, promoting itaconate synthesis that culminates in the expression of GLUT1 and PD-L1 by MODCs from Pc-infected mice (L). Experiments were repeated 2 or 3 times yielding similar results. * p < 0.001–0.05 by Student’s t-test performed between two groups. One-way ANOVA followed by Tukey’s post-hoc test was performed among three or more groups.
Figure 5.
Figure 5.. Endogenous itaconate regulates immune responses in P. chabaudi-infected mice.
CD11b+ splenocytes from WT or Acod1−/− mice that were P. chabaudi (Pc)-infected or non-infected (NI), were incubated ex vivo, and the supernatant harvested after 4 h. The changes in itaconate (A), succinate (B), and mesaconate (C) levels were assessed by ultra-high resolution mass spectrometry from two experiments pooled with n=5 NI mice and n=10 infected mice. The levels of TNFα (D), IL-6 (E), and IL-10 (F) were measured by cytometric bead array from two experiments pooled with n=5 NI mice and n=10 infected mice. In the plasma of WT or Acod1−/− mice that were Pc-infected or NI, itaconate (G) and mesaconate (H) levels were assessed by mass spectrometry from two experiments pooled with n=3 for the NI group and n=6 for the infected group. The IFNγ (I), IL-6 (J), and IL-10 (K) levels were quantified by cytometric bead array from two experiments pooled with n=3 for the NI group and n=6 for the infected group. Experiments were repeated 2 or 3 times yielding similar results. * p < 0.001–0.05 by Student’s t-test performed between two groups. One-way ANOVA followed by Tukey’s post-hoc test was performed among three or more groups.
Figure 6.
Figure 6.. PD-L1 expression on MODCs is induced by STING-IRF3/IRF7.
Expression of PD-L1 by MODCs of P. chabaudi (Pc)-infected and non-infected (NI) WT or Acod1−/− mice (A). Quantification of PD-L1 in the plasma of P. chabaudi (Pc)-infected or non-infected (NI) WT or Acod1−/− mice from two experiments pooled with n=3 in the NI group and n=6 in the infected group (B). Human monocytes stimulated with Pf-iRBCs (C); data are from n=4 unstimulated samples and n=8 Pf-stimulated samples. Levels of AMP (D), GMP (E), IMP (F), and XMP (G) in the metabolome of MODCs from Pc-infected and NI mice from two experiments pooled with n=3 samples in the NI group and n=4 samples in the infected group, with 5 mice pooled per sample. Volcano plot showing the fold change and p values in gene expression values of Pc-infected relative to NI WT mice (H), and fold change and p values in gene expression values of Pc-infected IFNγ−/− relative to Pc-infected WT mice (I); data are from two experiments pooled with n=3 in each group. Schematic showing IRF3 and IRF7 activation by STING and RIG-I (J). Expression of PD-L1 in non-stimulated iBMDMs and in IFNγ-stimulated WT, IRF3−/−, IRF7−/−, and IRF3/IRF7 double knockout mice (K); data are from three experiments pooled with n=3 per group. Parasitemia from WT and STING−/− mice infected with Pc (L); data are from two experiments pooled with n=6 per group. Experiments were repeated 2 or 3 times yielding similar results. * p < 0.001–0.05 by Student’s t-test performed between two groups. One-way ANOVA followed by Tukey’s post-hoc test was performed among three or more groups.
Figure 7.
Figure 7.. Endogenous itaconate limits the activation of CD8+ T cells and enhances susceptibility to P. chabaudi infection.
Detection of T-bet (A), IFNγ (B), and CXCR3 (C) in splenic CD4+ T cells from WT or Acod1−/− mice infected or not with P. chabaudi (Pc). The expression of the same activation markers was also evaluated in CD8+ T cells (D, E, and F); data are from two experiments pooled with n=4 in the non-infected group and n=10 in the infected group. Human dataset ID GSE174791 from the Gene Expression Omnibus was used to evaluate the expression of PDCD1 in T cells from P. falciparum-infected individuals (n=10) compared to non-infected individuals (n=10) (G). Parasitemia levels calculated from the blood smears of Pc-infected WT and Acod1−/−mice (H). Parasitemia levels calculated from the blood smears of Pc-infected Acod1−/− mice treated or not with anti-alpha-CD8 antibodies (I); data are from two experiments pooled with n=6 infected mice per group. Experiments were repeated 2 or 3 times yielding similar results. * p < 0.001–0.05 by Student’s t-test performed between two groups. One-way ANOVA followed by Tukey’s post-hoc test was performed among three or more groups.

Comment in

References

    1. Monroe A, Williams NA, Ogoma S, Karema C, and Okumu F (2022). Reflections on the 2021 World Malaria Report and the future of malaria control. Malar J 21, 154. 10.1186/s12936-022-04178-7. - DOI - PMC - PubMed
    1. Schofield L, and Grau GE (2005). Immunological processes in malaria pathogenesis. Nat Rev Immunol 5, 722–735. 10.1038/nri1686. - DOI - PubMed
    1. Clark IA, Budd AC, Alleva LM, and Cowden WB (2006). Human malarial disease: a consequence of inflammatory cytokine release. Malar J 5, 85. 10.1186/1475-2875-5-85. - DOI - PMC - PubMed
    1. Pålsson-McDermott EM, and O’Neill LAJ (2020). Targeting immunometabolism as an anti-inflammatory strategy. Cell Res 30, 300–314. 10.1038/s41422-020-0291-z. - DOI - PMC - PubMed
    1. Martínez-Reyes I, and Chandel NS (2020). Mitochondrial TCA cycle metabolites control physiology and disease. Nat Commun 11, 102. 10.1038/s41467-019-13668-3. - DOI - PMC - PubMed

Publication types