. 2024 Feb 7;12(2):e008566.
doi: 10.1136/jitc-2023-008566.

Systemically administered low-affinity HER2 CAR T cells mediate antitumor efficacy without toxicity

Affiliations

Systemically administered low-affinity HER2 CAR T cells mediate antitumor efficacy without toxicity

Tamer Basel Shabaneh et al. J Immunother Cancer. .

Abstract

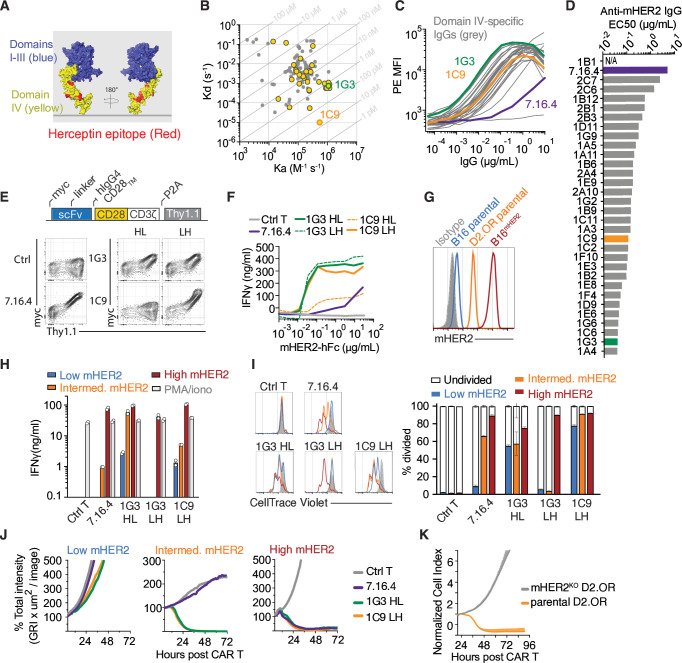
Background: The paucity of tumor-specific targets for chimeric antigen receptor (CAR) T-cell therapy of solid tumors necessitates careful preclinical evaluation of the therapeutic window for candidate antigens. Human epidermal growth factor receptor 2 (HER2) is an attractive candidate for CAR T-cell therapy in humans but has the potential for eliciting on-target off-tumor toxicity. We developed an immunocompetent tumor model of CAR T-cell therapy targeting murine HER2 (mHER2) and examined the effect of CAR affinity, T-cell dose, and lymphodepletion on safety and efficacy.

Methods: Antibodies specific for mHER2 were generated, screened for affinity and specificity, tested for immunohistochemical staining of HER2 on normal tissues, and used for HER2-targeted CAR design. CAR candidates were evaluated for T-cell surface expression and the ability to induce T-cell proliferation, cytokine production, and cytotoxicity when transduced T cells were co-cultured with mHER2+ tumor cells in vitro. Safety and efficacy of various HER2 CARs was evaluated in two tumor models and normal non-tumor-bearing mice.

Results: Mice express HER2 in the same epithelial tissues as humans, rendering these tissues vulnerable to recognition by systemically administered HER2 CAR T cells. CAR T cells designed with single-chain variable fragment (scFvs) that have high-affinity for HER2 infiltrated and caused toxicity to normal HER2-positive tissues but exhibited poor infiltration into tumors and antitumor activity. In contrast, CAR T cells designed with an scFv with low-affinity for HER2 infiltrated HER2-positive tumors and controlled tumor growth without toxicity. Toxicity mediated by high-affinity CAR T cells was independent of tumor burden and correlated with proliferation of CAR T cells post infusion.

Conclusions: Our findings illustrate the disadvantage of high-affinity CARs for targets such as HER2 that are expressed on normal tissues. The use of low-affinity HER2 CARs can safely regress tumors identifying a potential path for therapy of solid tumors that exhibit high levels of HER2.

Keywords: Adoptive cell therapy - ACT; Immune related adverse event - irAE; Relapse; T cell; Tumor infiltrating lymphocyte - TIL.


Conflict of interest statement

Competing interests: SRR was a founder, has served as an advisor, and has patents licensed to Juno Therapeutics; is a founder of and holds equity in Lyell Immunopharma; and has served on the advisory boards for Adaptive Biotechnologies, Nohla and Ervaccine. The other authors have declared that no conflict of interest exists.

Figures

Figure 1
Figure 1
Murine HER2 is expressed in similar normal tissues as human HER2. (A) Plot showing the association (Ka) and dissociation (Kd) constants of binding of individual antibodies to mHER2-hFc. Clone 1G3 is highlighted in brown. Line denotes Kd of 1E–5 S–1, the limit for undetectable dissociation within 600 s. (B) Flow-cytometric analysis of D2.0R cells (brown) and mHER2-knockout D2.0R (blue) stained with 1G3 followed by PE anti-rat antibody. (C) Representative IHC staining with 1G3 for mHER2 on subcutaneously engrafted KrasG12D/P53null (KP) murine lung cancer cells transduced with mHER2 (KPmHER2). Co-embedded spleen was used as HER2-negative control. The inset shows a high-magnification field of the tumor margins. (D) Representative IHC staining with 1G3 on the epithelial tissues of the gastrointestinal tract, liver, uterus, skin, kidney, lung, thymus, and brain of a 6-week-old C57BL/6J female. IHC, immunohistochemistry; HER2, human epidermal growth factor receptor 2; mHER2, murine HER2.
Figure 2
Figure 2
Low-affinity mHER2 CAR T cells eliminate HER2-high tumor cells and spare normal HER2+tissues. (A) Flow cytometric analysis of parental KP cells and KP cells transduced with mHER2 (KPmHER2) stained with PE-conjugated anti-rat HER2 7.16.4 or mouse IgG2a, κ isotype (gray). (B) Top: schematic of constructs encoding CARs and signaling-deficient control variant. Bottom: Expression of CAR (myc) and transduction marker (CD19t) evaluated by 96 hours after transduction. (C) IFN-γ (top) and IL-2 (bottom) levels measured by ELISA in supernatants collected at 24 hours from co-cultures of CAR T cells (E:T=2:1) with the indicated tumor cell lines. Absence of symbols indicates values below detection limit. Maximal stimulation with PMA and ionomycin is shown as a positive control. (D) Percentage lysis of 51Cr-labeled tumor cells after 4 hours of co-culture with CAR T cells and KPmHER2 cells at 10:1 ratio. (E) Proliferation of CAR T cells after stimulation with KPmHER2 cells (E:T=2:1, 48 hours). (F) Percentage lysis of 51Cr-labeled tumor cells after 24 hours of co-culture with 7.16.4 28ζ CAR or control T cells and target cells at indicated E:T ratios. (G) Proliferation of 7.16.4 HL.28ζ CAR T cells or control T cells after stimulation with target cells (E:T=2:1, 48 hours). (H) Adoptive transfer protocol: mice were implanted subcutaneously with 2×10⁵ KpmHER2 tumor cells, administered 200 mg/kg cyclophosphamide (Cy) 7 days post implantation, and 6 hours later given 1×10⁶ CD45.1+ CAR T cells or control T cells. (I) Body weight changes of tumor-bearing mice after treatment. (J) KPmHER2 tumor volumes after treatment with 7.16.4 HL.28ζ CAR or control T cells. (K) Absolute numbers of CD19t+ CAR T cells, gated on CD8+CD45.1+ cells in tumors and spleens from KPmHER2 tumor-bearing mice analyzed on day 23. (L) Survival of tumor-bearing mice treated with 7.16.4 HL.28ζ CAR or control T cells. Tumors were harvested for (M) when they ulcerated or reached size limit. (M) Representative immunohistochemistry staining for mHER2 expression in KPmHER2 tumors (left) and quantification of expression (right). Symbols represent technical replicates (C, D) or individual mice (K, M), and symbols or bars with error bars represent means±SEM (I–M) with n=2–3 mice per group and (I–K) n=3–4 mice per group (L). *, p<0.05, t-test (K, M) or analysis of variance (Šidák post hoc (J) or Tukey post hoc (D)). Log-rank test (L). CAR, chimeric antigen receptor; E:T, effector to target; IFN, interferon; IL, interleukin; HER2, human epidermal growth factor receptor 2; mHER2, murine HER2; PMA, phorbol myristate acetate; TIL, tumor-infiltrating lymphocyte.
Figure 3
Figure 3
Enhancing the CAR affinity lowers the antigen threshold for T-cell activation in vitro. (A) Alphafold model of human HER extracellular domain (AF-P70424-F1) with domain IV in yellow and the 3D epitope of trastuzumab, as previously reported, highlighted in red. (B) Isoaffinity plot showing association (Ka) and dissociation (Kd) constants of binding of various antibodies to immobilized monomeric mHER2.His, with diagonal lines representing the equilibrium constants (KD). Yellow symbols indicate clones that bind both the full extracellular domain and domain-IV of mHER2 (see online supplemental table 2 for values). Clones 1G3 and 1C9 are highlighted in green and orange, respectively. (C) Sigmoidal binding of mHER2-domain-IV-specific antibodies to parental D2.0R cells determined by flow cytometry after staining with the respective IgG followed by PE anti-rat antibody. (D) Calculated EC50 values of anti-mHER2 IgGs for binding to D2.0R. “N/A” denotes inability to calculate EC50 due to poor binding. (E) Top: schematic of constructs encoding mHER2 CARs. Bottom: expression of 1G3 and 1C9 CARs in the HL and LH formats measured by staining for the myc tag, compared with 7.16.4 HL CAR and transduction-marker-only control T cells. (F) IFN-γ levels measured by ELISA in the supernatants of the indicated CAR T cells stimulated for 24 hours with solid phase-coated mHER2. (G) Flow cytometric analysis of mHER2 expression on parental B16, parental D2.0R, and mHER2-high B16 tumor cells after staining with 1G3 or isotype control (gray). (H) IFN-γ levels measured by ELISA in supernatants of co-cultures of the indicated CAR T cells and parental B16, parental D2.0R, and B16mHER2 tumor cells (E:T=2:1, 24 hours) expressing low, intermediate, or high levels of mHER2, respectively. Maximal stimulation with PMA and ionomycin used as a positive control. (I) Proliferation of indicated CAR T cells after stimulation with parental B16, parental D2.0R, and B16mHER2 target cells (E:T=2:1, 48 hours). Left: CellTrace Violet dilution at 48 hours. Right: Bar graph showing % of CAR T cells undergoing at least one division. (J) Fluorescence-based cytotoxicity assay measuring the cytotoxicity of indicated CAR T cells against target cells expressing low, intermediate, or high levels of mHER2 (E:T=10:1). (K) Impedance-based cytotoxicity assay measuring cytolytic activity of 1C9.LH CAR T cells against wild-type or mHER2KO D2.0R cells at E:T ratio of 10:1. Symbols represent technical replicates (H) and bars with error bars represent means±SEM (I) with n=3 (H–K). CAR, chimeric antigen receptor; E:F, effector to target; IFN, interferon; HER2, human epidermal growth factor receptor 2; HL, variable fragment heavy chain and light chain; LH, variable fragment light chain and heavy chain; MFI, mean fluorescence intensity; mHER2, murine HER2; PMA, phorbol myristate acetate.
Figure 4
Figure 4
High-affinity mHER2.CAR T cells do not improve antitumor function in vivo and elicit on-target off-tumor toxicity. (A) Schematic of adoptive transfer protocol. Cohorts of mice were implanted subcutaneously with 4×10⁵ B16 parental or B16mHER2 tumor cells, administered 200 mg/kg cyclophosphamide (Cy) 10 days post tumor implantation and 6 hour later given 1×10⁶ CD45.1+ CAR T cells or control T cells. (B) Average body weight changes relative to baseline in parental B16 or B16mHER2 tumor-bearing mice. (C–D) Mice were sacrificed on day eight post infusion and flow cytometry was used to determine the absolute number of Thy1.1+ CAR T cells and their dual expression of PD-1 and Tim-3 in the spleens (C) and tumors (D) of tumor-bearing mice treated with the indicated CAR T cells. (E) Survival curves of tumor-bearing mice treated with the indicated CAR T cells. Symbols with error bars represent means±SEM (B) and symbols represent individual mice (C,D) with n=4–5 mice per group (B–D) 7–8 (E). *<0.05, **<0.01, ***<0.001, ****<0.0001 by analysis of variance (Dunnett post hoc) (B–D). CAR, chimeric antigen receptor; E:T, effector to target; HL, variable fragment heavy chain and light chain; LH, variable fragment light chain and heavy chain; mHER2, murine human epidermal growth factor receptor 2; PD-1, programmed cell death receptor 1; TIL, tumor-infiltrating lymphocyte; Tim-3, T cell immunoglobulin and mucin domain-containing protein 3.
Figure 5
Figure 5
Factors that affect off-tumor on-target toxicity of mHER2.CAR T cells. (A) Top: average body weight changes in mice treated with 200 mg/kg Cy (unless otherwise stated) prior to infusion with the indicated number of CAR T cells. Bottom: frequency of CAR T cells relative to total CD8+ T cells in blood in each group of mice. Dashed lines represent the starting weight (100%) and the endpoint requiring euthanasia (80%). (B–C) Top: average body weight changes in mice treated with various doses of Cy (B) or total body radiation (C) prior to infusion of 3×10⁶ CAR T cells. Bottom: frequency of CAR T cells relative to total CD8+ T cells in blood. (D) Cytokine levels on day 4 (solid color) and 8 (outlined color) by Mouse Luminex Discovery Assay in serum of mice treated with indicated lymphodepletion regimen prior to infusion with 3×10⁶ CAR T cells. Red symbols indicate 1C9 LH cohort mice that died post day 4. (E) Serum chemistry analysis on day 7 in mice treated with 200 mg/kg Cy and infused with 1×10⁷ CAR T cells. (F) Representative H&E stains of small intestine on day 7 from mice treated with 200 mg/kg Cy and 3×10⁶ control, 7.16.4, or 1C9 LH CAR T cells. (G) Left: representative IHC staining of CD3+lymphocytes in lung, uterus, and intestinal tissues. Mice were treated with various doses of Cy and infused with 3×10⁶ CAR T cells and tissues were harvested on day 8 post infusion. Right: percentage of CD3+cells relative to the total number of cells on the stained slide. (H) Lungs and small intestines from mice treated as in (D) and analyzed by flow cytometry on day 8 for the percentage and absolute numbers of Thy1.1+ CAR T cells, gated on CD8+CD45.1+ cells. †Indicates that mice died prior to tissue harvest and were not analyzed. Symbols represent individual mice (D, G, H) and symbols with error bars represent means±SEM (A–C, E) with n=3 mice per group (A–C, E) n=5–9 mice per group (D) or n=5–6 mice per group (G). *<0.05, **<0.01, ***<0.001, ****<0.0001 by analysis of variance with Dunnett post hoc (A–B) Sidak post hoc (C) top, (E, H) Bonferroni post hoc (C) bottom, or Tukey post hoc (D, G). Line represents the Luminex limit of detection (D) or levels measured in untreated mice (E) mean of n=3. CAR, chimeric antigen receptor; CCL, C-C motif chemokine ligand; CXCL, C-X-C motif chemokine ligand; Cy, cyclophosphamide; HL, variable fragment heavy chain and light chain; IFN, interferon; IL, interleukin; IP, intraperitoneal; LH, variable fragment light chain and heavy chain; mHER2, mHER2, murine human epidermal growth factor receptor 2; MCP, monocyte chemoattractant protein; MIP, macrophage inflammatory protein; TNF, tumor necrosis factor.
Figure 6
Figure 6
Selection of higher-affinity mHER2 CARs with intrinsically low in vivo toxicity does not improve antitumor efficacy. (A) Left: average body weight changes in mice treated with 500 cGy prior to infusion with 3×10⁶ mHER2 domain-IV-specific CAR T cells. Right: frequency of CAR T cells relative to total CD8+ T cells in blood. Truncated lines and †indicate lethality. (B) Plot derived from (A) correlating the average body weight on day 7 with the frequency of CAR T cells in blood on day 4. R2=0.5101. Shaded area indicates CAR T cells with blood expansion that is superior to Ctrl T cells and lower toxicity than 1G3 HL. (C) Proliferation of CAR T cells after stimulation low-mHER2 target cells (E:T=2:1, 48 hours). See online supplemental table 3 for details. (D) Schematic of adoptive transfer protocol. Cohorts of 6 mice per group were implanted subcutaneously with 2×10⁵ KPmHER2 tumor cells, administered 200 mg/kg cyclophosphamide (Cy) 7 days post tumor implantation and 6 hours later given 3×10⁶ CD45.1+ CAR T cells or control T cells. (E) Average body weight changes relative to baseline. (F) KPmHER2 tumor volumes post treatment with indicated CAR or control T cells and statistics shown for day 15 post tumor implant. (G) Survival of KPmHER2 tumor-bearing mice treated with CAR or control T cells. Tumors were harvested for (J) when they ulcerated or reached size limit. Fractions indicate the number of tumor-free mice at end of study (day 85). (H–I) Mice were sacrificed on day 8 post infusion and flow cytometry was used to determine the absolute numbers of Thy1.1+ CAR T cells, gated on CD8+CD45.1+ cells (H) and expression levels of PD-1 and CD39 (I). (J) Representative IHC staining (left) and quantification (right) for mHER2 expression in KPmHER2 tumors harvested on the euthanasia end points indicated in (G). The number of tumors processed for IHC is indicated. Lines with error bars represent means±SEM (A,E,F) and symbols represent individual mice (H,I) and with n=3 mice per group (A,B) n=6 mice per group (E–G) or n=4 mice per group (H,I). *<0.05, **<0.01, ***<0.001, ****<0.0001 by ANOVA with Dunnett (F,I) or Tukey (H) post hoc, log-rank test (G) or ANOVA with Fisher’s LSD test (J). ANOVA, analysis of variance; CAR, chimeric antigen receptor; E:T, effector to target; HER2, human epidermal growth factor receptor 2; HL, variable fragment heavy chain and light chain; IHC, immunohistochemistry; LH, variable fragment light chain and heavy chain; MFI, mean fluorescence intensity; mHER2, murine HER2; PD-1, programmed cell death receptor 1; TIL, tumor-infiltrating lymphocytes.

References

    1. Fesnak AD, June CH, Levine BL. Engineered T cells: the promise and challenges of cancer immunotherapy. Nat Rev Cancer 2016;16:566–81. 10.1038/nrc.2016.97 - DOI - PMC - PubMed
    1. June CH, Sadelain M. Chimeric antigen receptor therapy. N Engl J Med 2018;379:64–73. 10.1056/NEJMra1706169 - DOI - PMC - PubMed
    1. Cappell KM, Kochenderfer JN. Long-term outcomes following CAR T cell therapy: what we know so far. Nat Rev Clin Oncol 2023;20:359–71. 10.1038/s41571-023-00754-1 - DOI - PMC - PubMed
    1. Kampouri E, Walti CS, Gauthier J, et al. . Managing hypogammaglobulinemia in patients treated with CAR-T-cell therapy: key points for clinicians. Expert Rev Hematol 2022;15:305–20. 10.1080/17474086.2022.2063833 - DOI - PubMed
    1. Newick K, O’Brien S, Moon E, et al. . CAR T Cell therapy for solid tumors. Annu Rev Med 2017;68:139–52. 10.1146/annurev-med-062315-120245 - DOI - PubMed

Publication types