Review
. 2024 Mar;51(1):77-94.
doi: 10.1016/j.clp.2023.12.003. Epub 2023 Dec 28.

Oxygen Targets in Neonatal Pulmonary Hypertension: Individualized, "Precision-Medicine" Approach

Affiliations
Review

Oxygen Targets in Neonatal Pulmonary Hypertension: Individualized, "Precision-Medicine" Approach

Satyan Lakshminrusimha et al. Clin Perinatol. 2024 Mar.

Abstract

Oxygen is a specific pulmonary vasodilator. Hypoxemia causes pulmonary vasoconstriction, and normoxia leads to pulmonary vasodilation. However, hyperoxia does not enhance pulmonary vasodilation but causes oxidative stress. There are no clinical trials evaluating optimal oxygen saturation or Pao2 in pulmonary hypertension. Data from translational studies and case series suggest that oxygen saturation of 90% to 97% or Pao2 between 50 and 80 mm Hg is associated with the lowest pulmonary vascular resistance.

Keywords: Alveolar oxygen; Oxygen saturation; Pulmonary vascular resistance; Superoxide anions.


Conflict of interest statement

Disclosure The authors have no conflict of interest to disclose.

Figures

Figure 1.
Figure 1.
The oxygen consumption (VO2) vs. delivery (DO2) curve. The horizontal portion of the curve depicts “delivery-independent oxygen consumption” as decrease in DO2 does not impact VO2 and metabolism remains aerobic without lactic acidosis (black hyphenated line). However, during this phase with decreasing DO2, regional oxygen saturation (rSO2) measured by near-infrared spectroscopy (NIRS) decreases due to increased oxygen extraction with decreasing DO2). Once oxygen delivery falls below the critical point (DO2-crit), oxygen consumption decreases, and this sloped portion of the curve represents “delivery-dependent oxygen consumption”. Lactic acid rapidly increases and rSO2 markedly decreases during this phase. Image Courtesy of Dr. Satyan Lakshminrusimha. Modified from references,
Figure 2.
Figure 2.
Impact of hemoglobin type, temperature and pH on hemoglobin-oxygen dissociation curve and arterio-venous oxygen difference (AVDO2). Hemoglobin A (HbA) is shown by the red line, fetal hemoglobin (HbF) by the purple line and HbF during whole body hypothermia by the dashed purple line. The pink zone refers to the “normoxemic” arterial PaO2 of 80 mmHg and venous PO2 of 40 mmHg. The blue zone refers to hypoxemic arterial PaO2 of 35 mmHg and venous PO2 of 15 mmHg. P50 is the partial pressure of oxygen at 50% oxygen saturation and is 19 mmHg for HbF and 27 mmHg for HbA. Modified from Polin R, Abman SH, Rowitch DH, Benitz WE. Fetal and Neonatal Physiology, 2-Volume Set. Vol 2: Elsevier; 2021, Chapter 109 – Developmental erythropoiesis by Timothy M. Bahr and Robin K. Ohls.
Figure 3.
Figure 3.
Site of hypoxic pulmonary vasoconstriction (HPV) and different measures of oxygenation in neonates. The precapillary pulmonary arterioles and possibly the postcapillary venules are thought to be the sensing site for HPV (red circles). The oxygen tension in these vessels is determined mainly by alveolar PAO2 and to a lesser extent by pulmonary arterial (or mixed venous) PO2. Clinically, preductal and postductal PaO2 and SpO2 can be measured along with cerebral regional SO2 (rSO2). Of these values, preductal PO2 (or SpO2) correlates closely with alveolar PAO2. Modified from Chandrasekharan et al. Image Courtesy of Dr. Satyan Lakshminrusimha..
Figure 4.
Figure 4.
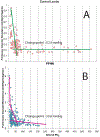
Change point in the PaO2 and PVR relationship. Data from control lambs (A) and lambs with PPHN induced by antenatal ductal ligation (B). PaO2 values are low and PVR is high in lambs with PPHN. Modified from references,
Figure 5.
Figure 5.
Oxygen saturation and pulmonary vascular resistance (PVR). A. Preductal SpO2 plotted against PVR in three models of neonatal lambs. Red squares – control lambs delivered by elective cesarean section; green triangles – asphyxia by umbilical cord occlusion with meconium aspiration syndrome and PPHN; blue circles – PPHN induced by antenatal ductal ligation. In all three models, preductal SpO2 between 90 and 97% is associated with low PVR. B. Hypothetical figure showing the relationship between PVR, SpO2 and pH. Acidosis exacerbates hypoxic pulmonary vasoconstriction (HPV). As pH decreases, the change point (SpO2 below which PVR increases) increases and the degree of HPV markedly increases.,,
Figure 6.
Figure 6.
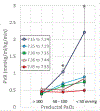
Effect of ventilation with 10% (blue zones) and 100% oxygen (pink zones) on PVR (triangles plotted on primary vertical axis) and PaO2 (circles plotted on secondary vertical axis) in newborn calves. Although PaO2 levels with 10% oxygen ventilation are low (blue circles), the pulmonary vascular resistance (PVR) is low when pH is approximately 7.35 and high when it is < 7.25. Data derived from Rudolph et al
Figure 7.
Figure 7.
Effect of pH on hypoxic pulmonary vasoconstriction. A. Data from Rawat et al – pooled data from 30 lambs with acute MAS and asphyxia ventilated with varying FiO2 from 0.21 to 1.0 sorted by pH and right carotid arterial PaO2. Data are shown as mean ± SEM. Arterial pH < 7.25 markedly increases HPV.
Figure 8.
Figure 8.
Graphic representation of a few trials conducted in different age groups comparing low vs. high SpO2 target range. The blue ovals represent the range and mortality in the lower oxygen target group and the pink ovals represent similar data from the higher target group. Preterm neonatal data are from Askie et al. Data for infants with bronchiolitis is from Cunningham et al. PICU data are from the OXY-PICU trial by Peters et al. Adult studies included were ICU-ROX trial, LOCO2 trial and Oxy-ICU trial.
Figure 9.
Figure 9.
Precision-medicine approach to oxygen saturation targets in PPHN. Optimal preductal SpO2 range based on gestational age and physiological status are shown. Image Courtesy of Dr. Satyan Lakshminrusimha.

References

    1. Sylvester JT, Shimoda LA, Aaronson PI, Ward JP. Hypoxic pulmonary vasoconstriction. Physiol Rev. 2012;92(1):367–520. - PMC - PubMed
    1. Moudgil R, Michelakis ED, Archer SL. Hypoxic pulmonary vasoconstriction. Journal of applied physiology. 2005;98(1):390–403. - PubMed
    1. Simonneau G, Montani D, Celermajer DS, et al. Haemodynamic definitions and updated clinical classification of pulmonary hypertension. Eur Respir J. 2019;53(1). - PMC - PubMed
    1. Steurer MA, Jelliffe-Pawlowski LL, Baer RJ, Partridge JC, Rogers EE, Keller RL. Persistent Pulmonary Hypertension of the Newborn in Late Preterm and Term Infants in California. Pediatrics. 2017;139(1). - PubMed
    1. Mirza H, Mandell EW, Kinsella JP, McNamara PJ, Abman SH. Pulmonary Vascular Phenotypes of Prematurity: The Path to Precision Medicine. The Journal of pediatrics. 2023;259:113444. - PMC - PubMed

Publication types