. 2024 Apr;11(15):e2309743.
doi: 10.1002/advs.202309743. Epub 2024 Feb 7.

Rna Buffering Fluorogenic Probe for Nucleolar Morphology Stable Imaging And Nucleolar Stress-Generating Agents Screening

Affiliations

Rna Buffering Fluorogenic Probe for Nucleolar Morphology Stable Imaging And Nucleolar Stress-Generating Agents Screening

Wenchao Jiang et al. Adv Sci (Weinh). 2024 Apr.

Abstract

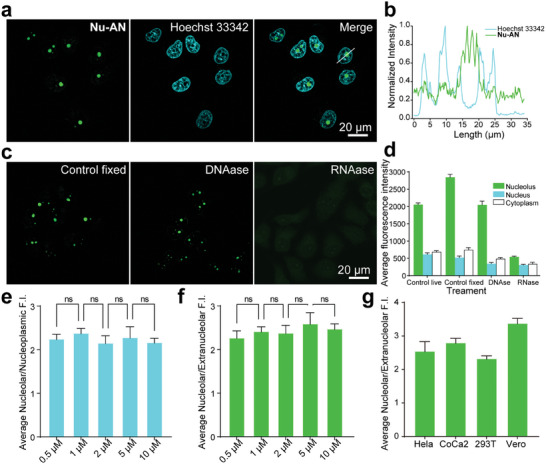
In the realm of cell research, membraneless organelles have become a subject of increasing interest. However, their ever-changing and amorphous morphological characteristics have long presented a formidable challenge when it comes to studying their structure and function. In this paper, a fluorescent probe Nu-AN is reported, which exhibits the remarkable capability to selectively bind to and visualize the nucleolus morphology, the largest membraneless organelle within the nucleus. Nu-AN demonstrates a significant enhancement in fluorescence upon its selective binding to nucleolar RNA, due to the inhibited twisted intramolecular charge-transfer (TICT) and reduced hydrogen bonding with water. What sets Nu-AN apart is its neutral charge and weak interaction with nucleolus RNA, enabling it to label the nucleolus selectively and reversibly. This not only reduces interference but also permits the replacement of photobleached probes with fresh ones outside the nucleolus, thereby preserving imaging photostability. By closely monitoring morphology-specific changes in the nucleolus with this buffering fluorogenic probe, screenings for agents are conducted that induce nucleolar stress within living cells.

Keywords: RNA. imaging; buffering; fluorogenic probes; nucleolus morphology.


Conflict of interest statement

The authors declare no conflict of interest.

Figures

Figure 1
Figure 1
a) Nu‐AN reversibly labels the nucleolus minimizing interference with the nucleolus and forming a buffer pool of dye outside the nucleolus enabling stable imaging. b) Mechanism of fluorescence activation upon Nu‐AN binding to RNA.
Figure 2
Figure 2
a) Fluorescence spectra of Nu‐AN in different solvents. b) Fluorescence quantum yield of Nu‐AN in different solvents. c) Fluorescence spectra of Nu‐AN in mixed solutions of methanol and glycerol with different volume fractions. d) Absorption spectra of Nu‐AN in the presence of different concentrations of RNA. e) Fluorescence spectra of Nu‐AN in the presence of different concentrations of RNA. f) Corresponding fluorescent intensity enhancement as a function of nucleic acid (RNA, ssDNA, and dsDNA) concentration. g) Molecular configuration before and after docking with RNA. Coloring diagram of MPP and atomic SDP of Nu‐AN. h) 2D diagram of interactions between Nu‐AN and RNA molecular docking.
Figure 3
Figure 3
a) Wash‐free imaging of living Hela cells. Hela cell was incubated with 3 µm Hoechst 33342 for an hour, followed by 2 µm Nu‐AN for 15 min. b) Normalized fluorescence intensity distribution in the region of interest. c) Fluorescent imaging of fixed Hela cells untreated, treated with DNase, or RNase. d) Average fluorescence intensity of living Hela cells, fixed Hela cells, fixed Hela cells treated with DNase, or RNase. e) The ratio of the average fluorescence intensity of the nucleolus to the nucleoplasm at different concentrations in living Hela cells. f) The ratio of the average fluorescence intensity of the nucleolus to the extranucleolar cellular region at different concentrations in living Hela cells. g) The ratio of the average fluorescence intensity of the nucleolus to the extranucleolar cellular region in different cell lines.
Figure 4
Figure 4
a) Time‐lapse confocal imaging of living Hela cells stained with Nu‐AN with no time interval. b) Relative intensity of Nu‐AN in the living Hela cell correspond to the imaging process in a). Nucleoli are assigned different pseudo colors at 0 s (red), 30 s (green), 60 s (blue), 90 s (yellow), and the merged image is in the inset. c) Confocal images of living Hela cell stained with Nu‐AN during FRAP processes. d) Relative intensity is plotted ver‐sus time (s) in the region of interest labelled in c) during FRAP processes. e) Relative intensity is plotted versus time (s) in the region of interest during five cycles of FRAP processes.
Figure 5
Figure 5
a) Confocal imaging of living Hela cells transiently expressing NPM1‐mCherry or FBL‐mCherry co‐stained with Nu‐AN. b) Morphology of nucleoli in living Hela cells treated with anti‐cancer drugs and after drugs washout under confocal microscopy. FBL‐mCherry transiently expressing living Hela cells treated with 8 nM ActD for 4 h or 10 µm Flavopiridol for 1 h, and then co‐stained with 2 µm Nu‐AN for imaging. The drug was washed off and cultured Hela cell for another 4 h, and then 2 µm Nu‐AN was added for imaging. c) Living Hela cells treated with 8 nM ActD at 0 h and 5 h, the co‐stained with 3 µm Hoechst 33342 and 2 µm Nu‐AN for confocal imaging. d) The ratio of the average area of nucleoli to nuclei of Hela cells treated with 8 nM ActD for different times and stained with 2 µm Nu‐AN. e) Confocal imaging of living Hela cells in different region. Hela cells was treated 10 µm Flavopiridol for 1 h and stained with 2 µm Nu‐AN. f) The model of morphological changes of nucleolus treated with ActD (left) or Flavopiridol (right).

Similar articles

Cited by

References

    1. a) Caragine C. M., Haley S. C., Zidovska A., Phys. Rev. Lett. 2018, 121, 141801; - PMC - PubMed
    2. b) Caragine C. M., Haley S. C., Zidovska A., Elife 2019, 8, e47533; - PMC - PubMed
    3. c) Dubois M.‐L., Boisvert F.‐M., in The Functional Nucleus, (Eds: Bazett‐Jones D. P., Dellaire G.), Springer International Publishing, Cham, 2016, pp. 29–49.
    1. Boisvert F.‐M., van Koningsbruggen S., Navascués J., Lamond A. I., Nat. Rev. Mol. Cell Biol. 2007, 8, 574. - PubMed
    1. Corman A., Sirozh O., Lafarga V., Fernandez‐Capetillo O., Trends Biochem. Sci. 2023, 48, 274. - PubMed
    1. a) Tiku V., Antebi A., Trends Cell Biol. 2018, 28, 662; - PubMed
    2. b) Tiku V., Jain C., Raz Y., Nakamura S., Heestand B., Liu W., Späth M., Suchiman H. E. D., Müller R.‐U., Slagboom P. E., Partridge L., Antebi A., Nat. Commun. 2017, 8, 16083. - PMC - PubMed
    1. a) Boulon S., Westman B. J., Hutten S., Boisvert F.‐M., Lamond A. I., Mol. Cell 2010, 40, 216; - PMC - PubMed
    2. b) Mitrea D. M., Mittasch M., Gomes B. F., Klein I. A., Murcko M. A., Nat. Rev. Drug Discov. 2022, 21, 841; - PMC - PubMed
    3. c) Yang K., Yang J., Yi J., Cell Stress 2018, 2, 125. - PMC - PubMed

MeSH terms

LinkOut - more resources