. 2024 Feb 7;15(1):1148.
doi: 10.1038/s41467-024-45324-w.

Androgen drives melanoma invasiveness and metastatic spread by inducing tumorigenic fucosylation

Affiliations

Androgen drives melanoma invasiveness and metastatic spread by inducing tumorigenic fucosylation

Qian Liu et al. Nat Commun. .

Abstract

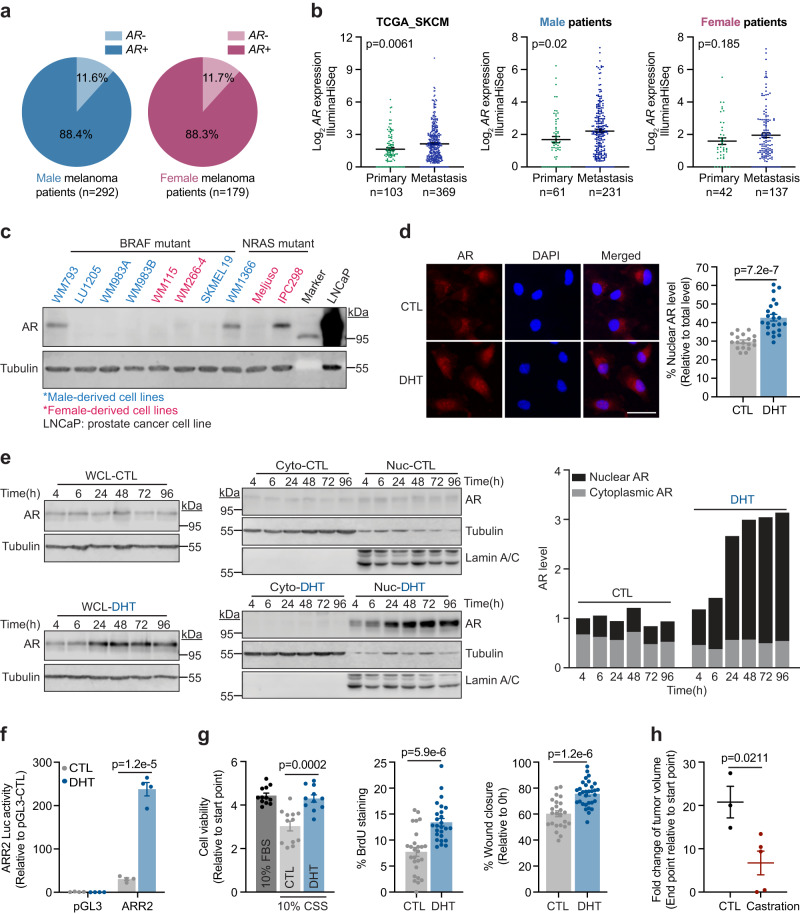
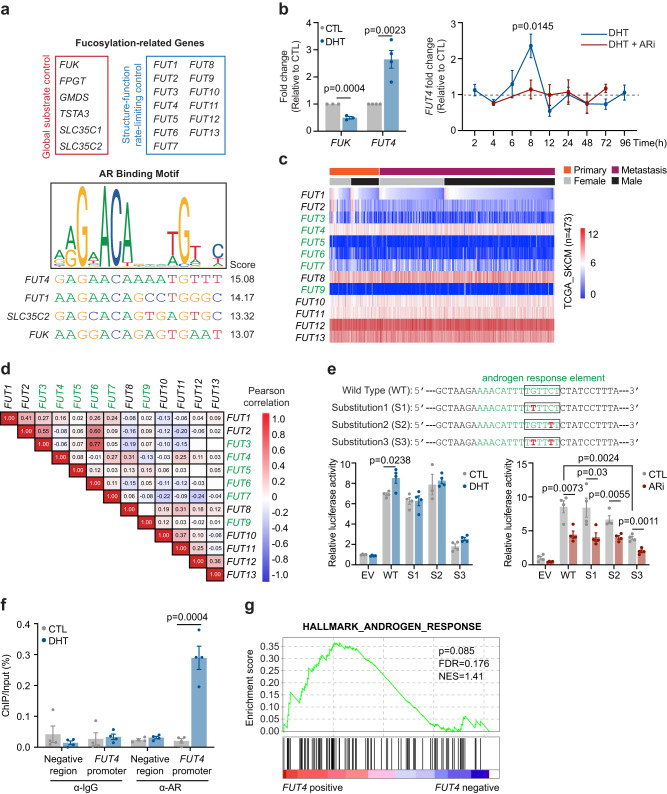
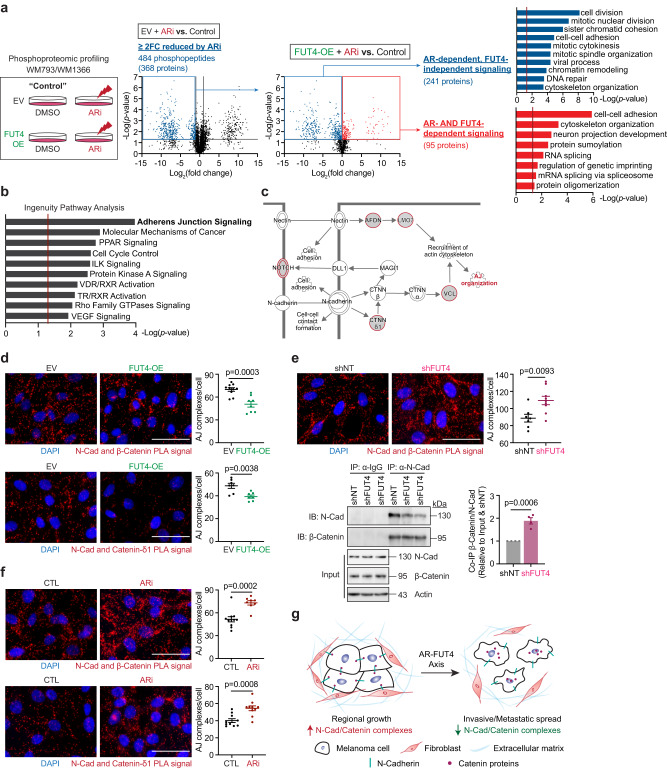
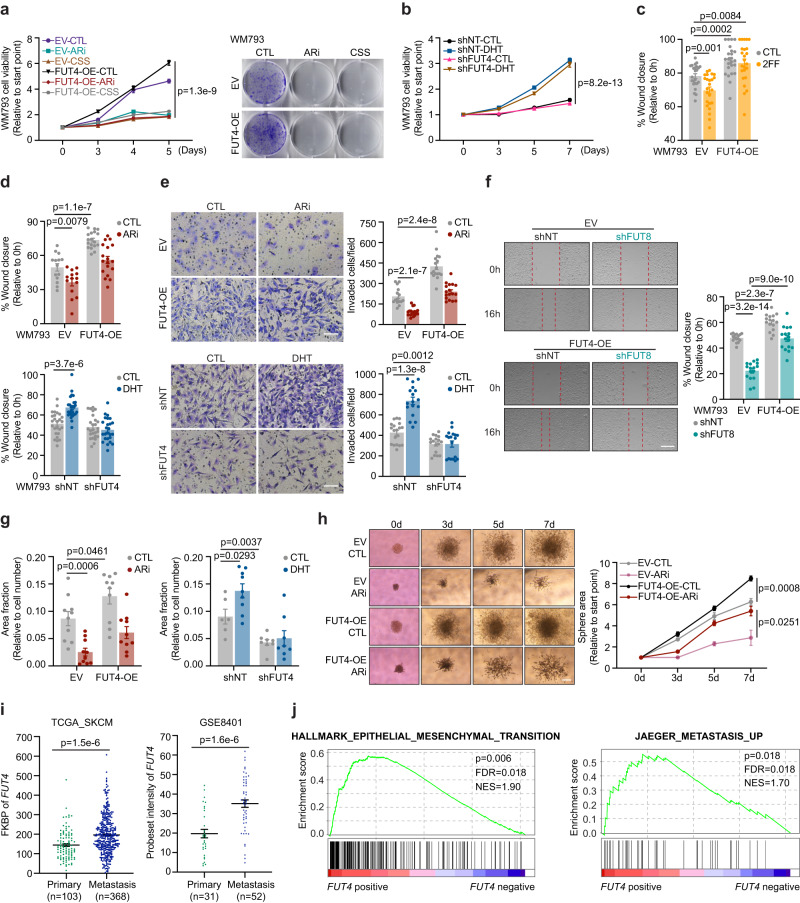
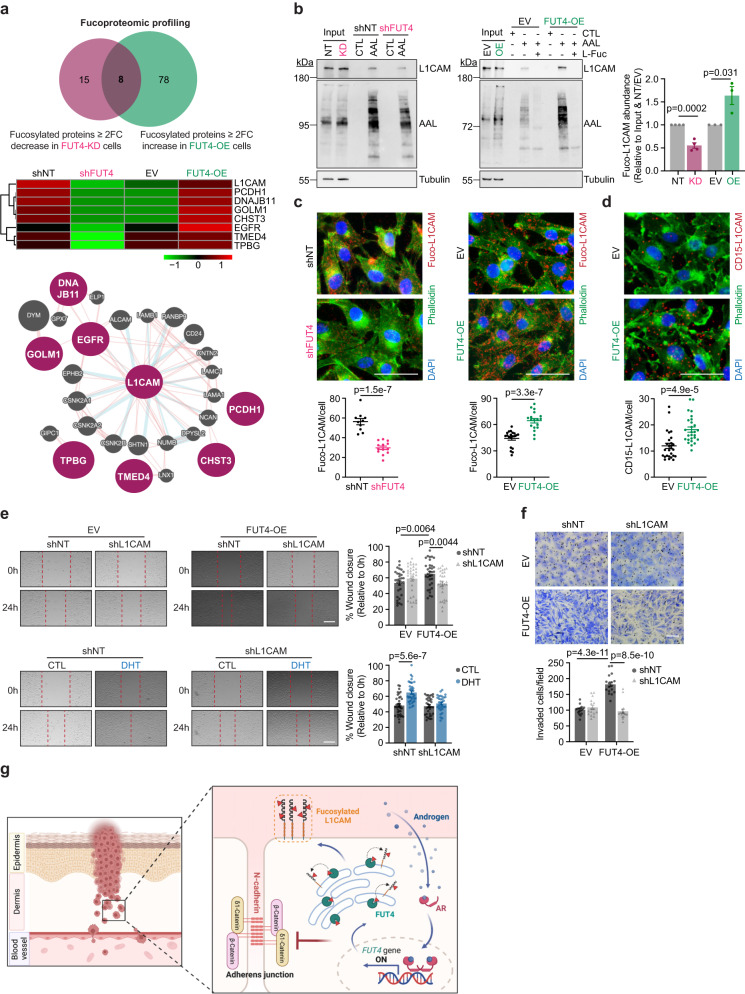
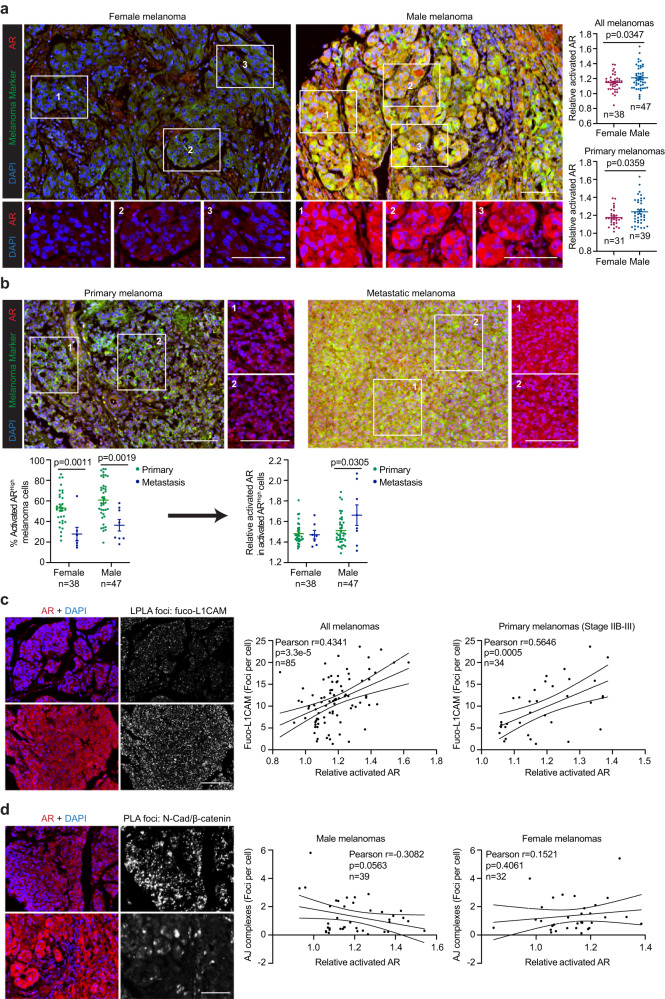
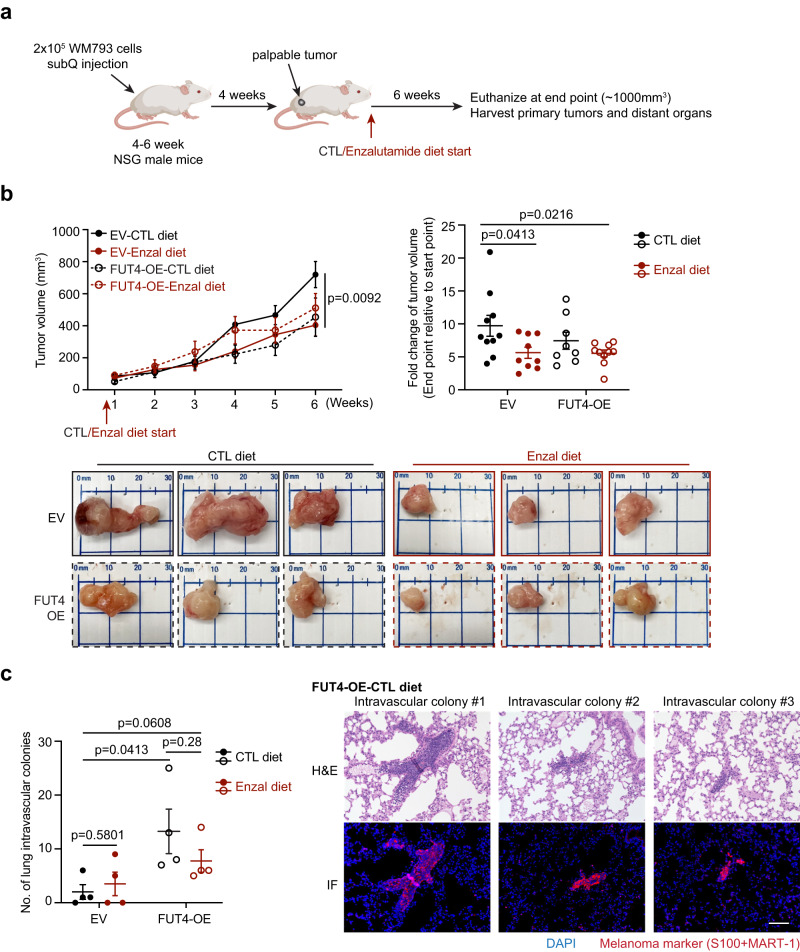
Melanoma incidence and mortality rates are historically higher for men than women. Although emerging studies have highlighted tumorigenic roles for the male sex hormone androgen and its receptor (AR) in melanoma, cellular and molecular mechanisms underlying these sex-associated discrepancies are poorly defined. Here, we delineate a previously undisclosed mechanism by which androgen-activated AR transcriptionally upregulates fucosyltransferase 4 (FUT4) expression, which drives melanoma invasiveness by interfering with adherens junctions (AJs). Global phosphoproteomic and fucoproteomic profiling, coupled with in vitro and in vivo functional validation, further reveal that AR-induced FUT4 fucosylates L1 cell adhesion molecule (L1CAM), which is required for FUT4-increased metastatic capacity. Tumor microarray and gene expression analyses demonstrate that AR-FUT4-L1CAM-AJs signaling correlates with pathological staging in melanoma patients. By delineating key androgen-triggered signaling that enhances metastatic aggressiveness, our findings help explain sex-associated clinical outcome disparities and highlight AR/FUT4 and its effectors as potential prognostic biomarkers and therapeutic targets in melanoma.


Conflict of interest statement

The authors declare no competing interests.

Figures

Fig. 1
Fig. 1. Melanomas express androgen-inducible, transcriptionally active AR, which drives proliferation and motility.
AR mRNA levels in a male vs. female or b primary vs. metastatic melanoma tissues from the TCGA skin cutaneous melanoma dataset (TCGA_SKCM; n = 473). c Immunoblotting (IB) analysis of baseline AR protein levels across 10 human melanoma cell lines. LNCaP prostate cancer cell line serves as a positive control for AR expression. Uncropped blots in Source Data. d Immunofluorescence (IF) staining of AR protein in WM793 cells treated ± 100 nM dihydrotestosterone (DHT) for 8 h. CTL, n = 18 fields; DHT, n = 23 fields examined over 3 independent experiments. Scale bar = 50 μm. e Whole cell lysate (WCL; left) and subcellular fractionation (center) IB of AR protein in WM793 cells treated with vehicle (CTL; upper) or 100 nM DHT (lower) over 96 h. For subcellular fractionation blots, tubulin and lamin A/C indicate cytoplasmic (Cyto) and nuclear (Nuc) fractions, respectively. Stacked column chart (right) shows quantified subcellular localization of AR protein from the blots (left and center). Uncropped blots in Source Data. f ARR2 luciferase reporter assay of WM793 cells treated ± 100 nM DHT for 48 h (n = 4 biologically independent samples). g (left) MTT assay of WM793 cells cultured in 10% fetal bovine serum (FBS) or 10% charcoal-stripped serum (CSS) ± 100 nM DHT for 4 days (10% FBS, n = 12; CTL, n = 12; DHT, n = 11 biologically independent samples). (center) BrdU staining (n = 26 fields examined over 3 independent experiments) and (right) scratch migration assay (CTL, n = 24 scratches; DHT, n = 32 scratches examined over 3 independent experiments) of WM793 cells treated ± 100 nM DHT for 48 h. h The fold-change of SM1 tumor volume in C57BL/6 mice at the end point (35 days after implantation). Mice were castrated at 1.5 weeks prior to injection (CTL, n = 3 mice; Castration, n = 5 mice). For b, d, f–h, data are presented as mean values ± standard error of the mean (SEM) and p-values are calculated by two-sided Student’s t-test. Source data are provided as a Source Data file.
Fig. 2
Fig. 2. AR transcriptionally upregulates FUT4 expression via binding to the ARE motif in the FUT4 promoter.
a (upper) Nineteen fucose salvage and de novo synthetic pathway genes. (lower) JASPAR-predicted AR binding sites in the 5’-promoter of the FUT4 gene and in the 3’-UTRs of FUT1, SLC35C2, and FUK genes. b qRT-PCR analysis of (left) FUK and FUT4 mRNA levels in WM793 cells treated ± 100 nM DHT for 8 h (FUK, n = 3; FUT4, n = 4 independent experiments), or (right), FUT4 mRNA levels in WM793 cells treated ± 100 nM DHT ± 10 μM AZD3514 (ARi) over 96 h (n = 3 independent experiments). c Heatmap visualization and d correlation matrix for the mRNA levels of 13 FUTs in the TCGA_SKCM samples. α-(1,3)-FUTs are indicated with green font. For d, the numbers represent Pearson correlation coefficients; red or blue color denotes positive or negative correlation, respectively. e Luciferase activity of FUT4 promoter with wild-type (WT) or site-mutant (S1, S2, S3) androgen response element (ARE) relative to empty vector (EV) control in WM793 cells treated ± 100 nM DHT or ± 10 μM ARi for 48 h (n = 4 independent experiments). f ChIP-qPCR analysis of the enrichment of endogenous AR protein at the −515-502bp 5’-promoter region of the endogenous FUT4 gene upon DHT treatment for 6.5 h (n = 4 independent experiments). g Gene set enrichment analysis (GSEA) illustrating the association of FUT4 expression with Hallmark_Androgen_Response gene signatures in TCGA_SKCM samples. p-value is calculated by two-sided permutation test. FDR, false discovery rate; NES, normalized enrichment score. For b, e, f, data are presented as mean values ± SEM and p-values are calculated by two-sided Student’s t-test. Source data are provided as a Source Data file.
Fig. 3
Fig. 3. AR regulates melanoma motility/invasion in a FUT4-dependent manner and regulates melanoma proliferation in a FUT4-independent manner.
a (left) Global phosphoproteomic profiling of EV vs. FUT4-overexpressing (OE) melanoma cells treated with 10 μM ARi for 48 h. Volcano plots showing phosphopeptides identified by LC-MS/MS to be ≥2-fold-change (FC) reduced by ARi (center left) that are or are not rescued by FUT4-OE (center right). p-values are calculated by two-sided Student’s t-test. DAVID pathway analysis identifying the enrichment of cell division-related signaling as AR-dependent, FUT4-independent (upper right) vs. cell adhesion-related signaling as AR- and FUT4-dependent (lower right). In DAVID, one-sided Fisher’s Exact test is adopted to measure the gene-enrichment in annotation terms. b Ingenuity Pathway Analysis (IPA) highlighting AR-FUT4-regulated protein signatures are predominantly enriched in adherens junction (AJ) signaling. p-values are calculated by one-sided Fisher’s Exact test. c Schematic diagram of AJ signaling between 2 adjacent cells (adapted from a Qiagen IPA-generated schematic). Red circles denote hits from our phosphoproteomic profiles. d In situ proximity ligation assay (PLA) for N-cadherin and catenin proteins in EV/FUT4-OE WM793 cells. N-cadherin/β-catenin PLA (upper): EV, n = 10 fields; FUT4-OE, n = 8 fields and N-cadherin/δ1-catenin PLA (lower): n = 7 fields examined over 1 independent experiment. Two other independent experiments in Source Data. Scale bar = 50 μm. e (upper) PLA and (lower) co-immunoprecipitation (co-IP) analyses evaluating the interaction between N-cadherin and β-catenin proteins in shNT/shFUT4 WM793 cells. PLA: shNT, n = 7 fields; shFUT4, n = 9 fields examined over 1 independent experiment. Two other independent experiments in Source Data. Scale bar=50μm. Co-IP: n = 4 biologically independent samples. Uncropped blots in Source Data. f PLA staining for N-cadherin and catenin proteins in parental WM793 cells treated ± 10 μM ARi for 48 h. N-cadherin/β-catenin PLA (upper): CTL, n = 11 fields; ARi, n = 8 fields and N-cadherin/δ1-catenin PLA (lower): n = 10 fields examined over 1 independent experiment. Two other independent experiments in Source Data. Scale bar = 50 μm. g Working model of AR-FUT4 axis in disrupting AJs to promote melanoma invasiveness (the schematic was created using BioRender). For d–f, data are presented as mean values ± SEM and p-values are calculated by two-sided Student’s t-test. Source data are provided as a Source Data file.
Fig. 4
Fig. 4. FUT4 is crucial for androgen/AR-stimulated melanoma migration and invasion in vitro.
a (left) XTT assay (5 days) and (right) clonogenic assay (14 days) of EV/FUT4-OE WM793 cells treated ± 10 μM ARi or cultured in 10% CSS (XTT assay: n = 6 biologically independent samples; clonogenic assay: representative images are shown for 3 independent experiments). b XTT assay of shNT/shFUT4 WM793 cells treated ± 100 nM DHT for 7 days (n = 12 biologically independent samples). c Scratch migration assays of EV/FUT4-OE WM793 cells treated ± 250 μM 2F-peracetyl-fucose (2FF) for 3 days (n = 24 scratches examined over 3 independent experiments). d Scratch migration assay (upper: EV-CTL/ARi, n = 14 scratches; FUT4-OE-CTL/ARi, n = 18 scratches examined over 3 independent experiments. lower: shNT-CTL/DHT, n = 26 scratches; shFUT4-CTL, n = 26 scratches; shFUT4-DHT, n = 25 scratches examined over 3 independent experiments) and e Matrigel invasion assay (upper: EV-CTL, n = 15 fields; EV-ARi, n = 17 fields; FUT4-OE-CTL/ARi, n = 17 fields examined over 2 independent experiments. lower: shNT-CTL, n = 19 fields; shNT-DHT, n = 17 fields; shFUT4-CTL, n = 17 fields; shFUT4-DHT, n = 18 fields examined over 3 independent experiments) of EV/FUT4-OE WM793 cells treated ± 10 μM ARi for 48 h (upper) or shNT/shFUT4 WM793 cells treated ± 100 nM DHT for 48 h (lower). Scale bar = 200 μm. f Scratch migration assay of FUT4/FUT8 double-modified WM793 cells. n = 16 scratches examined over 3 independent experiments. Scale bar = 400 μm. g FITC-gelatin degradation assay of EV/FUT4-OE WM793 cells treated ± 10 μM ARi for 48 h (left; n = 10 fields examined over 3 independent experiments) or shNT/shFUT4 WM793 cells treated ± 100 nM DHT for 48 h (right; shNT-CTL, n = 6 fields; shNT-DHT, n = 9 fields; shFUT4-CTL/DHT, n = 8 fields examined over 3 independent experiments). h 3D spheroid cell invasion assay with EV/FUT4-OE WM793 cells treated ± 10 μM ARi for 7 days (EV-CTL, n = 7; EV-ARi, n = 3; FUT4-OE-CTL, n = 4; FUT4-OE-ARi, n = 4 biologically independent samples). Scale bar = 200μm. i Comparison of FUT4 mRNA levels between primary vs. metastatic melanomas in TCGA_SKCM and GSE8401 datasets. j GSEA illustrating the association of FUT4 expression with Hallmark_Epithelial_Mesenchymal_Transition and Jaeger_Metastasis_Up gene signatures in TCGA_SKCM samples. p-values are calculated by two-sided permutation test. FDR, false discovery rate. NES, normalized enrichment score. For a–i, data are presented as mean values ± SEM and p-values are calculated by two-sided Student’s t-test. Source data are provided as a Source Data file.
Fig. 5
Fig. 5. FUT4-fucosylated L1CAM is required for AR-FUT4-induced melanoma invasiveness.
a (upper and middle) Fucoproteomic profiling of shNT/shFUT4 (FUT4-knockdown, FUT4-KD) and EV/FUT4-OE WM793 cells identified 8 proteins that are specifically fucosylated by FUT4 and (lower) GeneMANIA interactome mapping of the 8 protein hits highlighting L1CAM as the most centralized signaling protein (adapted from schematic generated in GeneMANIA). b Lectin pulldown (LPD) followed by IB analysis of L1CAM protein in shNT/shFUT4 (left) and EV/FUT4-OE (center) WM793 cells. Column chart (right) shows densitometric quantification for the blots (n = 3 independent experiments). Uncropped blots in Source Data. c Lectin-mediated proximity ligation assay (LPLA) staining for fucosylated-L1CAM (fuco-L1CAM) in shNT/shFUT4 WM793 cells (left; shNT, n = 10 fields; shFUT4, n = 13 fields examined over 3 independent experiments) and EV/FUT4-OE WM793 cells (right; EV, n = 20 fields; FUT4-OE, n = 18 fields examined over 4 independent experiments). Scale bar = 50 μm. d PLA staining for CD15 and L1CAM proteins in EV/FUT4-OE WM793 cells (n = 27 fields examined over 3 independent experiments). Scale bars = 50 μm. e Scratch migration assays of FUT4/L1CAM double-modified WM793 cells (upper; EV-shNT, n = 31 scratches; EV-shL1CAM, n = 32 scratches; FUT4-OE-shNT, n = 33 scratches; FUT4-OE-shL1CAM, n = 30 scratches examined over 3 independent experiments) and shNT/shL1CAM WM793 cells treated ± 100 nM DHT for 48 h (lower; EV-shNT/shL1CAM, n = 36 scratches; FUT4-OE-shNT, n = 34 scratches; FUT4-OE-shL1CAM, n = 31 scratches examined over 3 independent experiments). Scale bar, 400 μm. f Matrigel invasion assay on FUT4/L1CAM double-modified WM793 cells (EV-shNT, n = 17 fields; EV-shL1CAM, n = 16 fields; FUT4-OE-shNT/shL1CAM, n = 17 fields examined over 2 independent experiments). Scale bar = 200 μm. g Working model: During melanoma invasion through the dermis, DHT-activated AR transcriptionally upregulates FUT4, which then triggers melanoma migration and invasion through increased fuco-L1CAM and impaired junction structures (the schematic was created using BioRender). For b–f, data are presented as mean values ± SEM and p-values are calculated by two-sided Student’s t-test. Source data are provided as a Source Data file.
Fig. 6
Fig. 6. The activation of AR-FUT4-regulated signaling in male melanoma tissues.
a Representative images (left) and quantification (right) of multiplexed IF staining for tumor-specific activated AR in female vs. male melanoma tissues. Relative activated AR = the ratio of nuclear/cytoplasmic AR. b Representative images (upper) and quantification (lower) comparing activated AR levels between primary and metastatic melanomas in female and male patients (high level: above median level among all melanoma cells across the whole TMA). Representative images (left) and correlation analyses (right) of c activated AR and fuco-L1CAM (LPLA foci), as well as d activated AR and N-cadherin/β-catenin junction complexes (PLA foci). For a, b, data are presented as mean values ± SEM and p-values are calculated by two-sided Student’s t-test. For c, d, p-values are determined by two-sided correlation test based on Pearson’s coefficient. All scale bars = 100 μm. Melanoma marker: a cocktail of MART-1 + Tyrosinase + gp100. Source data are provided as a Source Data file.
Fig. 7
Fig. 7. The AR-FUT4 axis promotes accumulation of lung intravascular melanoma colonies in vivo.
a Experimental design for mouse tumor model. b (upper) The growth curve and end-point fold-change of EV/FUT4-OE WM793 tumors subcutaneously implanted in NSG mice fed with control (CTL) or enzalutamide (Enzal) diet (EV-CTL diet, n = 10 mice; EV-Enzal diet, n = 9 mice; FUT4-OE-CTL diet, n = 8 mice; FUT4-OE-Enzal diet, n = 10 mice). (lower) Representative images of primary tumors at the end point. c (left) Quantification of lung intravascular melanoma colonies (n = 4 lungs per group) and (right) representative H&E staining and corresponding IF staining of lung intravascular melanoma colonies in mice harboring FUT4-OE melanoma tumors fed with CTL diet. Scale bar = 100 μm. For b, c, data are presented as mean values ± SEM and p-values are calculated by two-sided Student’s t-test. Source data are provided as a Source Data file.

References

    1. Joosse A, et al. Sex is an independent prognostic indicator for survival and relapse/progression-free survival in metastasized stage III to IV melanoma: a pooled analysis of five European organisation for research and treatment of cancer randomized controlled trials. J. Clin. Oncol. 2013;31:2337–2346. doi: 10.1200/JCO.2012.44.5031. - DOI - PubMed
    1. Erturk K, Tas F. Effect of biology on the outcome of female melanoma patients. Mol. Clin. Oncol. 2017;7:1093–1100. - PMC - PubMed
    1. Natale CA, et al. Activation of G protein-coupled estrogen receptor signaling inhibits melanoma and improves response to immune checkpoint blockade. Elife. 2018;7:e31770. doi: 10.7554/eLife.31770. - DOI - PMC - PubMed
    1. Wang Y, et al. Androgen receptor promotes melanoma metastasis via altering the miRNA-539-3p/USP13/MITF/AXL signals. Oncogene. 2017;36:1644–1654. doi: 10.1038/onc.2016.330. - DOI - PubMed
    1. Ma M, et al. Sustained androgen receptor signaling is a determinant of melanoma cell growth potential and tumorigenesis. J. Exp. Med. 2021;218:e20201137. doi: 10.1084/jem.20201137. - DOI - PMC - PubMed